UNIVERSITÉ
DU
QUÉBEC
À MONTRÉAL
BlOACUMULA TION
AND TOXIC EFFECT OF ZINC ON THE GREEN ALGA
CHLORELLA VULGARISTHESIS
PRESENTED
AS A REQUIREMENT
FOR THE MASTER IN
CHEMISTRY
BY
LADAN ESMAEILI
Avertissement
La diffusion de ce mémoire se fait dans le respect des droits de son auteur, qui a signé le formulaire Autorisation de reproduire et de diffuser un travail de recherche de cycles supérieurs (SDU-522 - Rév.01-2006). Cette autorisation stipule que «conformément
à
l'article 11 du Règlement no 8 des études de cycles supérieurs, [l'auteur] concèdeà
l'Université du Québecà
Montréal une licence non exclusive d'utilisation et de publication de la totalité ou d'une partie importante de [son] travail de recherche pour des fins pédagogiques et non commerciales. Plus précisément, [l'auteur] autorise l'Université du Québec à Montréalà
reproduire, diffuser, prêter, distribuer ou vendre des copies de [son] travail de rechercheà
des fins non commerciales sur quelque support que ce soit, y compris l'Internet. Cette licence et cette autorisation n'entraînent pas une renonciation de [la] part [de l'auteur]à
[ses] droits moraux nià
[ses] droits de propriété intellectuelle. Sauf entente contraire, [l'auteur] conserve la liberté de diffuser et de commercialiser ou non ce travail dont [il] possède un exemplaire.»UNIVERSITÉ DU QUÉBEC À MONTRÉAL
BIOACCUMULATlON ET EFFET TOXIQUE DU ZINC CHEZ L'ALGUE VERTE CHLORELLA VULGARIS
MÉMOIRE
PRÉSENTÉ
COMME EXIGENCE PARTIELLE
DE LA MAÎTRISE EN CHIMIE
PAR
LADAN ESMAEILl
Firstly, 1 would like to thank my superv1sor Professor David Dewez, for his help, inspiration and encouragement. Thank you for this opportunity and for ali your support over the two years. This opportunity has taught me a lot about algae and about myself. 1 have also enjoyed working and getting to know you. Y our active interest in not just my science, but my career and general weil being is much appreciated.
1 would also like to thank Abdallah Oukarroum.Thank you for everything from answering ali my question and great support and significant guidance throughout the period of research. 1 also thank Professor Philippe Juneau and friendly team of his laboratory.
1 would also like to thank who Professors UQAM's helped me during the course of the master's program and the techenicians of the chemistry department, thank you to Mrs. Sonia Lachance and the pepole in chemistry department at UQAM.
1 wo
uld like to express my gratitude to my colleague Sahar Moghadam who always was beside me and help me and lending an ear to me when 1 need it. Y ou have been a great friend.Thank you to ali my laboratory colleagues who participated more or less directly to my research for various experiments. 1 will remember the good humor and constant availability in mutual: Francois, Mrs Lora, Lotfi, Loka and other colleagues . Also thanks to the members of the evaluation committee of my thesis for the ti me allocated to reading and evaluating it. Finaly, 1 want to say a big thank to my family Mehrdad and Sania, without you 1 could not do these studies 1 thank you very much for your encouragements and patience and your unconditional love.
TABLE OF CONTENTS LIST OF FIGURES ... .' ... vi LIST OF TABLES ... ix LIST OF OB VERA TION ... x RÉSUME ... xii ABSTRACT ... , ... xiii
GENERAL INTRODUCTION ... ! CHAPTERI INTRODUCTION TO WATER QUALITY ... 3
1.1 Heavy metals ... 5
1.1.1. Source of Heavy metals ... 6
1.1.2. Heavy metals in environment... ... 6
1.2 Zinc ... 8
1.2.1 physical and chemical properties ... 8
1.2.2. Zinc in the environment. ... 9
1.2.3 Estimated of Zinc in drinking-water ... 12 1 .2.4. Effects on hum an health ... 12 1.2.5 Environment toxicity of Zinc ... 13 1.3 Wastewater treatment technology ... 14
1.3. 1 Use of algae as a wastewater treatment... ... 15
BIOCHEMSTRY OF GREEN ALGAE ... 18
1.4 Microalgae cells ... 18
1 .4. 1 Chlore/la vulgaris green al ga ... 19 1.4.2 Microalgae growth dynamic ... 20
1.5. Photosynthesis ... 21
1.5.1 Structure and function of PSI!... ... 23
1.5.2 Chlorophyll tluorescence ... 25
1.5.3 OJIP test ... 26
1.6 Speciation and interaction of metals with living organisms ... 27
2.6.1 Metal speciation and bioavailability to algae ... 27
1 . 7 B iosynthesis of G luta th ione and phytochelati n ... 28
1.7.1 Detection ofphytochelatin as a biomarker ... 31 CHAPTER II MATERIALS AND METHODS ... 33
2.1 Materials preparations ... 33
2.2 Selection of al gal species ... 33
2.3 Culture condition ... 34
2.4 Composition growth media ... 35
2.4.1 Bold's Basal Media (BBM) ... .35
2.4.2 Preparation of experimental condition ... .36
2.6 Bioaccumulation of Zinc by Atomic absorption spectroscopy ... 37
2.6.1 Basic principle of AAS ... 37
2.6.2 Sample preparation ... 38 2.6.3 Estimation ofzinc bioacq11nulation in algae ... 38 2.6.4 Digestion of algae in ni tric ac id (HN03 ) ... 39
2.6.5 Preparation of AAS standard calibration solution ... 40 2.7 Measurment of Fluorescence ... 40 2. 7.1 Fluorometer Instrument. ... .40 2.7 .2 Sample preparation and Flurometry analysis ... 42 2.8 Methods for determined ofGSH and PCs ... 43 2.8.1 Basic principle of HPLC ... 43 2.8.2 Che1nicals ... .44 2.8.3 Sample preparation ... 45 2.8.3. 1 Sample collection and preparation ... .45 2.8.3.2 Extraction of PCs and GSH ... .46 2.8.3 .3 Reduction reaction ... .4 7 2.8.3.4 Derivisation of PCs ... .48 2.8.3.5 HPLC analysis ... .48 2.8.4 OptiJnization ... .49 2.8.4.1 Stability of phytochelatins ... 49 2.8.4.2 Determine of matrix effect on the florescence signal ... 50 2.8.4.3 Calibration standard curve for PCs ... 51 2.8.4.4 Calibration standard curves for glutathione and y-Giutamine-Cysteine .... 53
2.9 Statistical analysis ... 54
CHAPTER lll RESULTS AND DISCUSION ... 56 3.1 Growth- inhibitory effect of ZnCI2 on Ch/orel/a vulgaris .............................. 56 3.1.1 Growth inhibition of ce li density ... 56 3.1.2 Change in growth rates (!l) ... 58 3.2 Metal accumulation in biomass of C. vulgaris .......................... 60
3.3 Photosynthesis-inhibitory effect on algal cells ... 61 3.3.1 Change in chlorophyll fluorescence kinetics ... 61 3.3.2 Change in chlorophyll fluorescence parameters ... 64 3.3.3 Change in pigments content ... 73 3.4 Synthesis ofthiolated peptides ... 75 3.5 Discussion ... 81 3.6 Conclusion ... 84 REFERENCES ... 85
LIST OF FIGURES
Figure Page
1.1 Heavy metals are released to the marine system from various sources.· Typical sources are municipal wastewater-treatment plants,
manufacturing industries, mining, and agricultural cultivation and fertilization. Heavy metals may be volatilized to the atmosphere or stored in riverbed sediments. Toxic heavy metals are taken up by organisms; the metals dissolved in water have the greatest potential of causing the most injurious effects.
(Robert, H. Mead 1995) ... 4 1.2 G lobai production and consumption of certain toxic metals, 1850- 1990
( riagu, 1996) ... 6 1.3 Major Zinc end uses in Canada (Bradi, 2005) ... 10 1.4 Comparison of the effects of zinc intoxication versus deficiency.
Intoxication by excessive exposure to, or intake of, zinc (left hand si de), and deprivation of zinc by malnutrition or medical conditions (right hand side), have detrimental effects on different organ systems. Effects that could not be attributed to a certain organ system or affect severa! organs are classified as systemic symptoms. (M. Plum, Rink
and Haase, 201 0) ... 13 1.5 Montreal's wastè\ ater treatment plant (Spacing Montreal. 2009) ... 15 1.6 Picture of un Alga Bioreactors
(http://www.treehugger.com/20090514-algae-bioreactor.jpg) ... 17 1. 7 Integration scheme of applications of microalgae. Adapted, Bioalgene,2009 ... 17 1.8 Microscopie image of Chlore/la vulgaris
(http:/ /algaetech international.com/new/chlorella) ... 18 1.9 TEM micrograph of an individual chlorella cel!. C: chloroplast,
p: pyrendoid, n: nucleus, and cw: cel! wall (Stead et al., 1995) ... 19 1.10 Four growth phases of micro-algae cultures (Barnabé, 1990) ... 20 1.11 Structure of chloroplast (Biankenship, 1992; Meyer, 1994;
Wolfe & Hoober, 1996) ... 22 1.12 Schema tic of the organization of the photosynthetic prote in complexes
involved in the transport of electrons and photons in the thylakoid membrane of plants, Cyt: cytoch rome; Fd: ferredoxin, b6 f: dimeric intregral membrane FNR: ferredoxin-NADP reductase PC: plastocyanin, PS 1 and PS II: photosystem 1 and Il, P680: the PSII reaction center, P700: the PS 1 reaction center. according to:
(Maik in and Niyogi, 2000) ... 23 1.13 The Photosystem Il. QA and Q8, quinones A and B; Tyr: tyrosine;
b6f: dimeric integral membrane (Rawan, 1990) ... 24 1.14 Absorption spectra of different photosynthetic pigments
(Rawn, 1990) ... 25
1.15 Photochemistry and Possible ways of e:xcited chlorophyll in PSII
(Müller, Li and Niyogi, 2001 ) ... 26 1.16 Fluorescence induction curve representing the transitions OJ IP measured
on a logarithmic time scale; OJ represent, primary acceptor; JI, secondary acceptor and IP represent, the reducing reaction center of PSII in the excited state (Strasser, Srivastava and
Govindjee, 1995) ... 27
1.18 Three mechanisms of metal transport ac ross the cel! membrane.
Mechanism 1 represents transport ofhydrophilic metal ion species by ionie binding of metal ion to a cellular ligand on the cel! surface. Mechanism 2 represents transport of metal complexes involving an as imilable ligand. Mechanism 3 represents passive diffusion of lipophilic
species (Campbell and Hare, 2009) ... 28 1.19 Synthesis of glutathione from its constituent ami no acids. Glu: glutamic
acid; Cys: cysteine; Ser: serine; Gly: glycine (Noctor and
Foyer 1998) ... 29 1.20 Chemical structures of a phytochelatin, b glutathione, and c gamma-EC
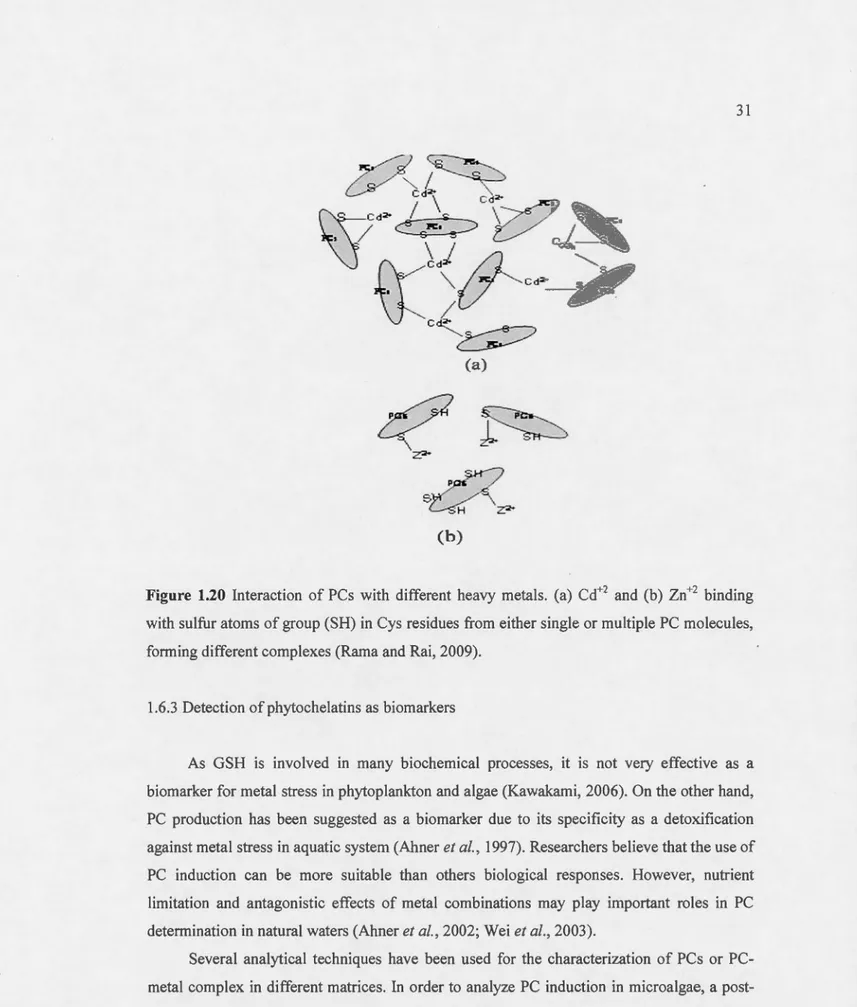
Fig. 1 Chemical structure of a phytochelatin. b glutathione, and c gamma-EC (Rama and Rai, 2009) ... 30 1.21 Interaction of PC with different heavy metal s. Heavy metal ions a) Cd '2 and
b) Zn'"2 binding with sulfur atom of Cys re idues from either single or multiple PC molecules, forming different complexes (Rama and
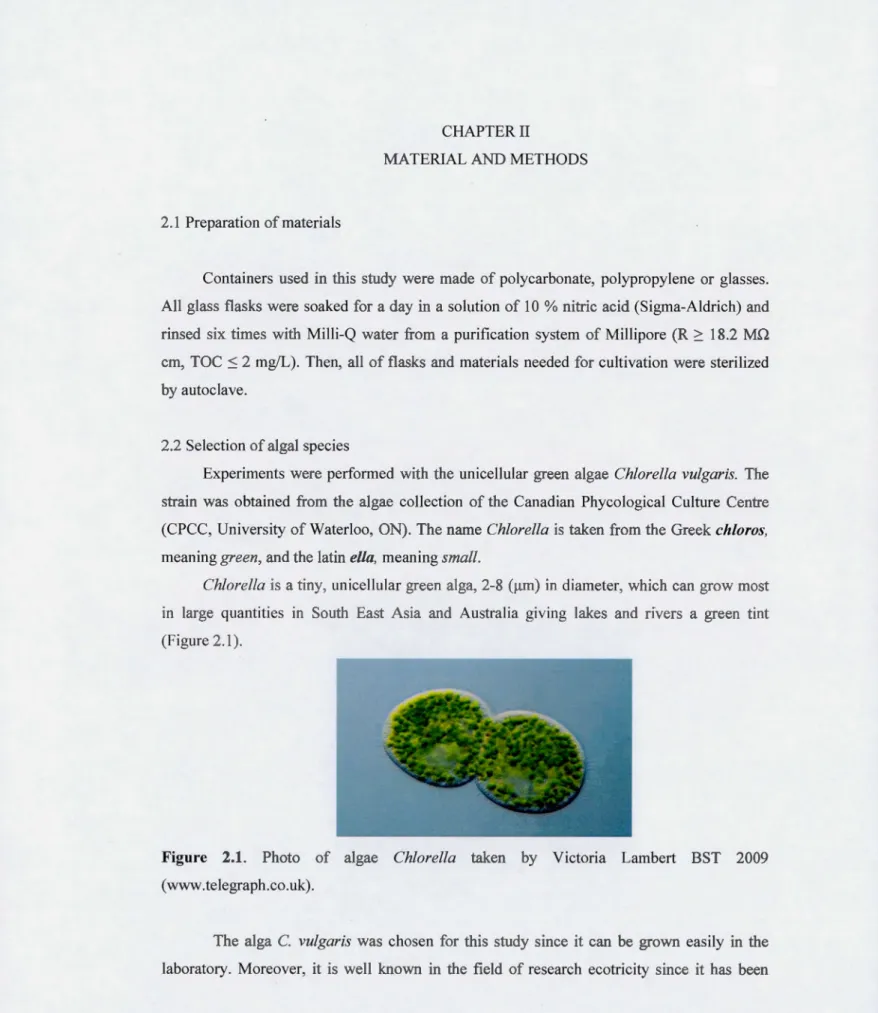
Rai, 2009) ... 31 2.1 Photo of algae Ch/orel/a taken by Victoria Lambert
BST 2009 (www.telegraph.co.uk) ... 33 2.2 Step alga cultivation from stock plate ... 37 2.3 Standard curve of growth rate and the proportion of optical density and
cel! density in three initial cel! densities ... 39 2.4 Steps of bioaccumulation of Zn in algae by Atomic absorption
spectroscopy ... 39 2.5 Standard calibration curve of Zinc by atomic absorption
spectroscopy ... .40 2.6 Kautsky curve of healthy green leaf and the expansion of the fast ri se
phase to the exponential OJIP curve (Strasser et al., 2004), F0 is minimum
fluorescence yield and FM is maximum fluorescence yield ... .41 2.7 Shematic of a High-performance liquid Chromatograph
(http/ :www.chemguide.co.uk) ... .43 2.8 Harvesting algae after exposure to metal. ... 45 2.9 Method used for the extraction of thiols ... .46 2.10 Reduction and derivisation process ... .4 7 2.11 Stability ofGSH and PCs in bimane form over 30 days
(Kawakami, Gledhill, Achterberg, 2006) ... 50 2.12 Matrix effect (algal) on standards PCs ... 51 2.13 Calibration tandard curve for a) PC2, b) PC3, c) PC4, d) PC5 ... 52 2.14 Standard calibration curve a) y Glutamin-syctein b) Glutathione (GSH),
VIII
c) cystein ... 53 3.1 Change of cel1 density of Chlore/la vulgaris exposed to ZnC12
at different concentrations( 1-100 mM) in function of ti me ... 58 3.2 Growth rates().!) of Chlore/la vulgaris exposed to different concentration
of Zinc ( 1-1 OOmM) for 96 h. The growth rate was calculated according this equation ).1 =(ln t2- ln t1)/ (trt1) where tl and Nt2 were the measured initial
and final cell densities, respectively. Rft1 and t2 were the expose times at initial and final measurement. ... 59 3.3 1ntracellular Zn accumulations in algal biomass of C. vulgaris exposed
du ring 72 h to various concentrations of Zn ( 1-100 mM). Error bars
represent standard errors obtained from three biological replicates ... 60 3.4 Fast rise of Chi fluorescence in alga C. vulgaris after 24h (A) and
48h (8) of treatment. Curve a: Control; Curve b: 1 mM of Zn; Curve c:
10 mM of Zn; Curve d: 50 mM of Zn; Curve e: 100 mM of Zn ... 63 3.5 Change offluorescence parameter Vj when algal cells ofC. vulgaris were
exposed for 48h to different concentrations of ZnCh ( 1,10,50 and 100 mM). 24h (A) and 48h (8). Vertical bars show standard errors, n=J ... 66 3.6 Changes of fluorescence parameter PI when algal ce lis of C. vulgaris were
exposed for 48h to different concentrations of ZnC12• 24h (A) and 48h (8).
Y ertical bars show standard errors, n=J ... 68 3.7 Change of fluorescence parameter Fv/Fm wh en al gal ce lis of C. vulgaris
were exposed for 48h to different concentrations of ZnC12. 24h (A) and 48h (8). Vertical bars how standard errors, n=3 ... 70 3.8 Change offluorescence parameter A8S/RC when algal cells ofC. vulgaris
were exposed for 48h to different concentrations of ZnCI2. 24h (A) and 48h (8). Y ertical bars show standard errors, n=J ... 72 3.9 Change of fluorescence parameter tot Chi when algal cells ofC. vulgaris were
exposed for 48h to different concentrations of ZnCI2. 24h (A) and 48h (8).
Y ertical bars show standard errors, n=3 ... 7 4 3.10 Glutathione (GSH) content in algal biomass of C. vulgaris exposed 24h to low
( 10 mM) and high ( 100 mM) concentrations of ZnC12. Vertical bars
indicated standards error, n=3 ... 77 3.11 Contents ofy-glutamy1cystein (y-G1uCys) and cystein (Cys) in algal biomass of
C. vulgaris exposed 24 h to low ( 10 mM) and high ( 100 mM) concentrations of ZnCI2. Vertical bars indicated standards error, n = 3. For statistical analysis, see Material and Methods section ... 78 3.12 Phytochelatins (PC2 and PC4) content in algal biomass of C. vulgaris exposed
24 h to low ( 10 mM) and high ( 100 mM) concentrations of ZnC12. Vertical bars indicated standards error, n = 3. For statistical analysis, see
Table page
1.1 Chemical identity of Zinc (O'Neil et al., 2001 ) ... 8
1.2 Physical and Chemical Properties of Zinc and Selected Compounds (O'Neil et al., 2001 ) ... 9
1.3 Natural Zinc leve! (total zinc) in the environ ment (Van A schc et al., 1996) ... Il 2.1 Concentration of macro and micro nutriments in culture medium (BBM) ... 35
2.2 Standard flame emission conditions for Zn ... 39
2.3 Equations and definitions ofOJIP parameters (Strasser et al 1995; 2004) ... .42
2.4 Gradient profile concentrationof the phases ... .49
AAS ABS ACN ATP BLM Chi a Chi b Chi Cys EDTA ET
F
M
Fo Fs Fv Glu Gly GSH HEP ES HN03 HPLC-FL ICP-MS LED mBrB Me-PC MeOH LIST OF ABREVIATIONSAtomic Adsorption Spectrometry Absorption by chlorophyll Acetonitrile
Adenosine tri-phorphate Biotic ligand mode! Chlorophylle a Chlorophylle b Chlorophylle Cystein
Ethylene diamine tetra acetic acid Electron transport
Maximum fluorescence (at approx. T = 1 sec) Initial fluorescence
Satationnaire Chi fluorescence Variable Chi fluorescence
Glutamic acid Glycine Glutathion
4-(2-hydroxyethyl)-1-piperazine ethane sulfonic acid Nitric acid
High performance liquid chromatography coupled fluorescence detector Mass Spectrometry inductively coup led plasma source
Light Emitting Diode Monobromobimane
Metal complexes phytochelatine Methanol
MSA ADPH PC PCn PCs PEA PI
P
Q
PSI PSIIQA
QB
R2 RC SH TCEP Zn Metasulfonic acidicotinamide adenosine di phosphate (reduced) Phytochelatine
Phytochelatine with n = 2, 3, 4 ... Phytochelaines
"Plant Efficiency Analyser"= fluorescence measuring apparatus Photosynthetic index
Plastoquinone Photosysteme 1
Photosysteme li
First qui none electron acceptor of PS!I Second quinone electron acceptor of PS!I Correlation coefficient
Reaction center Thiol functional group
Tris (2-carboxyethyl) phosphine Zinc
l' / RESUME
La pollution des milieux aquatiques par les métaux traces représente un problème majeur qui nécessite l'évaluation du risque de toxicité pour plusieurs espèces aquatiques. En particulier, le zinc est un oligo-élément qui peut être toxique à des concentrations élevées pour les organismes vivants, et la libération de Zn via les eaux usées représente un important problème de qualité d'eau douce au Canada. Dans le développement d'une nouvelle technologie de bioremédiation, les microalgues peuvent être utilisées pour le traitement des eaux usées, car elles ont la capacité de bioaccumuler les métaux. Le problème principal au niveau cellulaire est l'implication des mécanismes moléculaires au cours du processus de bioaccumulation des métaux dans les cellules d'algues. Afin de déterminer la capacité maximale des cellules d'algues de Chlore/la vulgaris à accumuler le Zn, l'efficacité de la bioaccumulation a été étudiée par l'estimation de la teneur en zinc dans la biomasse algale quand l'algue C. vulgarisa été exposée pendant 72 haux différentes concentrations de ZnCb. La capacité de la biomasse algale de bioaccumuler le Zn a été déterminée par spectrométrie d'absorption atomique et l'effet toxique du Zn bioaccumulé a été évalué sur l'activité photosynthétique en utilisant l'émission de fluorescence de la chlorophylle. L'induction des phytochélatine a été analysée qualitativement et quantitativement par chromatographie liquide à haute performance. Selon nos résultats obtenus, le rendement de bioaccumulation le plus élevé a été atteint pour la plus forte concentration de ZnC12 ( 100 mM) à 24 h de temps d'exposition. Dans ces conditions expérimentales, la bioaccumulation de Zn était cinq fois plus par rapport au témoin. La division cellulaire a diminué seulement de 25 %par rapport au témoin. L'inhibition de la photosynthèse, liée à l'activité de la photochimie et du transport des électrons du PSII, a seulement diminué de 60 % par rapport au témoin. L'induction de la teneur en glutathion dans les cellules d'algues a été 6 fois plus par rapport au témoin. La synthèse de phytochélatines a été fortement induite où le PC4 a du blé par rapport aux PC2. En outre, les résultats ont démontré que le Zn bioaccumulé induit un effet de toxicité beaucoup plus fort dans les cellules d'algues prés 48 h par rapport à 24 h d'exposition, comme en témoigne le nombre croissant de cellules mortes, une plus f01te action inhibitrice sur la photosynthèse, une plus faible absorption et capacité de séquestration en Zn. Enfin, nos résultats ont montré que, pour maintenir l'efficacité optimale de bioaccumulation, l'induction des groupes thiols était importante afin d'éviter les effets inhibiteurs du Zn. En conclusion, cette étude a permis de déterminer les limites d'utilisation de C. vulgaris pour la bioaccumulation en Zn dans le développement d'une technologie de phycoremédiation.
The pollution of aquatic environments by trace metals represents a major problem which requires the toxicity risk assessment for severa! aquatic species. Particularly, zinc is a micronutrient that can be taxie at high concentrations for living organisms, and the release of Zn through wastewater represents an important water quality problem in Canada. ln the development of a new bioremediation technology, microalgae can be used for wastewater treatment since they have the ability to bioaccumulate metals with high efficiency. Therefore, the main problem at cellular levet is the involvement of the molecular mechanisms du ring the bioaccumulation process of metals in al gal cells. ln arder to determine the maximum capacity of algal cells of C. vulgaris to accumulate Zn, the bioaccumulation efficiency was investigated by estimating the content of Zn in algal biomass when C. vu!garis was exposed during 72 h to different concentrations of ZnCh. The capacity of algal biomass to bioaccumulate zn2+ was detennined by atomic absorption spectrometry, and the taxie effect of bioaccumulated Zn was evaluated on the photosynthetic activity by using chlorophyll fluorescence emission. The induction of phytochelatins was analyzed qualitatively and quantitatively in relation to the bioaccumulated Zn by high performance liquid chromatography. According to our results, the highest efficiency of bioaccumulation was reached for the highest concentration of ZnCI2 ( 1 00 mM) at 24 h of exposure ti me. Und er this experimental condition, the bioaccumulation of Zn was five times more compared to the control. The cel! division decreased only by 25 % compared to control. The inhibition of photosynthesis, related to PSII primary photochemistry and electron transport activity, decreased only by 60 % compared to control. The induction of glutathione content in algal cells was 6 times more compared to control. The synthesis of phytochelatins was highly induced where the PC4 increased by 2 times in comparison to PC2. Moreover, these results demonstrated that the bioaccumulated Zn induced a much stronger toxicity impact in algal cells at 48 h in comparison to 24 h of exposure, as indicated by the increasing number of dead cells, a stronger inhibitory effect on photosynthesis, a lower uptake and sequestration capacity of Zn. Finally, our results showed that, to maintain optimal bioaccumulation efficiency, the induction of thiols group (glutathione and phytochelatins) was important for algal cells in arder to avoid the inhibitory effects of Zn. rn conclusion, this study permitted to determine the capacity and limitations of using C. vulgaris for the bioaccumulation of Zn in the development of phycoremediation technology.
GENERAL INTRODUCTION
Metals are found naturally in the earth and can be distributed into the environment through severa! sources such as erosion of the crust land, precipitation and volcanic emissions. However, anthropogenic activities can increase the release of metals in the environment through metallurgy and industrial wastes, and consequently changing metal concentration in different ecosystems. Lndeed, metals are closely linked to human civilization since the revolution of iron. The growth of the world population and the importance of metals in economies augment the needs for the production of metals in developing countries. The increasing production for metals will induce their dispersal and contact with the environment. In particular, industrial effluents are responsible to the pollution of aquatic ecosystems due to their high leve! in metals. Therefore, the quality of the environment and hu man health are at risk of harmful effects caused by the exposure to metals, considering both their speciation and bioavailability. Moreover, the remediation of wastewater represents one of the most important environmental problems for the preservation of water quality as a natural ressource.
ln pa1ticular, zinc is a micronutrient which can be toxic at high concentrations m water due toits solubility (Roberts et al., 1997; Coleman, 1998). Although zinc is an essential requirement for health of organisms, excess zinc can be harmful (Robe1ts et al., 1997). The free zinc ion in solution can be highly toxic to plants and animais (Coleman, 1998). In human health, the ingestion of zinc salts can provoke the release of phosphine gas which can enter the blood stream and affect the lungs, liver, kidney, heart and central nervous system (Eliott JL, 2006). Furthermore, the strong affinity of zinc for aquatic particles and organic matters may result in its deposition into sediments. lndeed, the release of large quantity of Zn through wastewater represents an important water quality problem in Canada. There are severa! methods available for the removal of metals, with advantages and disadvantages, which are deftned according to their effectiveness, necessity and quantity of chemical reagents as weil as energy. ln the development of a new bioremediation technology, microalgae can be used for wastewater treatment since they have the ability to bioaccumulate metals (Levy et al., 2007). Therefore, the main problem to study at cellular leve! is the molecular mechanisms of
detoxification involved during the bioaccumulation process of metals in algal ce lis. Indeed, it is important to determine the efficiency of algal cells to bioaccumulate metals in relation to
specifie environmental conditions (pH, light irradiance and temperature) and the algal
species.
The main objective of this Master study is to determine the bioaccumulation
. efficiency and the cellular effects induced by metal ions of zinc in green algal cells of
Ch/orel/a vulgaris. Our main hypothesis is that the efficiency of Zn bioaccumulation depends
on the metal concentration and the exposure time, and also on the induction of molecular mechanisms of metal sequestration. Our specifie objectives are: 1- The determination of the bioaccumulation capacity and efficiency when algal cells of C. vulgaris are exposed to different concentrations of ZnCh during 72 h; 2-The determination of the bioaccumulation toxic effects of Zn on cellular division and photosynthetic processes (Photosystem li
photochemistry activity); 3- The identification and quantification of synthesized thiolated peptides related to the induction of molecular detoxification mechanisms, especially the synthesis of glutathione and phytochelatins.
This Master thesis is organized into four mam chapters. In the first chapter, the
environmental context is defined, such as the problem of metal pollution, the preservation of
the quality of freshwater, the case of zinc, used wastewater treatment technologies and the
development of the phycoremediation technology. ln the second chapter, the biochemistry of green algae is presented, the criteria for the selection of algal species Chlorella vulgaris, the mechanisms of photosynthesis, the speciation and interaction of metals at cellular leve!, the induction of cellular and biochemical indicators of toxicity and mechanisms of cellular
detoxification of metals. Ln the third chapter, methodological approaches are presented such as cell count, chlorophyll fluorescence emission and liquid chromatography. Finally, the results obtained in this study are discussed in the fourth chapter.
CHAPTER I
1. Introduction to water quality
Water is a basic source of !ife representing an essential substrate to support ali !ife fonns such as plants, animais and humans (Vanloon and Duffy, 2005). There are two main natural sources: surface water such as fresh water lakes, rivers, streams, and ground water such as springhead water and weil water (McMurry and Fay, 2004; Mendie, 2005). One of
the most important environmental threats today is ground water contamination (V adela et al., 1997) and between the large varieties of contaminated water sources, some metals such as
mercury, cadmium play a keyrole with their strong toxicity even at low concentrations (Marcovecchio et al., 2007). Groundwater becames polluted when anthropogenic various
sources release substances which dissolved or mixed in waters canals (Environment of Canada, 201 0-08-05). Therefore, aquatic pollution has become one of the most important
environ mental problems. Each year, the industries produce for $ 1.5 tri Il ion in global chemicals, and tens of thousands of these substances are discharged into the environment. The sources of water pollution in Canada are acid rain, sail drifting, sedimentation, ground water contamination and wastewater (Environment Canada). Wastewater is a complex mixture of organic and inorganic materials with also man-made compounds. Huge amounts of organic carbon that is present in th sewage are carbohydrates, fats, proteins, amino and
volatile acids. The major its of inorganic matter consists of large concentrations of sodium, calcium, potassium, magnesium, ch lori ne, sulfur, phosphate, bicarbonate, ammonium salts
and heavy metals (Tebbutt, 1983; Horan, 1990; Lim and Phang, 201 0). Every day, people are exposed to a large amount of chemicals, from industrial pollutants in the air, to pesticide residues in foods, to heavy metals in drinking water.
Heavy metals such as Cd, Hg, Cu and Zn 111 wastewaters are dangerous for the environment. These ions may cause taxie and hannful effects to aquatic organisms (Aksu and
Kutsal, 1990). Jndeed, when these metals are released in the aquatic environment, they can be bioaccumulated in the food chain fTom various ways such as phytoplanktons and fish (Figure
1.4). Then birds nourish from fish and up to human as last consumers. Therefore, the concentration of pollutants will be increased from one link to another 1 ink in the food chain, a
phenomena named biomagnification. For these reasons, the development of technology for
the removal of metals from polluted zone is necessary (Torres et al., 1998).
Figure 1.1 Heavy metals are released into the marine system from various sources. Typical
sources are municipal wastewater-treatment plants, manufacturing industries, mining and
agricultural cultivation and fertilization. Heavy metals may be volatilized to the atmosphere
or stored in riverbed sediments. Toxic heavy metals are taken up by organisms; the metals
dissolved in water have the greatest potential of causing the most injurious effects (Mead and
Leenher, 1995).
Today the effect of the release of wastewater pollutants on aquatic ecosystems and
human health increased considerably. These impacts will have negative effects on fish and
wildlife populations, oxygen discharge, limitation on fish and shellfish harvesting,
consumption and drinking water consomption (Environment Canada). The pollution of the
aquatic environment by inorganic and organic chemicals has been identified as a serious
5
1 . 1 Heavy metals
Heavy metals are metallic chemical element with high range of atomic weights. They
have a density higher than 5 g mr'. Sorne of them such as mercury, lead and cadmium are toxic, dangerous to health and to the environment, even at low concentrations, but sorne bio
-essential elements such as zinc, copper and iron become toxic only at high concentrations (Hogan, 20 l 0). Approximately fifty-three of the ninety naturally elements are ca lied heavy
metals. Since the middle of the 19'11 century, the production of heavy metals increased
severely for more than 1 00 years, with simultaneously emissions to the environ ment (Figure
l. 1 ). At the end of the 20'11 century, however, emissions of heavy metals tend to redu ce in developed countries (Jarup, 2003).
Heavy metals are toxic when they are not metabolized and accumulate in the body. They can enter in the human body via food, water, air or absorption through the skin.
Industrial exposure ts common in adults and consumption is more incident in children
(Roberts, 1999). Iron, for example, prevents anemia and zinc is a cofactor in over 100
enzymatic reactions. However, some heavy metals such as Cd, Cr, and Pb have no special
activity, and are harmful. Long time exposure to heavy metals can damage the nervous system and also may cause physical, muscular and neurological degenerative processes like Alzheimer's disease, Parkinson's disease, muscular dystrophy, cancer and multiple sclerosis (Environment Healh center, 1999).
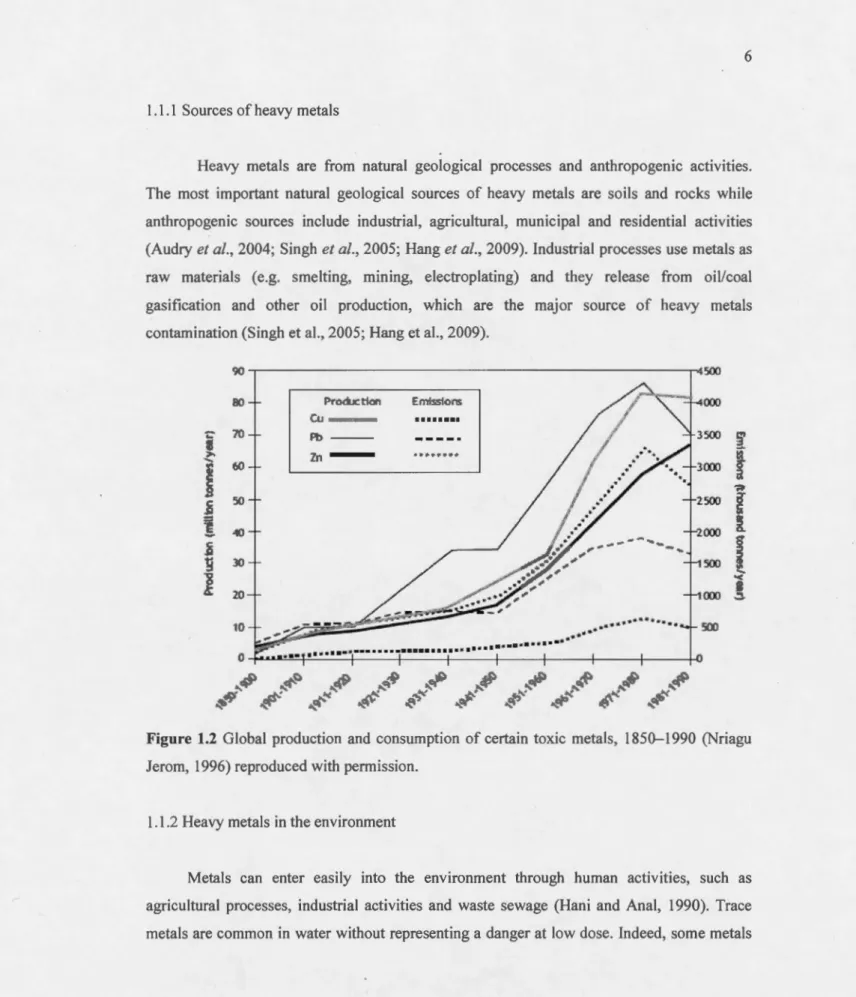
1.1.1 Sources of heavy metals
Heavy metals are from natural geological processes and anthropogenic activities. The most important natural geological sources of heavy metals are soils and rocks while anthropogenic sources include industrial, agricultural, municipal and residential activities (Audry et al., 2004; Singh et al., 2005; Hang et al., 2009). Industrial processes use metals as raw materials (e.g. smelting, mining, electroplating) and they release from oil/coal gasification and other oil production, which are the major source of heavy metals contamination (Singh et al., 2005; Hang et al., 2009). 90 80 Ptoducttoo tfi'IISSIOJ'r$ ÛJ • • 11 • • • • :œ 70 Pb -Zn -. >-... 60
"'
·fll •!:; c :S 50 ,.::; ~ ·~ 4() c $2a
301
20 10 0··
·
···-
~
···
~
··
·
···
·
···
·
·
~
_
...-
_
...
.
...
.
.
.
500 000 500 0003'
[
0 :::>"'
?~
"'
~ â. g :::> :::> ~ ... "< 12 .,Figure 1.2 Global production and consomption of certain toxic metals, 1850-1990 (Nriagu Jerom, 1996) reproduced with permission.
1. 1.2 Heavy metals in the environment
Metals can enter easily into the environment through human activities, such as agricultural processes, industrial activities and waste sewage (Hani and Anal, 1990). Trace metals are common in water without representing a danger at low dose. Indeed, sorne metals
7
are essential for life. Calcium, magnesium, potassium and sodium are fundamental for normal body functions. Zinc, copper, iron, manganese, molybdenum; selenium and cobalt are necessary at low amount as catalysts for enzyme activities. Drinking water containing high concentrations of these rn etals, or taxie rn etals su ch as aluminum, arsenic, barium, cadmium, chromium, lead, mercury, selenium, and silver, may be harmful to our health (Gadd, 2009). Metals may be as free metal ions or as complex ions, chelated with inorganic ligands such as Cl-, Or!, C03- or N03-, and can also create complexes with organic ligands such as amines, humic ac ids and proteins. The chemical forms of metals in the aquatic environ ment is depend on environmental variables such as salinity, temperature, pH, organic and particulate matter and biological activities (Lobban and Harrison, 1994).
The speed of industrialization and urbanization increases the chance for those heavy metals of being released into the natural environment. There are sorne major heavy metals with high toxicity risk ( e.g. arsenic, cadmium, chromium, lead, mercury) which have been identified in various ecosystem compartments such as water, soil and sediments (Audry et al., 2004; Singh et al., 2005; Zhang et al., 2009). Due to the wide distribution and critical health impacts, those heavy metals are in the list of pollutants to be monitored by the (WHO, USEPA), European Union and Health Canada.
Heavy metals in the aquatic environment can exist in many fonns, dissolved, colloidal and particulate (Audry et al., 2004). They can be link to sediments in different ways, including physio-chemical adsorption on sediments, clogging in amorphous materials and bioaccumulation in aquatic organisms (Tessier et al., 1979; Singh et al., 2005). Major of heavy metals are cations. For example zinc and copper, bath carry [ e +2] charge. This soluble
form of metals is more dangerous because it is quickly transported and more easily available to plants and animais. Metal behavior in the marine soft and salty (streams, lakes and rivers) environment is similar to that outside an aquatic system. Actually, many heavy metals tend to be collected at the bottom ofwater bodies and sorne ofthese metals will dissolve. The aquatic environment is more sensitive to the damaging effects of heavy metal pollution because aquatic organisms have more contact with the soluble metals (Nriagu, 1996).
1.2. Zinc
1.2.1 Physical and chemical properties
Zinc is the first element of group 12 in the periodic table and also is the 24111 most abundant element in the Earth's crust. It is found in nature and cover up 0.02 % by weight of the earth's cortex. Normally zinc is grey due to coating with an oxide or basic carbonate. It is very rare to find free zinc metal in nature. Pure zinc is bluish-white and shiny when polished.
lt has the atomic number 30 and the standard atomic weight of 65.38 amu. The metal present
hard and fragile at most temperatures but becomes soft and mel ting between 100 and 150 °C.
There is a variety of zinc fonns, such as zinc carbonate, zinc chloride and zinc acetate or zinc sulfide (Environ ment Health Criteria, 200 1). Chemical and physical properties of zinc and
selected compounds are presented in Table 1.1 and Table 1.2 (O'Neil et al., 201 0).
Table 1.1 Some chemical forms of zinc (O'Neil et al., 2001). Charaderistic Synonyms Registered !rode name(s) Zinc
Zlnc dust zinc powder
Asarco; L ·t5; Blue
powder; Cl 77945; Cl pigment Me!aJ S; Emanay zmc dust; Granular zinc; JASAD:
Merrilli!e; PASCO Chemieal fonmula Zn Chemieal structure Zn ldentilication numbers: CAS registry 7440-66-6 NIOSH RTECS ZG8600000
EPA hazar<lous No data
wasle OHMfTADS DOTI\JN/NAI IMCO shipping HSDB NCI n1ssss Zint, powder or dust, UN 1436; zinc, powder or dust, zinc ashes, IM04.3: zinc ashes. UN 1435 1344 No data
Zinc acetate Acetic acid, zinc salt; acetic acid, zinc(ll) salt; dicartJomethoxyzinc; oetan zinecnaty [Czech); zinc diacetate; zinc(ll) acetate
No data
557-34-6 (anhydrous) 5970-45-6 (dihydrate)
Zinc chfori'*'
Butter of zinc; chlorure de zinc (French); zinc (Chlorure de) (French); zinc butter; zinc
chloride (ZnCt,); zinc dichloride; zinco (cloruro di) (ltalian); zinkchlorid (Ge<rnan); zinkchloride (Du!ch) nnning flux (DOT)"; At3-0440; Zlntrace ZnCb Cl-Zn-Cl 7646-85-7 AK1500000 (anhydrous) ZH1400000 ZG8750000 (dihydra!e) No data No data No data 7216957
Zlnc acetate, Zlnc chloride, anhydrou", UN environmental haza.rdous 2331; zinc chloride, solution, substance, solid, NOS, UN 1840; zinc chloride, UN 3077 anhydrous, solution, IMO 8.3
1043 No data
1050 No data
9
Table 1.2 Physical and chemical properties of zinc and selected compounds (O'Neil et al., 2001 ). Property Molecular weight Co lor Physical state Metting point Boiling point Density (g/cm') Odor Odor thresho1d: Water Air Solubility: Water other sol\lent(s)
Zinc Zinc acetate Zinc chloride
65.36 183.48 136.29
Bluish-white, lustrous White granules White granules•
Solid metal Sol id Sol id
419.5 ·c 237 ·c {decomposes) 290 ·c
908 ·c No applicable 732·c
7.14 at 25 ·c 1.735 2.907 ~t 25 ·c
No data Faint acetous odorc Odorless; fume has acrid odor'
No data No data No data
No data No datn No data
Insoluble" 4.0x10⁴
mg/L at25 ·c; 4.32x10' mgn.. nt 25 •c;
6.7xto• mg/L at100 ·c' 6.14x10' mgn.. at 100 •c Soluble in acetic acld and 33 mgn.. in alcohol 1 g/1 3 ml alcohol; 1 g/2 ml
alkali gtyderol; 1 g/0.25 ml 2%
hydro-chloroacetic ac id Partition coefficJents:
K. (mUg) 0.1--8,000'; 40 (average)'; No data
39 in sandy loam soi!;
12.2 in sllndy soit"
No data
1.2.2 Zinc in the environment
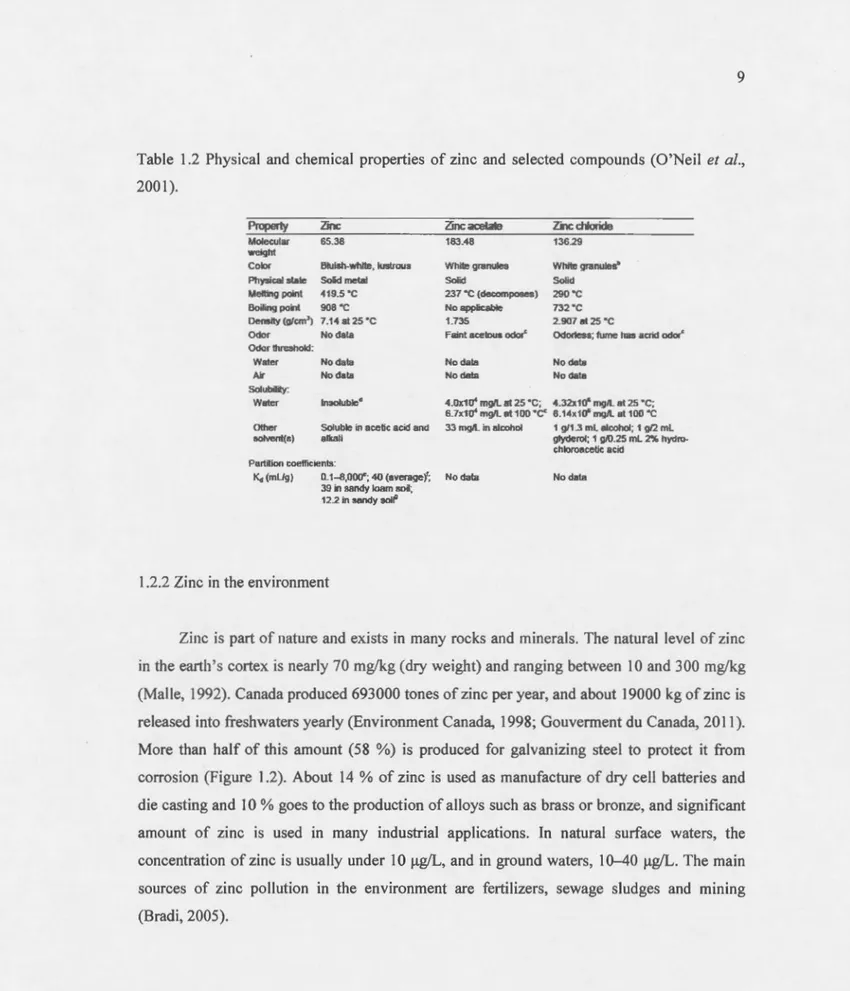
Zinc is part of nature and exists in many rocks and minerais. The natural leve! of zinc in the earth's cottex is nearly 70 mg/kg (dry weight) and ranging between 10 and 300 mg/kg (Malle, 1992). Canada produced 693000 ton es of zinc per year, and about 19000 kg of zinc is released into freshwaters yearly (Environment Canada, 1998; Gouverment du Canada, 20 Il). More than half of this amount (58 %) is produced for galvanizing steel to protect it from corrosion (Figure 1.2). About 14 % of zinc is used as manufacture of dry cell batteries and die casting and 10 % goes to the production of alloys such as brass or bronze, and significant amount of zinc is used in many industrial applications. ln natural surface waters, the concentration of zinc is usually under 10 11g/L, and in ground waters, 10-40 ~tg/L. The main sources of zinc pollution in the environment are fertilizers, sewage sludges and mining (Bradi, 2005).
Major Zinc End Uses
Figure 1.3 Major zinc end uses in Canada (Bradi, 2005) reproduced with permission.
Today's zinc concentrations are increasing unnaturally, due to addition of zinc through
human activities. Most zinc is entered to environment during industrial activities, such as
mining, coal and waste combustion and steel processing. Sorne soils are completely
contaminated with zinc, and these are to be found as sewage sludge from industrial zone. they
have been used as fertilizer or where zinc has to be mined or refined (Environment Health
Criteria, 2001). The major zinc mining areas are Canada, Russia, Australia, USA and Peru'.
The world production of Zinc is over than 7 million tons for year. At present more than 30%
of the world's need (zinc) provide by zinc recycling .. The bioavailability of zinc in water
depends on many factors such as temperature, water hardness, pH and dissolved organic
carbon content.Zinc i a recyclable material, and 2 millions tones of zinc are recycled every
Il
Table 1.3 Natural zinc leve! (total zinc) in the environment (Van Assche et al., 1996).
Air (rural} (JJg/m3)
Soil {general) (mg/kg dry weight}
Rocks
(ppm)
Ore bodies (o/~
Surface waters (JJg/1)
Ha.bitat-'fype.:
· basaltic igneous -granitic igneous ·· shales and clays
· sandstones · black shales
Range
0.01 . 0.2 10. 300 48. 240 5- 140 18·180 2. 41 34·1500 5 . > 150 pen ocean (surface) 0.001 - 0.06
Coastal seas/inland sea·s Freshv.rater:
- Alluvial lowland rivers rich in
nutrients a nd ol i g o·etements
o. 5
. 1(e.g. European lowland} 5 - 40
· Mounlain rivers from old, strongly leached geological
formations (e.g. Rocky Mûuntains) < 1 0
· Large lakes
(e.g. Gre at l akes) 0.09 · 0.3 (dissolved)
- Zinc-enriched streams flowing
1.2.3 Estimation of zinc in drin king water
lt has been reported in studies that the daily intake of zinc isabout 5-22 mg in different
areas of the world (Eiinder, 1986). The zinc content of typical diets of North American adults
is between 10 and 15 mg/day. The recommended dietary for adult men is about 15 mg/day,
for adult women 12 mg/day, for formula-fed infants 5 mg/day, and for preadolescent children
10 mg/day (Cousins and Heempe, 1990). Drinking-water usually makes a little contribution
to zinc intake unless high concentrations of zinc occur as a result of corrosion of pipings and
fittings. Un der certain condition, tapwater can provide up to 10% of the daily intake (Gillies and Paulin, 1982).
1 .2.4 Effects on human health
Critical toxicity happens from the consumption of excessive amounts of zinc salts,
either accidentally or as a dietary supplement. Yomiting usually happens after the
consomption of more than 500 mg of zinc sulfate. Most poisoning has been reported after the
drinking of acidic liquor kept in galvanized containers: fever, nausea, vomiting and stomach
cramps occurred 3- 12 h after ingestion. Food poisoning happens due to the use of galvanized
zinc containers in food preparation, and symptoms occur within 24 h including nausea,
vomiting and diarrhea, sometimes with bleeding and abdominal cramps (Eiinder, 1986; Kok,
1988). The high concentrations of zinc can cause adult respiratory distress syndrome, acute
renal tubular necrosis, chemical pneumonitis, interstitial nephritis, irritation and corrosion of
the gastrointestinal tract (Environment Health Criteria, 2001 ). Figure 1.3 shows effect of zinc
Zinc excess
Zinc deficiency
Brain Brain
•lethargy ...
- - - -
• Decreased nerva conduction• local neuronal deficits • Neuropsychiatrie disorders
• Neurosensory disorders • Mental lelhaJgy Re~plratory tract
• respira tory disorder aller lnhalat1on of zinc smoke
• Metal fume lever • Thymtc athrophy
Gastrolntestlnal tract • nausealvomiting • eplgastnc pain • diarrhea Pros~~ ~·~·
- - - -- - -
··
• elevated rlsk of prostate cancer . Systemic .symptoms.
.
.
.
.
...
1
·
Copper deficlency and sequelae • Altered lymphocyte fonction..
·
·
,..··
... Skin
- - - -
--• Skin lesions
····•··•·•••. • Decreased wound healing • Acrodermatilis
•····••·• .•. Reproductive system ·lntertility
• Retarded genital development • Hypogonadism
Systemlc symptoms • Growth retardation
• Immune dyslunction and infection
13
Figure 1.4 Comparison of zmc effects
int
ox
i
cat
i
o
n
versus deficiency. Intoxication by excessive exposure to zinc (left side), and deprivation of zinc by malnutrition or medical conditions (right side), has detrimental effects on different organ systems. (Pium, Rink and Haase, 201 0).1.2.5 Environmental toxicity of
z
in
c
Zinc 1s an essential ion playing a maJor role in over 300 enzymes (Vallee and Falchuck, 1993). However, Zinc
i
s
harmful to organisms at higher levels, by for example disrupting Ca homeostasis in freshwater fish through the induction of hypocalcaemia (Waurnaue
t
al
.
,
1996). Fish can accumulatez
in
c
gently over the time. Incomplete data are available to evaluate or predict the short term and the long-term effects of zinc andit
s
compounds to plants, birds, or land animais(G
illi
es
and Paulin, 1982). Soils with an excessive zinc problem can bet
ax
i
e
to plants. Soi! pHi
s
one the most factors that influences zinc availability to plants. Thetox
i
c
i
ty
ofz
in
c
in wateri
s
influenced by water hardness and pH. In lowert
ox
i
c
i
ty
of zinc, waters face with higher water hardness and lower pH, and inhigher toxicity of zinc the water has lower hardness and higher pH. Generally, zinc and its salts have high acute and chronic toxicity to aquatic system in polluted waters.
1 .3.1 Wastewater treatment technology
Today, wastewater treatment technology is composed on three different treatments for the remediation of water: Primary (physical) treatment is designed to remove big, suspended and floating sol ids from sewage. Primary treatment can reduce the BOD(biochemical oxygen demand) of the incoming wastewater by 20-30% and the total suspended sol ids by sorne 50-60 % (Horan, 1990). Primary treatment (filtration and sedimentation) is usually the first leve! of wastewater treatment. The goal of this step is to remove debris that could damage the treatment facility's equipment. Depending on the size of the particle, different types of filtration membrane such as ultra-filtration, nana-filtration and reverse osmosis can be used for heavy metal removal (Juang, 2000).
Secondary (biological) treatment removes the dissolved and suspended organic matter that escapes primary treatment. This step aims to reduce the BOD exerted by reducing organic matter. This step used the microbes for consuming the organic matter as food, and they converting it into carbon dioxide, water and energy for their own reproduction. The biological process (aerobic and non-aerobic pond) used sorne additional settling tanks to remove more of the dissolved solids. Secondary treatment can remove about 85 % of the suspended sol ids and BOD (Horn, 1 990). Secondary treatment technologies include the basic activated sludge process, the deferent of pond and wetland, dribbling filters and other forms oftreatment, which use biological process to break down organic matter (Kott et al., 1974).
Tertiary (chemical) treatment is kind of complementary stage for the secondary treatment. Chemical technologies are applied to decrease the mobility of metals by converting them into inactive states. Oxidation, reduction and neutralization reaction are normally used for remediation. The complete tertiary process can be applied to remove ammonium, nitrate and phosphate which is estimated to be about four times more expensive than the primary treatment (De la Noue et al., 1992). Chemical treatment can remove more than 99% of ali the impurities such as nitrogen and phosphorus from sewage. There are some examples of chemical treatment such as coloration, ozonation, chemical or electrochemical
15
rain (Ozdemir
et al
.,
2005), and ion-exchange treatments, which are not economical (Pehlivan & Altun, 2006). Figure 1.5 is showing a wastewater treatment plant in Montreal.Primary, secondary and even tertiary treatment cannot by expected to remove 100% of the pollutant materials and as a result, many microorganisms still remain in the waste stream. To prevent the spread of waterborne diseases and also to minimize public health problems, disinfection treatment with chlorine is required for the destruction of pathogenic organisms in wastewaters. However, sorne environmental authorities believe that chlorine residuals in the effluent can cause a problem in their process. Initial cost of wastewater treatment plant including primary, secondary or advanced stages is expensive (Oswaled, 1998), Also, many heavy metals can pass from this process. Therefore, we need cost-effective alternative technologies for the treatment of wastewaters containing rn etals (Bai ley et al., 1998).
Figure 1.5 Montreal's wastewater treatment plant (Spacing Montreal, 2009).
1.3 .2 Use of algae in wastewater treatment
Recently severa! biological methods have been investigated as alternative to physical and chemical methods. Algae have proved to be advantageous because they show severa! benefits, for example, economie instauration, metal recovery potentiality, lower volume of chemical and high efficiency to dilute effluents (Gupta and Rustogi, 2008). Microalgae are
suitable to maintain water quality because of the ir nu trient needs, rapid reproduction rate and very short !ife cycle. Trace metals (such as Co, Mo, Ca, Mg, Cu, Zn, Cr, Pb and Se) can be accumulated in algal cells by active biological transport (Yee et al., 2004). Moreover, algal cells have the ability to detoxify excess metals by producing extracellular and intracellular binding compounds such as phytochelatins (Moffet and Brand, 1996). The history of the commercial use of algal cultures such as Chlorella and Dunaliella is about 75 years old with the application in wastewater treatment and mass production. Recently, significant countries interested in developing this technology are in industrialized world nations, i.e., Australia, USA, Thailand, Taiwan and Mexico (Borowitzka and Borowitzka, 1988, 1989a,b; Moreno et al., 1990; Wong and Chan, 1990).
Microalgal cultures are an elegant solution as a tertiary and biochemical treatment due to their ability to use inorganic nitrogen and phosphorus for growth (Oswald, 1988; Tarn and Wong, 1995). Also, they are able to remove heavy metals (Rai et al., 1981), as weil as sorne toxic organic matter from wastewater. Microalgae offer a cost effective approach to removing nutrients.They have a high capacity for inorganic nutrient uptake (Blier et al., 1995). ln a previous study, Lau et al., (1996) reported the ability of Chlorella vulgaris in the removal of nutrients. Thier the results indicat a nutrient removal efficiency of 86 % inorganic N and 70 % inorganic P. In another paper, Colak and Kaya (1988) demonstrated an elimination of nitrogen (50.2 %) and phosphorus (85.7 %) in industrial wastewater treatment and elimination of phosphorus (97.8 %) in domestic wastewater treated by algae. Therefore, microalgae can be grown in ponds with little nutritional input or maintenance and this is an advantage. Many authors believed that this method.The separation of the metal saturated algae from the medium is an economie method for removing heavy metals from wastewater (Blier et al., 1995). Therefore, metal sequestering processes are dependent on the algal species, the metal ion species and the media conditions.
Today, microalgae can be applied in bioreactors for wastewater treatment (Figure 1.6). The harvested algae (biomass) can be converted into biofuel such as biodiesel and bioethanol as a renewable fuel (Sialve et al., 2009) (Figure 1.7). Another application of microalgae is be for food production. Algae contain high-level amounts of protein, ~-caroten and omega-3 (Varfolomeev and Wasserman, 2011). Algae are also a good source ofvitamins, minerais and fatty acids and they can improved the immune reaction of animais (Varfolomeev and
17
Wasserrnan, 2011 ). Therefore, microalgae have the posibility to simultaneously put fuels
in
our vehicles, recycle
C0
2 also provide nutrition for animais and people (Palmer, 1998).Figure 1.6 Pictures of al gal bioreactors (http://www.treehugger.
com/20090514-algae-bioreactor.jpg).
co' co•
~-· -... ""'" Capture and Cl un
4
2
Algao Grolllog Ponds81011\lSSCon lrs.>n ~ .,.
__
--
-·--
~ ~ 1. • . . 0 0 --Figure 1.7lntegration scheme of applications of microalgae (Adapted ofBioalgene, 2009).BIOCHEMISTRY OF GREEN ALGAE
1.4 Microalgal cell
As the first leve! of biological organization capable of !ife, the cell is the basic unit of structure and function of organisms. Cells have many membranes for their existence, which
defme each cell's boundary and help create electrochemical relation within and outside the
cell (Buchanan and Gruissem, 2000). Microalgae are microscopie photosynthetic
microorganisms which consist only of a single cell or unicellular. Microalgae are generally
efficient in utilizing sun light, C02, water and nutrients to produce high biomass yields. They
cao also be grown without the use of fertilizers and pesticides, which results in Jess waste and
pollution (Gouveia and Springer, 2011). In order to find the best way to cultivate algal strains
and maximize carbon dioxide consumption, severa) parameters are necessary, including light
intensity, temperature and media requirements (Richmond, 2004).
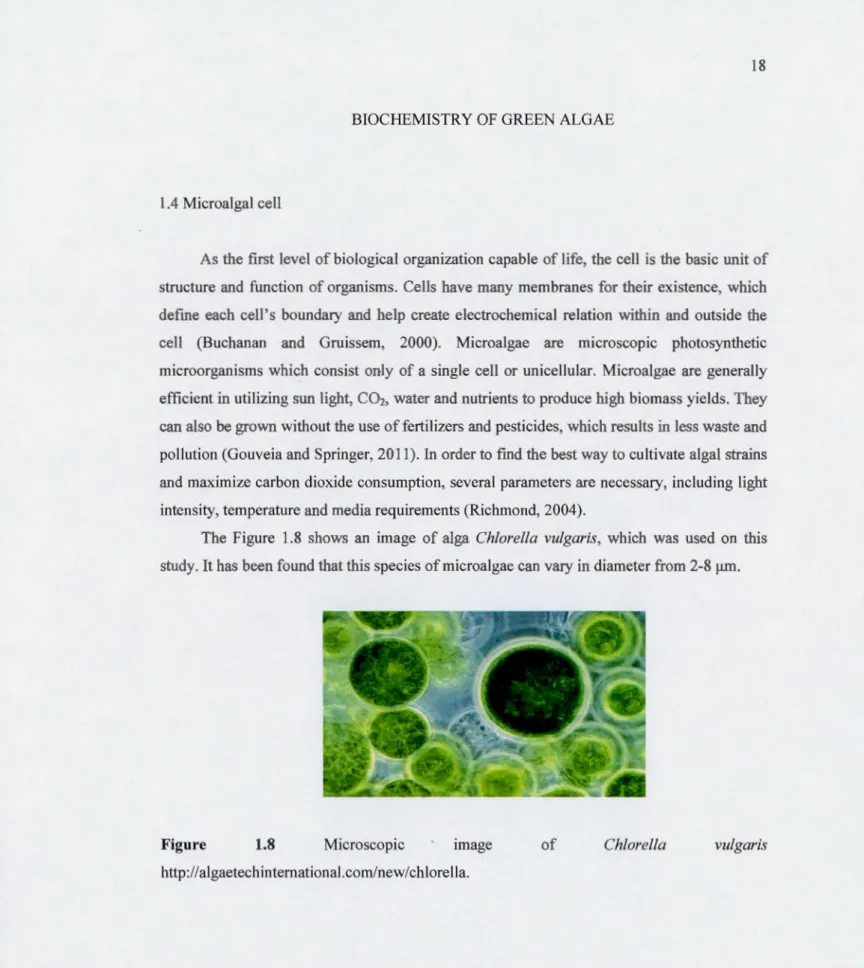
The Figure 1.8 shows an image of alga Chlorella vulgaris, which was used on this
study. It has been fou nd that this species of microalgae cao vary in diameter from 2-8 IJ.m.
Figure 1.8 Microscopie 1mage of Chlorella vulgaris
19
1.4.1 Chlore/la vulgaris
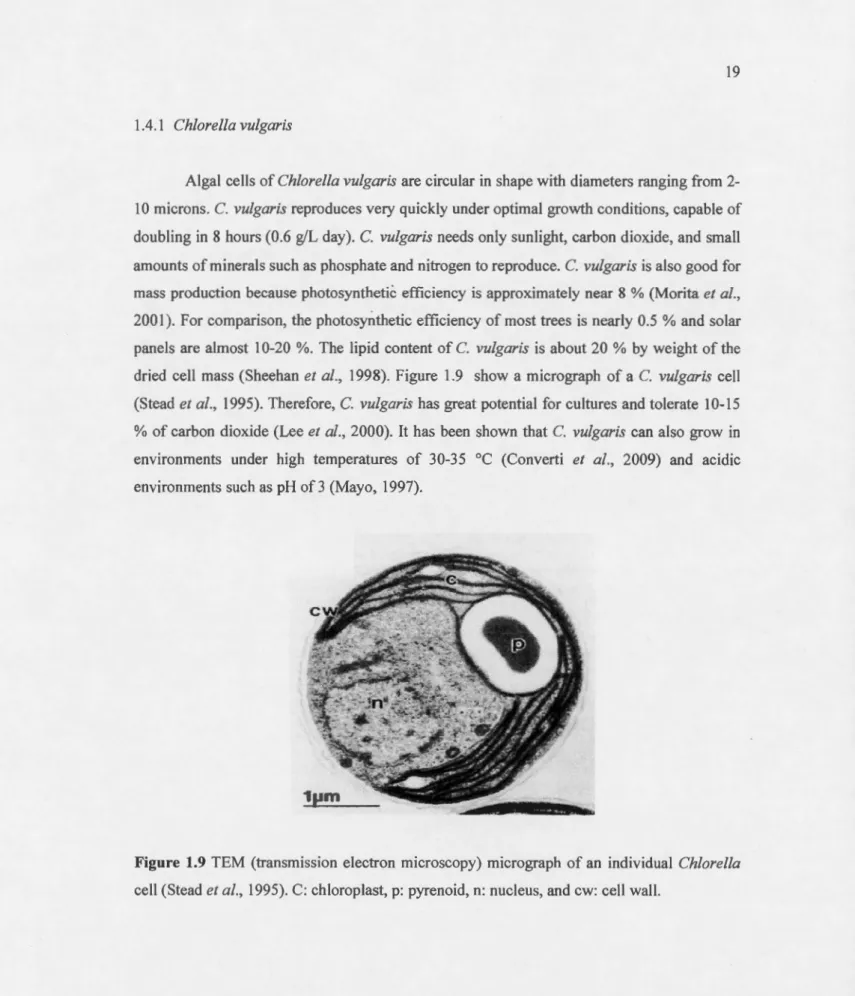
Al gal ce ils of Chlorella vulgaris are circular in shape with diameters ranging from
2-10 microns.
C.
vulgaris reproduces very quickly under optimal growth conditions, capable ofdoubling in 8 hours (0.6 g/L day).
C.
vulgaris needs only sunlight, carbon dioxide, and smallamounts of minerais such as phosphate and nitrogen to reproduce.
C.
vulgaris is also good formass production because photosynthetic efficiency is approximately near 8 % (Morita et al.,
2001 ). For comparison, the photosytithetic efficiency of most trees is nearly 0.5 % and sol ar panels are al most 10-20 %. The lipid content of
C.
vulgaris is about 20 % by weight of thedried cell mass (Sheehan et al., 1998). Figure 1.9 show a micrograph of a C. vulgaris cell
(Stead et al., 1995). Therefore,
C.
vulgaris has great potential for cultures and tolerate 10-15% of carbon dioxide (Lee et al., 2000). It has been shown that
C.
vulgaris can also grow inenvironments under high temperatures of 30-35
o
c
(Converti et al., 2009) and acidicenvironments su ch as pH of 3 (Mayo, 1997).
Figure 1.9 TEM (transmission electron microscopy) micrograph of an individual Ch/orel/a
1.4.2 Microalgae growth dynamic
The change in cel! density of micro-algal cultures is composed in four growth phases,
which are illustrated in Figure 1.10:
A: Induction phase or adaptation, when an algal culture is transferred from a plate to a liquid
culture, we can observe a little increase in cel! density.
B: Second phase (log phase), the cel! density increases in time according to a logarithmic
function. The specifie growth rate is normally dependent on algal species, light intensity,
media composition and temperature.
C: Stationary phase. Since the limiting factor and the growth rate are balanced, the cel! density will reach a constant leve!. Cel! division slows down when nutrients, light, pH, carbon dioxide or other physical and chemical factors begin to inhibit growth.
0: Oeath or "crash" phase. Ouring the final stage, the water quality decayed and nutrients are
decreased to a feeble leve! of standing growth. Cel! density decreases quickly and the culture
finally falls (Barnabé, 1990).
c
A
TI:ME
Figure 1.10. Four growth phases in microalgal cultures. A: Adaptation (lag phase); B:
Exponential growth phase (log phase); C: stationary phase; 0: Logarithmic death phase
21
1.5 Photosynthesis
Photosynthesis is the reduction of light energy of the sun into chemical energy by plants and algae. Plants can absorb water and burn sugars to releas energy for growing (Milan
and Librairie, 1970). The primary materials are carbon dioxide (C02) and water (H20), and
the end-products are oxygen and carbohydrates like sucrose, glucose or starch. This
modification of carbon dioxide into organic matter and production of oxygen make the
composition of our atmosphere providing for ali !ife fonns with essential food and fuel
(Nelson and Ben-Shen1, 2004). The overall equation for these reactions can be presented as
Photosynthesis consists of two different phases. The first phase, dependant of light
(mainly photochemical process of photosynthesis) which happened in the thylakoid
membrane. The photochemical reactions are linked to transport of electrons and protons for
the synthesis of adenosine tri-phosphate (ATP) and nicotinamide adenine dinucleotide
phosphate (NADPH). The second phase, is independent of light and it is called biochemical levet in the stroma. This phase consists of biochemical reactions related to the Calvin Cycle,
where the A TP and NADPH are used for the transformation of C02 into carbohydrates
(Shackleton and Robinson, 1991 ). In plants and algae, photosynthesis happens in organelles
named chloroplast. Normally, the plant cell has about 10 to 100 chloroplasts. The chloroplast can have a diameter of 5-l 0 flin and a dept of 3-4 ~tm (Buchan and gruissem, 2000).
The chloroplast is surrounded by a membrane composed of a phospholipids mner membrane, a phospholipids outer membrane and an inter membrane space between them
(Figure 1.11). There is an aqueous fluid within the membrane, called the stroma. The stroma
contains stacks of dises that are named thylakoids, and also stacks ofthylakoids named grana,
which are the site of photosynthesis. The interior of thylakoid membranes, composed of
Chloroplast
nner membrane
lumen
\
stroma la ellae
th~'lakold
nterr embrane space
© 2008 Encyclopoedia Britannica, lnc.
s roma
Figure 1.11 Structure of a chloroplast (www.britannica.com).
outer membrane
1
g anum
ln thylakoid membranes, four types of protein complexes are involved m the conversion of light energy into chemical energy (Figure 2.5).
These protein complexes include (Malkin and Niyogi, 2000): 1. Two light collector antennas (LHCI and LHCll);
2. Two reaction centers as PSI and PSll (P680 and P700);
3. A transmembrane enzyme system, named A TP synthase;
4. Electron transport carriers between PSI and PSII, as plastoquinones (PQ),
cytochrome-b6f complex and plastocyanines (PC).
The hotosynthesis system requtres the collaboration of two photosystems (Figure 1.12). Photosystem I (PSI) includs iron-sulfur reaction centers joined with proteins as terminal electron acceptors and many polypeptides that play a major rote in the connection between plastocyanin and P700. Photosystem II (PS li) contains four manganese atoms and a dozen polypeptides. The antennae have many pigments proteins complexes involved as light harvesting collector (LHC) near the heart and trimetric LHC II in the periphery. DI and D2
23
proteins (about 33 kDa) are the active center of PSII for charge separation (Buchanan and Gruissem, 2000).
®
chloroplast stroma
ADPATP
ferredoxln-NADP reductase®
.
®
.
plastocyanin :@
®
H'
...
.
...
...•••..
-..f'H:\
~ • • • • • 11 4! • • • • • • • • • • • • • • • • •• •• • ••• • • • • • • • • • • • • • • - · · · · • • 1 • • • • oxygen-evolving complexthylakoid lumen
Figure 1.12 Schematic organization of the photosynthetic prote in complexes involved in the
transport of electrons in the thylakoid membrane of plants. Cyt, cytochrome; Fd, ferredoxin;
b6f, dimeric integral membrane; FNR, ferredoxin-NADP reductase; PCm plastocyanin; PSI and PSII, photosystem I and II; P680, the PSII reaction center; P700, the PSI reaction center (Malkin and Niyogi, 2000).
1.5
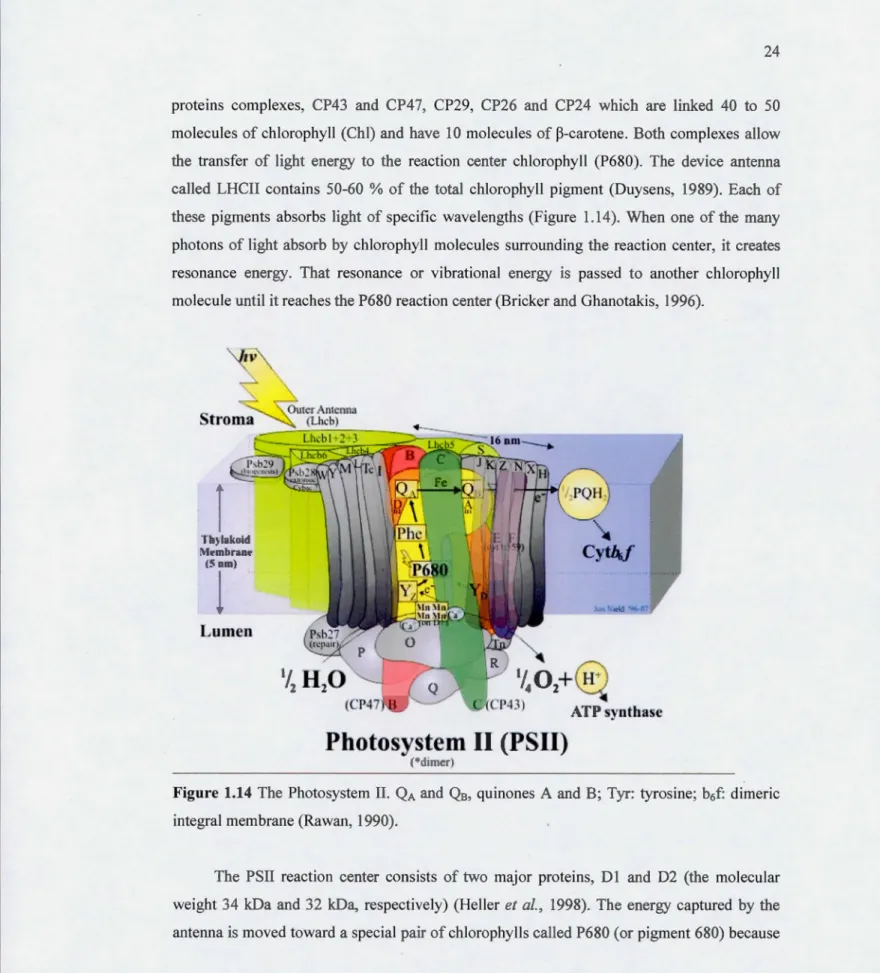
.1
Structure and fonction of PSIIThe primary photochemical reactions of pbotosynthesis happeos in the Photosystem II. Photosystem II has severa) key parts such as light harvesting chlorophyll-binding proteins, a
pair of chlorophyll molecules known as the P680 reaction center, pheophytin molecules, and
plastoquinones (Figure 1.13). The light-harvesting protein complexes include huodreds of
pigment molecules, essentially chloropbyll
a
,
b and carotenoids (Jaosson, 1994). There are two group of antenna complex in PSII: The internai antenna consists of manypigments-proteins complexes, CP43 and CP47, CP29, CP26 and CP24 which are linked 40 to 50
molecules of chlorophyll (Chi) and have 10 molecules of ~-carotene. Both complexes allow
the transfer of light energy to the reaction center chlorophyll (P680). The deviee antenna called LHCII contains 50-60 % of the total chlorophyll pigment (Duysens, 1989). Each of these pigments absorbs light of specifie wavelengths (Figure 1.14). When one of the many
photons of light absorb by chlorophyll molecules surrounding the reaction center, it creates
resonance energy. That resonance or vibrational energy is passed to another chlorophyll
molecule until it reaches the P680 reaction center (Bricker and Ghanotakis, 1996).
IV
•
1 h~lukuid !\l~mbran~ (5 nm)•
Lumen 1/0+
4 2w
ATP ynthascPhotosystem Il (PSII)
c•
d•m
r)Figure 1.14 The Photosystem II. QA and Q8, quinones A and B; Tyr: tyrosine; b6f: dimeric
integral membrane (Rawan, 1990).
The PSII reaction center consists of two major proteins, D 1 and 02 (the molecular weight 34 kDa and 32 kDa, respectively) (Helier et al., 1998). The energy captured by the antenna is moved toward a special pair of chlorophylls called P680 (or pigment 680) because
25
it has a maximum absorption of light at 680 nrn. After reduction ofPSII pheophytin, electron
is passed to QA and Q8, and then to the PQ, the cytochrome b6f and the plastocyanin. These
plastoquinone molecules are located in the D2 and Dl proteins. The P680 is reduced by the oxygen-evolving complex, and two water molecules are needed for the water splitting to provide electrons to reduce the P680. (Diner and Babcock, 1996).
Wavcl 'll"lh (mn)
Figure 1.14 Absorption spectra of different photosynthetic pigments (Rawn, 1990).
1.5.2 Chlorophyll fluorescence
Light energy that is absorbed by chlorophyll in plants has three fates: a) it can be used
to run photosynthesis (photochemistry), b) dissipated as heat or c) re-emitted as red fluorescence (Baker, 2008). The chlorophyll (Chl) fluorescence is a rich and complex signal.
Wben chlorophyll molecules absorb a photon via an excess Iight, the molecule if is excited from the ground (Chi) to the fust electronic excited state (Chi') within < 10-15 s·' (Figure 1.15). These excited state molecules can reach higher energy leve) Cchi*). The molecule will return to the ground state by re-emitting its energy as light in the form of fluorescence, as
L h
.
+
'o
2y
Chl
o2
'Chi*
l
\ _ 1Chl*
...
photochem
istry
he at
fluorescence
Figure 1.15 Photochemistry and ways of excited chlorophyll in PSTI (Müller, Li and Niyogi, 2001).
Dissipation energy in form of fluorescence was discovered in 1931 by Kautsky and Hirsh (1931).The chlorophyll fluorescence is mainly derived from the Chi a ofLHCII (Lazar,
1999). By measuring the chlorophyll fluorescence yield, information related to changes in the
efficiency of photochemistry and heat dissipation can be obtained. Chlorophyll fluorescence
kinetics measurement is an important tool for the molecular analysis of state of the PSII photochemical reactions and electron transport between PSTI and PSI.
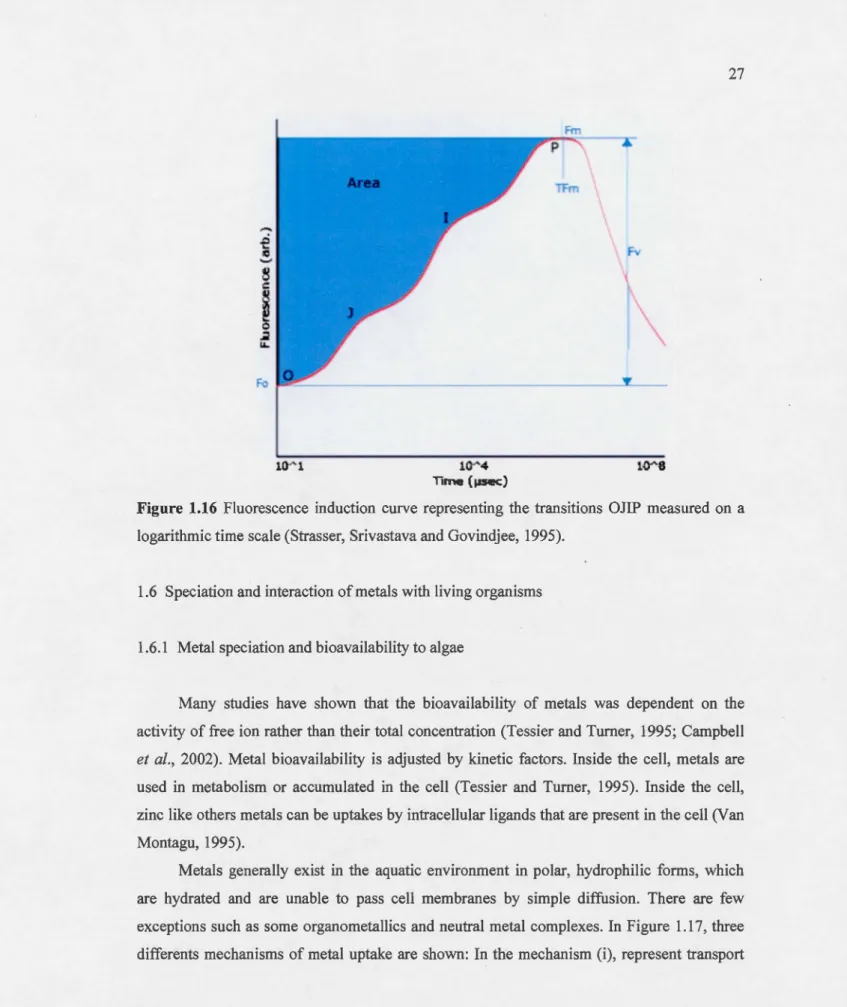
1.5.3 OJ1P Test
For the first time, Strasser, Srivastava and Govindjee (1995) showed that there are
different stages in the growth curve of the rapid induction of chlorophyll fluorescence from
the initial leve) (F0 ) to the maximum level (FM)- When presented on a logarithmic time scale,
this fluorescence kinetic show severa) transitions: Fo,
F1,
F1 and Fr (Fr = FM)- In fact, theyshowed that transitions 0-J-I-P is related to the redox state in the reaction center of PSTI
(Figure 1.16). Over a period of ls , the fluorescence leve! from Fo reaches the maximum
lev el FM (Strasser and Stirbet, 2001 ). The OJ phase is the reduction of the primary electron acceptor, QA. The fluorescence leve! of the transition I is (FI) the first reduction of Q8 (QA -Q8-) (Strasser et al., 1995). Finally, IP represents the reducing ofthe electron acceptor side of