OATAO is an open access repository that collects the work of Toulouse
researchers and makes it freely available over the web where possible
Any correspondence concerning this service should be sent
to the repository administrator:
[email protected]
This is an author’s version published in:
http://oatao.univ-toulouse.fr/21775
To cite this version:
Perez, Arnaud J. and Beer, Robin and Lin, Zifeng
and Salager, Elodie and
Taberna, Pierre-Louis
and Abakumov, Artem M. and Simon, Patrice
and
Tarascon, Jean-Marie Proton Ion Exchange Reaction in Li3 IrO4 : A Way to New
H3+ x IrO4 Phases Electrochemically Active in Both Aqueous and Nonaqueous
Electrolytes. (2018) Advanced Energy Materials, 8 (13). 1702855. ISSN 1614-6832
Proton Ion Exchange Reaction in Li
3
1r0
4:
A Way to New
H
3+x
lr0
4
Phases Electrochemically Active in Both Aqueous
and Nonaqueous Electrolytes
Arnaud J. Perez, Robin Beer, Zifeng Lin, Elodie Salager, Pierre-Louis Ta berna,
Artem
M.
Abakumov, Patrice Simon, and Jean-Marie Tarascon*
Progress over the past decade in Li-insertion compounds has led to a new class ofli-rich layered oxide electrodes cumulating both cationic and anionic redox processes. Pertaining to this new class of materials are the Li/Na iridate phases, which present a rich crystal chemistry. This work reports
compared to the 200 mA h g-1 of the pres ently used LiNi0.6Mn0.2Co0.202 layered oxide, or NMC 622. Both phases have the same layered structure but solely differ by the presence of Li in the transition metal layers for the Li-rich NMC phases.
on a new protonic iridate phase H3+xlr04 having a layered structure obtained
by room temperature acid-leaching ofli31r04• This new phase shows revers
ible charge storage properties ofl .5 e- per Ir atom with high rate capabilities
In order to understand the scientific background of the anionic redox process in the complex Li-rich NMC materials containing three competing redox centers, scientists have searched for simplified model compounds. Among them, the Li-based ruthenates and iridates Li2M03 (M = Ir, Ru),(1-3l which possess a layered structure and can be described as Li-rich oxides Li(Li113M2;3)02, show a reversible capacity of 270 mA h g-1 and present a less complex redox chemistry because of a sole redox center M. The synthesis of these phases is well documented as they
in both nonaqueous (vs U+/Li) and aqueous (vs capacitive carbon) media. lt
is demonstrated that Li-insertion in carbonate LiPF6-based electrolyte occurs
through a classical reduction process (lr5+ � 1r3+), which is accompanied by a
well-defined structural transition. ln concentrated H2S04 electrolyte, this work
provides evidence that the overall capacity ofl.7 H+ per Ir results from two
additive redox processes with the low potential one showing ohmic limitations. Altogether, the room temperature protonation approach, which can be general ized to various Li-rich phases containing either 3d, 4d or Sd metals, offers great opportunities for the judicious design of attractive electrode materials.
1. Introduction
The field of Li-ion batteries is going through its own paradigm shift with the emergence of the anionic redox process, whereas so far Li-ion batteries were solely relying on cationic redox pro cesses to store energy. The advantages of cumulating cationic and anionic redox processes is exemplified by the numerous studies on the layered Li1.2Ni0.13Mn0.54Co0.1302, denoted Li-rich NMC, which exhibits capacity as high as 290 mA h g-1, to be
Dr. A. j. Perez, R. Beer, Prof. j.-M. Tarascon
Chimie du Solide et Energie-UMR 8260-Collège de France 11 place Marcelin Berthelot, 75005 Paris, France
E-mail: [email protected] Dr. A. j. Perez, Prof. j.-M. Tarascon
Sorbonne Université-UPMC Univ Paris 06 4 Place Jussieu, 75005 Paris, France
Dr. A. j. Perez, R. Beer, Dr. Z. Lin, Dr. E. Salager, Dr. P.-L. Taberna, Prof. P. Simon, Prof. j.-M. Tarascon
Réseau sur le Stockage Electrochimique de ['Energie (RS2E) FR CNRS 3459, 33 rue Saint Leu, 80039 Amiens, France
The ORCID identification number(s) for the author(s) of this article can be found under https:/ /doi.org/10.1002/aenm.201702855. DOi: 1O.1002/aenm.201702855
have been the subject of intense funda mental studies on magnetism because of complex spin-orbit coupling effects.
Although these model Ru/Ir-based compounds have lim ited practical interest for the next generation of Li-ion bat teries because of the poor abundancy of both Ru and Ir, they have strongly contributed to their fundamental understanding. Studies of the Li2Ru1_xSnx03 or Li2Ir03 phases were, for instance, essential to demonstrate that the extra capacity in Li-rich NMC materials was due to anionic redox,11l and that the origin of voltage fade in Li-rich electrodes was due to the
Dr. Z. Lin, Dr. P.-L. Taberna, Prof. P. Simon Cl RIMAT -CNRS UMR 5085
Université Paul Sabatier
118 route de Narbonne, 31062 Toulouse, France Dr. E. Salager
CEMHTI-CNRS UPR3079 Université d'Orléans
l D avenue de la recherche scientifique 45071 Orléans, France
Prof. A. M. Abakumov
(enter for Electrochemical Energy Storage Skolkovo lnstitute of Science and Technology Nobel str. 3, 143026 Moscow, Russia
capturing of small cations in tetrahedral sites.14l Very recently, we expanded this family of model compounds by reporting on a new member Li3IrO4, which enables to push the limit of insertion reactions to a new record of 3.5 c per transition metal. Aside the field of batteries, it is worth mentioning that bath Ru/Ir-based oxides have been heavily studied by electro chemists. First, as highly performant water splitting catalysts, showing a low overpotential and high activity for the oxygen evolution reaction (OER).15•6l Following the first studies on the
formation of an oxide layer at the surface of metallic Ru/ Ir elec trodes,[7,8l it was proposed that the reversible redox processes happening in this oxide layer could be used to store energy,[9,lOJ leading to the development of pseudocapacitors, with IrO2 or RuO2.xH2O being among the stellar materials with capaci tances exceeding 800 F g-1,l11l Most of the developments in these fields were done using amorphous, hydrated[12l or high surface area iridium oxides (nanoparticles[13l or nanosheets[14l) in order to maximize the shell contribution while often over looking the bulk contribution to energy storage.
In light of the versatility offered by these Ru(lr)-based com pounds to undergo redox chemical reactions in bath aqueous or organic solvents, it is becoming tempting to further extend the rich crystal chemistry of the Li-based iridate phases to proton-based phases and exploit their electrochemistry. Herein we demonstrate, by focusing on Li3IrO4, the feasibility to pre pare a new protonated H3+xlrO4 phase by room temperature ion exchange of Li for protons in aqueous media. This proto nated phase is shown to present a spectacular reversible electro chemical activity in bath nonaqueous media versus metallic Li and in aqueous media versus activated carbon.
2. Results
Single phase Li3IrO4 powder was prepared by a previously described ceramic process, which consists in heating a stoichio metric mixture of Ir and Li2CO3 in air at 950 °C for 24 h.115l The resulting powder was stirred in a 0.1 M H2SO4 solution and, after 1 h of stirring, the powder was recovered by centrifugation and washed with distilled water prior to its characterization. Com parative scanning electron microscopy (SEM) pictures of the pristine and recovered powders (Figure 1, inset) indicate the break-up of the initial 10--20 µm aggregates but no impact of the acid treatrnent on the 1-2 µm size primary particles. The powder composition was indirectly obtained via analysis of the reaction supernatant by complementary inductively coupled plasma mass spectrometry (ICP-MS) for the amount of released lithium, and by acid-base titration to determine the amount of remaining protons in solution. By cross-cutting the results of bath meas urements we could deduce the composition H3_5Li0_05IrO4 for the recovered sample within the accuracy of the analysis. The completion of the exchange reaction was confirmed by the absence of 7Li signal in the solid-state nuclear magnetic reso nance (NMR) spectrum (Figure Sla, Supporting Information), indicative of the absence of Li in the exchanged sample.
The X-ray powder diffraction pattern of the Li-free sample shows sharp Bragg peaks characteristic of a well crystallized material (Figure lb). All the peaks could be indexed in a hex agonal R3m unit cell, as for the parent phase, with however a
main difference in the stacking sequence which is P3 for the H3+x1rO4 phase as opposed to 03 for the precursor Li3IrO4 phase (Figure lc,d). The a lattice parameter slightly increases from 2.96 A for Li3IrO4 to 3.04 A for H3+xlrO4, while the c parameter shows a greater decrease from 14.40 to 14.07 A as expected since H+ is smaller than u+
. Within the O3-Li3IrO4 structure, or Li(Li112Ir112)O2, u+ sits in octahedral sites with 1/3 being located in the metal layers and the remaining 2/3 between the layers, but no precise dues can be obtained from the X-ray powder diffraction (XRD) powder pattern regarding the proton positions. To obtain information on the sites accu pied by protons, deuterated D3+xlrO4 samples were prepared for NMR studies. 2H NMR measurements detect a single peak near 15 ppm with a width at half height of 200 ppm (Figure Sl, Supporting Information), but this 2H peak is broad and without spinning sidebands compared to previous work by Paik et al. on deuterated Li2MnO3_[16l The 2H environments are probably
disordered with various distances and geometries relative to the paramagnetic Ir5+ centers, resulting in a distribution of Fermi contact shift. If some 2H atoms are close to Ir4+ centers, they
are probably not detected due to the strong paramagnetic inter action with Ir4+.
The thermal stability of the H 3+xirO4 phase was investigated by combined thermogravimetric analysis (TGA) and MS meas urements by heating a sample under Ar to 1000 °C at a rate of 5 K min-1 while analyzing the released gases. The TGA profile for H3+xirO4 (Figure 2a) shows a staircase behavior with three consecutive steps at 190, 700, and 900 °C, corresponding to the departure of H2O for the first step and of 02 for the two remaining ones (Figure 2b), with the products obtained at 500 and 1000 °C being IrO2 and Ir, respectively, as deduced from XRD of the recovered powders (Figure 2c). From the weight loss, and knowing the final products, we could deduce that the formula of the sample is H3.41rO4• The H
+
content exceeding three cannot be explained by a simple ion exchange reaction which does not involve a redox process. Due to the high redox potential of the H3IrO4 phase, as we will see later, the material oxidizes water hence leading to a reduced H3+xlrO4 phase with x being slightly pH dependent. To further characterize the pro tons within the sample and their existence as either OH groups or H2O, infrared (IR) spectroscopy measurements were done. Note the presence of bands associated to Li carbonate impu rities in Li3IrO4 that disappear after acid-leaching (Figure S2, Supporting Information), but to our surprise no bands appear around 1600 and 3600 cm-1; wavelength domains over which the OH groups are IR-active. The absence of such bands could simply be nested in the metallic character of H3.4lrO4 which prevents, for absorption reasons, the detection of OH group, as previously put forward to explain the inability to detect the OH bands in the metallic Li1_xHxMO2 phase.117l Having established the structural/physical properties of H3_4IrO4, we next probe its electrochemical activity versus u+ /Li in nonaqueous media and versus capacitive carbon in aqueous electrolyte.
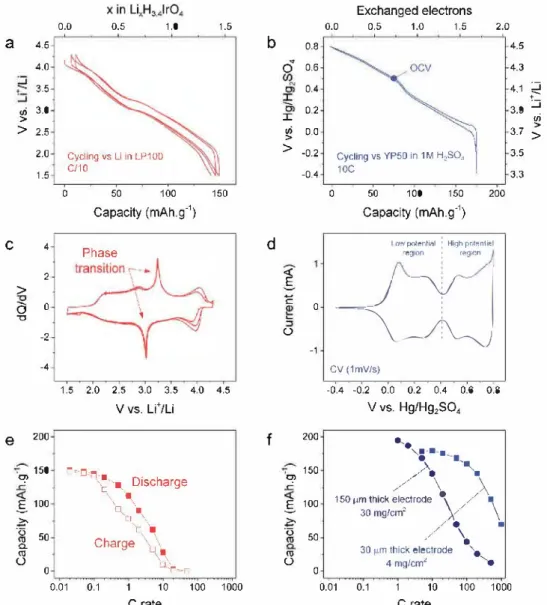
The electrochemical performances of H3.4IrO4 were meas ured in organic electrolyte versus Li in Swagelok cells between 1.5 and 4.2 V at a C/10 rate. Remarkably, the cell can reversibly uptake 1.5 u+ with limited polarization (Figure 3a) and shows the feasibility to deliver 75% of its energy density at a rate of 1 C (Figure Je). Moreover, the voltage profile varies smoothly
b
20 30 40 50 60 70 8() 20 30 40 50 60 ïO
20 (Cu, Ka) 20 (Cu. Ka)
Li Ir/Li 0
C d Possible proton pc�ition
03 stacking P3 stacking A / a= 2.96 A a= 304À c = 14.40 À c= 14.07 A C C -B B
-1 '"
B -AA-Figure 1. Refinement ofX-ray diffraction data and SEM picture of a) the parent Li31r04 and b) acid-leached H3+xlr04 phases, with c,d) the corresponding structural models.
with the removal/uptake of Li but also shows a narrow plateau at nearly 3.2 V, which can nicely be visualized on the derivative curve dQ/dY (Figure 3c) and is indicative of a phase transition.
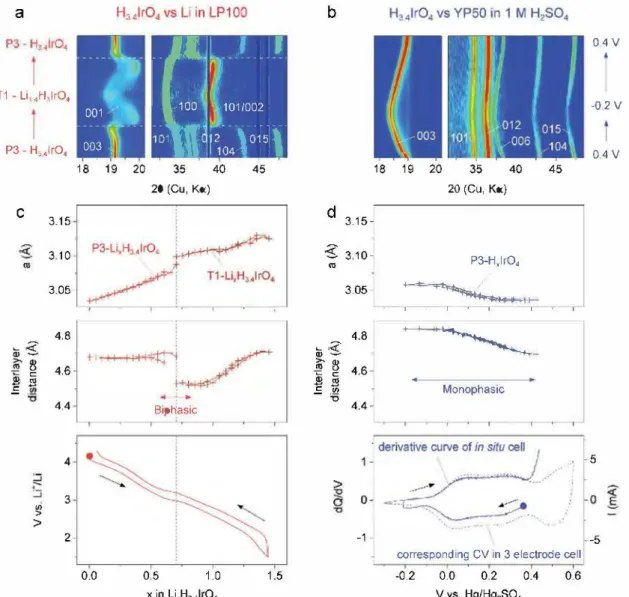
To better understand Li-driven structural changes in (Li,Hh,4lrO4, in situ XRD measurements were conducted (Figure 4) and XRD patterns were collected with 0.05 step in the lithium stoichiometry. The collected patterns are shown as 2D contour plots in Figure 4a. As an Li/LixH3.41rO4 cell is dis charged, we observed initially a slight shift of position and then a drastic change in the intensity of the peaks near x = 0.6, with some peaks disappearing at the expense of new ones, which sharpen beyond x = 0.7 to give a well-defined XRD powder pattern that remained till the end of the insertion process at
x = 1.5 (Li1.5H3_4IrO4). Refined XRD patterns demonstrate a Li-driven structural transition, which is accompanied by a change in the stacking sequence from P3 to Tl, with the cor responding variation of lattice parameters shown in Figure 4c. There is nearly a continuous increase of the lattice parameter upon reduction, which is consistent with the increase in the Ir ionic radii associated to its sequential Ir5+ ➔ Ir4+ ➔ Ir3+ reduction. By contrast, the interlayer distance (d) remains nearly constant till the P3-Tl transition where it severely drops from 4.68 to 4.52 A due to the migration of the u+ ions from prismatic to tetrahedral sites. Further lithiation up to x = 1.5 compensates this contraction with an increase of the interlayer distance d back to 4.71
A.
Such a Li-driven prismatic-tetrahedrala
100-
�
b
,,..., m/z = 18 IH,O'] _.,.,.✓ ---...,_·-�---�--... C 95l
"' 90"'
"'
85 � 80 75 - - - Li)r04 -- H3,,lr0., 0 200 400 <1%Iass�
,;\
L. 600 800 1000 Temperature ('C)?
10-10 9 :::;;: 0 10·" 0 r mlz = 17 [O!!'�ji• _.... �-,��.-.;,-,,- 1 -ml� ... ...,,,,,��l'/,W'�.
t""
I
.-. . ,Wt •n,�_ .... , ... ...,..,,"T'J. ,' '!11z - 1610"' 200 400 600 BOO 1000 Temperature ('C) 1 H3.,lr0, !J u...,,._J�__
p
}
\_
-:,
__ P�
1 1 I Ir 10 20 :io 40 50 60 70 80 2îl {°, Cu Kc;,) RTi
500"Ci
1000'CFigure 2. a) TGA analysis under Ar of the acid-leached sample shows three consecutive weight lasses, whereas the parent Li31r04 is stable up to 1000 °C. b) Mass spectrometry reveals that the first loss up to 500 °C is due to water, followed by lasses of02 at 700 and 900 °C. c) X-ray powder dif fraction of the samples taken at 500 and 1000 °C shows diffraction patterns oflr02 and metallic Ir, respectively.
a
Ce
4.5 4.0 3.5 ui 3.0 >>
2.5 2.0 1.5 4 2>
â
0 "'Cl -2 -4 200 ' C!> 150-S
100 �ïiï
a.
50 <1lu
0 0.0 0.5 Cycling vs Li in LP100 C/10 1,0 0 50 100 1.5 150 Capacity (mAh.g-1) Phase 1,5 2.0 2.5 3,0 3,5 4.0 4,5 V VS, Lt/Li--
□
,ri-■ \: ··■. Discharge \ ■\
°'-Cl\
\ 't-'■ Charge\�\ \■\ '--1ir~r 0,01 0,1 1 10 C rate 100 1000b
0,8 ., 0 0.6 0,4 0.2 I ui > 0.0>
-0,2 -04d
� ë 0u
_,
f
200 150 �-S
100 � <3 50 <1lu
0 Exchanged electrons 0.0 0,5 1.0 1,5 2.0� .. ,.,, '° ••
=
·
l
,oc 0 50 100 150 200 Capacity (rnAh.g-1) 1 CNI pol'F.-nti�I ; High pr,,fP.n1iF..l--e�1on : reg-on
�)
CV (1mV/s) -0.4 -0.2 0,0 0.2 0.4 0.6 V vs. Hg/Hg2SO4.
,
.
,:-•-■-.,,,,>,
•,
..__
■ 0,8 ,/\
�,,., ... ';"""'Y
30 mg/cm·.
\ • ■\
30 µm thick electrode'
•
...
.
4 mg/cm' 4.5 4.3 4.1 3.9 3.7 3.5 3.3 0.01 0.1 1 10 100 1000 C rate � ..:::i ui >>
Figure 3. Electrochemical properties of H341 rO4 in Li half cells (left) and in acidic electrolyte versus capacitive carbon (right). Up to 1.5 u+ can be revers ibly inserted in the structure between a) 1.5 and 4.2 V versus u+/Li, c) with a phase transition around 3.2 V and e) fair rate capability. A larger capacity can be achieved in aqueous electrolyte, b) with up to 1.7 e- exchanged d) through two well-defined redox regions between -0. l /0.4 and 0.4/0.8 V versus Hg/Hg2SO4• f) This process shows excellent rate capability even when thick electrodes and large loadings are used.
transition, which is fully reversed upon the removal of one u+ from the Tl phase, is indicative of a reversible Li insertion deinsertion process. This is fully confirmed by the remark able similarity between the XRD patterns of the pristine and discharged/charged electrode (Figure S3, Supporting Informa tion). Lastly, bath 7Li and 2H NMR signal evolutions were mon itored during the Li-insertion into D3.4IrO4• Surprisingly, the 2H signal disappears for Li1.sD3.41rO4, but can be explained by the strong interaction with the Ir4+ unpaired electrons. Similarly, this should cause the disappearance of the 7Li NMR signal. This is not the case since Li1.5D3.4IrO4 shows an intense peak near 0 ppm (Figure Sl, Supporting Information), quite more intense than in the pristine material, which is characteristic of a diamagnetic material (i.e., without Ir). Altogether, these two observations indirectly suggest that upon reduction of D3.41rO4, there is in parallel to the insertion process the growth of a lithi ated amorphous phase containing little Ir and no deuterium.
One reasonable explanation for this signal is the deposition of nondeuterated electrolyte decomposition products at the sur face of the positive electrode.
In a separate experiment, we tested the electrochemical behavior of H 3.4IrO4 in aqueous media using three-electrode PFA Swagelok cells with glassy carbon plungers as current collectors. The same polytetrafluoroethylene (PTFE) laminated electrodes, as described before, were used and assembled against negative electrodes containing capacitive carbon (YPS0) in excess with an Hg/Hg2SO4 reference electrode, all of which was immersed in 1 M H2SO4 water solution. The electrodes were cycled either in galvanostatic mode or by cyclic voltammetry.
Figure 3b shows the variation of the potential as a fonction of x. Upon reduction (discharge) from the open circuit voltage (OCV) (0.5 V vs Hg/Hg2SO4) to -0.2 V, the material can uptake one H+ (H
4.4lrO4) while, on the following oxidation (charge) up to 0.8 V, 1.7 H+ are removed ("H2.7lrO/). 2H NMR performed
a
T1 -Li, 4H,I rO,.
---
-
-- --
,•
.
,
. '
L
!
1
'
001 -100, , 1011002 : 003 --- ��.;l�
�
�
l
;
1-5!
l
P3 -H,,lrO, 18 19 20 35 40 45 20 (Cu, Ka.) C 3.15 310 3.05 4.8 �«è' Q) -2!'°
4.6]!
C: .El .!:: 4.4 Biptiasic 4 3 !{;>
2 0.0 0.5 1.0 1.5 x in Li,H3_41r04b
d
.g
"'
�,<? Q) -� 2! � C: _m 19 .!= -� "O 0.4V -0.2V 0.4V 18 19 20 35 40 45 20 (Cu, Ket.) 3.15-3 10- P3-H,lr0, 3.05 �� 'f<H=l-1 t---,----,--- 1-a,--
l 4.8 +-+--+ �-4.6 -Monophasic 4.4 -5 -1 - -5corresponding CV in 3 electrode cell
-0.2 0.0 0.2 0.4 0.6 V vs. Hg/Hg2SO,
Figure 4. ln situ XRD study in a,c) nonaqueous (left) and b,d) aqueous (right) electrolytes. Insertion of Li proceeds with a phase transition from P3 to Tl stacking a round x = 0.7 and large changes in a parameter (3.04-3.13 À) and interlayer distance (d = 4.5-4.7 À), whereas the process in aqueous electrolyte shows limited changes in cell parameters (a = 3.04-3.06 A, d = 4.7-4.8 À) that correspond to the low potential region (below 0.4 V vs Hg/Hg2S04). The high potential region cannot be reached at low current because of the concurrent water splitting reaction.
on the D4.4IrO4 sample reveals a deuterium signal in the dia magnetic range (0-20 ppm) that we ascribed to the growth of a solid-electrolyte interface (SEI) (Figure Slb, Supporting Infor mation), since as before no signal should be detected due to the paramagnetic influence of Ir4+. The span of the sidebands, however, suggests a close proximity with the paramagnetic phase or a less symmetric environment compared to D3.4IrO4•
Once the first cycle is achieved, the electrode can reversibly uptake 1.7 protons with minor polarization between oxidation and reduction curves, suggesting a rapid and reversible H+ release/uptake. Worth mentioning is that by starting the elec trode on oxidation we can nearly remove 0.7 H+ as well. As an indication, from simple charge counting, this implies that on reduction H3_4Ir0_65+Ir
0_/+O4 will transform to H4_4Ir0_/+Ir0}+O4 which will be oxidized to H2.7Ir0_l+Ir
0}+O4 upon full oxidation. CVs collected at 1 mV s-1 between -0.1 and 0.8 V versus Hg/Hg2SO4 (Figure 3d) show several redox peaks confirming
a large electrochemical activity which can be estimated to a reversible uptake of 1.7 protons as determined by galvano static cycling. Strikingly, the CV obtained after 5000 cycles at 20 mV ç1 neatly superimposes with the first one, indicative of an amazingly reversible redox process not too common at such level for battery materials (Figure S4, Supporting Informa tion). Finally, the rate capability of the material was measured from 1 to 1000 C. It reveals the high-power performances of the electrode, which can sustain a capacity of 130 mA h g-1 up to 100 mV ç1 ("'400 C) when the electrode thickness is decreased from 150 to 30 µm (Figure 3f). This value competes favorably with pseudocapacitive performances of transition metal car bides (also known as MXene), which can uphold "'92 mA h g-1 up to 100-200 mV ç1 for electrodes of comparable thickness and loading.1181 However, alike the MXene or other pseudoca pacitive materials, the rate capability ofH3.4IrO4 is, as expected, largely depending on the electrode design. An even more drastic
consequence of the electrode design was observed by testing Swagelok cells containing "'1 mg of active material powder with and without carbon additive. In the presence of carbon, both the low and the high potential processes appear, whereas in the absence of car bon we can solely trigger the capacity of the high potential domain (Figure SS, Supporting Information).
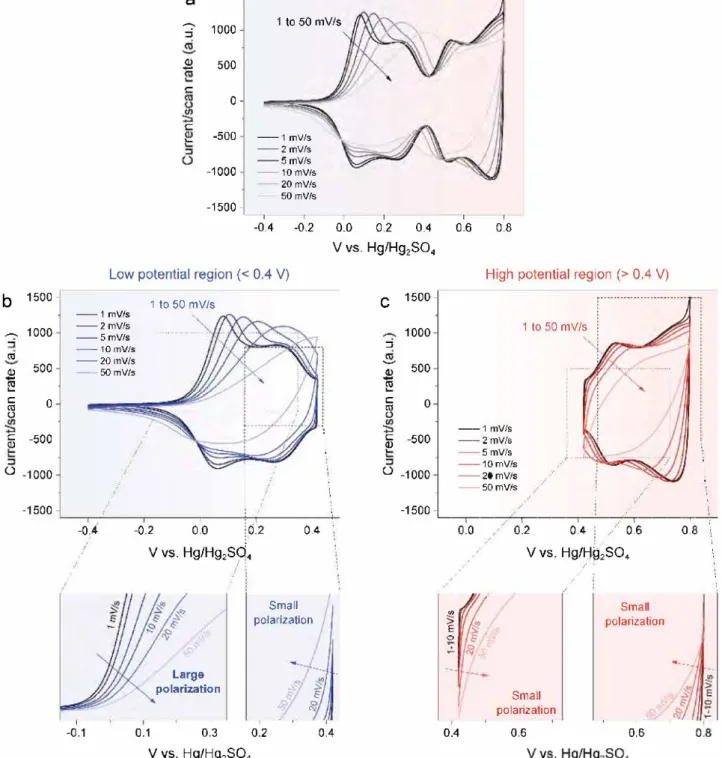
To understand the kinetic differences between the low and the high potential processes, Swagelok cells using thin films as positive electrodes were further assembled. Cyclic voltammo grams were collected up to scan rates of 50 mV ç1 at first over
the full potential range (Figure Sa) and then independently over the low and the high potential range (Figure Sb,c). Both the low and the high potential regions show kinetic limitations as can be seen from the increasing polarization of anodic and cathodic processes (peaks moving to the right or the left in oxidation and reduction, respectively) whatever these potential ranges are swept independently or together. However, noticeable dif ferences can be observed by focusing on the slope of the oxida tion and the reduction curves at various rates (Figure 5, bottom) with namely greater rate polarization dependence for the lower potential domain compared to the high potential one. This observation, combined with the disappearance of the low poten tial domain without carbon, strongly suggests that the kinetic of the low potential process is under ohmic control. Interesting to note is the symmetry of the polarization for the high potential domain as opposed to an asymmetric one for the low potential domain, with the kinetic being more sluggish on oxidation than on reduction. This is indicative of a different ohmic limitation on charge and discharge, which is most likely linked to changes in the electrode conductivity, as will be discussed later.
To get rid of the ohmic limitations at high scan rates and better assess the kinetics of the material itself, we repeated the aforementioned experiments using a cavity microelectrode (CME), which presents several advantages compared to con ventional Swagelok set-ups. First, neat active material powders can be used free from any binder. Besides, the feasibility to use only a few micrograms of active material helps to achieve high cycling rates since ohmic drop is negligible for the low current flowing in the electrode. As shown in Figure S6 (Supporting Information), ohmic limitation are effectively negligible from 1 to 200 mV ç1 for all processes, except for the anodic process of the low potential region, whose kinetic seems limited by the (poor) electrical percolation inside the active material.
To fully sort out the origin of the kinetic limitation in the low potential domain, we decided to run step potentio static intermittent transient technique (PITT) potentiostatic experimentsi19l using conventional Swagelok cells in the -0.4 to +0.8 V versus Hg/Hg2SO4 range. During each potentiostatic step, the current was recorded versus time and then integrated to calculate the electrode capacity at different equivalent poten tial scan rates (see the Experimental Section). As a result, we could recalculate and replot cyclic voltammetry curves at dif ferent potential scan rate. Those CVs calculated from potentio static experiments (Figure 6) differ from real CV experiments shown in Figure 5 in the way that ohmic contribution is mini mized using a potentiostatic technique. We considered the cur rent at each potential from the recalculated CVs as the sum of a nondiffusion-limited (surface) and a diffusion-limited (bulk) processesl20--22l
(1)
where the nondiffusion-limited redox contribution is defined by the k1 coefficient, associated with electrochemical processes occurring onto accessible surface sites, and the k2 coefficient
represents bulk diffusion-limited redox processes. Finding the values of k1 and k2 at each potential allows for the separation
of the nondiffusion and diffusion currents (orange and blue in Figure 6, respectively). The area under the CV is the sum of the blue and orange areas. First, the CV envelop is consistent with the experimental CVs plotted in Figure 5 under conventional dynamic conditions, validating the experiments. Furthermore, Figure 6 shows that the electrochemical kinetics of the low and the high potential processes are equivalent since the ratio of their respective area are roughly similar at each scan rates, for both the diffusion limited and the nondiffusion limited contri butions. These results unambiguously support the existence of an ohmic limitation in the low potential domain in Figure 6 rather than an electrochemical kinetic limitation.
At this stage a legitimate question regards the mechanistic of such low and high potential processes which, in light of the aforementioned results, are most likely not capacitive. To grasp further insights into this issue, in situ XRD measurements were done using a similar cell as before with the exception that the Be window, which cannot chemically resist acidic electro lyte, was replaced by a Kapton film, hence we reconfigured the positive electrode compartment (see the Experimental Section). We follow a similar experimental protocol as before (XRD pat tern taken for every step in �x of 0.05). The 2D contour plot representation of the collected data (Figure 3b) shows a smooth and continuous displacement of the Bragg peaks toward lower angles upon reduction to -0.2 V, indicative of a proton-driven solid solution insertion process. This process is perfectly revers ible as the Bragg peaks move back toward their initial position by switching the current. Refinement of the collected patterns indicates that the P3 stacking is preserved through the process, with however a decrease in both a and c lattice parameters when the potential is increased to 0.4 V and a flattening toward the end. Altogether, these results prove that the electrochemical activity at low potential is simply due to a classical insertion deinsertion reaction.
The upper potential domain turns out to be more difficult to explore as we could not reach oxidation potentials greater than 0.5 V with our cell hardware because of copious water decom position. To circumvent these difficulties, we returned to ex situ measurements where an electrode was polarized to 0.8 V in Teflon Swagelok cells, the glassy carbon current collector was recovered with the working electrode and directly measured by XRD without further processing (Figure S7, Supporting Infor mation). No change in lattice parameters was detected, sug gesting that the high potential storage process does not imply structural changes. To comfort the robustness of such a daim and ensure absence of experimental artefacts, the potential of the sample was measured again in an electrochemical cell after XRD and nearly the same potential was measured at OCV. Lastly, and for sake of completion, it is worth mentioning that identical results were obtained using HCl rather than H2SO4 as electrolyte.
a
1500 ... 1000 :::i 1 to 50 mV/s Q.) 500 0 -500 --1 mV/s --2mV/s --5mV/s -1000 --10mV/s --20mV/s 50 mV/s -1500 --, 1 --, -, -0.4 -0.2 0.0 0.2 0.4 0.6 0.8 V VS. Hg/Hg2SO4b
,--. Cil <l) 15...
C Cil u 1500 -1000 500 0fü
-500 ü -1000 -1500Low potential reg ion ( < 0.4 V)
1 to 50 mVls --1 mV/s --2mV/s --5mV/s --10 mV/s --20mV/s --50mV/s -0.4 -0.2 00 !0.2 0.4 V vs. Hg/Hg2
S9
4 Small polarization Large .s-"' polarization 1 -0.1 0.1 0.3 0.2 0.4 V vs. Hg/Hg2SO4 C ::i ,_,, !! !:!! C Cil u 1500 -1000 500 0m
-500 ü -1000 -1500 -High potential region (> 0.4 V) 1 to 50 mV/s --1 mV/s --2mV/s --5mV/s --10mV/s --20mV/s --50mV/s �----... ---�'--,---,--.,,
>
E 0 0.0 0.4 0.2 0.4 0.6 .. V vs. Hg/H�2S04 small polarization 0.6 Small polarization 0.6 0.8 •---.,Figure S. Kinetic analysis of the electrochemical processes in three-electrode Swagelok cells. a) CVs measured on the full potential range are compared to b) the low and c) the high potential regions. The beginning of cathodic and anodic processes for both regions is highlighted and show little polariza tion, except for the anodic process in the low potential region (left) which starts to polarize even at low scan rates.
3. Discussion
We have reported a new chemical aspect of the Li-based iridates that is their great aptitude to form protonic phases as dem onstrated with the formation of H3.41r04• Such a new phase demonstrates an exciting, but not yet fully understood, elec trochemistry with namely an electrochemical activity of 1.5 c
per Ir metal in both aqueous and nonaqueous media with fast kinetics.
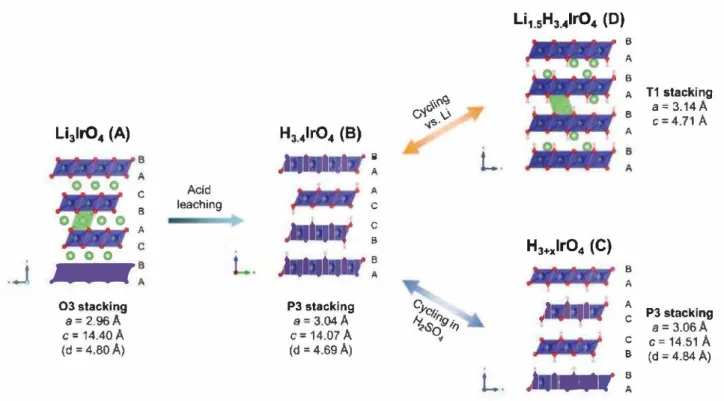
From the structural point of view, this work off ers very rich crystal chemistry, summarized in Figure 7, as we start with 03 stacking in the parent Li3Ir04 phase, that changes to P3 stacking in H3.4lr04 by acid leaching and eventually transforms to a Tl staking or maintain the P3 stacking upon additional
0.4 ë 0.0 -0.4 2
<
1·.s
ë 0 -1 -- CV from PITT � Diffusion contribution -0.4 -0.2 0.0 0.2 0.4 0.6 0.8 5 mv.s·1 -0.4 -0.2 0.0 0.2 0.4 0.6 0.8 V VS. Hg/Hg2S04 ê: ë --CV from PITT � Non-diffusion contribution 0.4 1mv.s·
1 0.0 -0.4 -0.4 -0.2 0.0 0.2 0.4 0.6 0.8 25 mv.s·
1 0 -1 k1 v -2 -0.4 -0.2 0.0 0.2 0.4 0.6 0.8 Vvs. Hg/Hg2S0,Figure 6. Calculated CVs from PITT experiments. The contributions of the diffusion limited and nondiffusion limited electrochemical reaction kinetics are shown in blue and orange colors, respectively, for PITT measurements collected at l mV ç1 (top) and 5 mV ç1 (bottom). These contributions were calculated from the deconvolution of the total current (see text).
Li
3lr0
4(A)
H
3
_
4
l
r04 (B)
1
1
1
1
1
1
1
F B•
A 0 0 C Acid A 8 leaching C A•
1
1
t
1
1
:
•
C B 0 0 01
1
1
1
t
1
1
1
F B.
.J
....
J A O3stacking P3 stacking a=2.96A a= 3.04A c=
14.40 A c: 14.07 A (d=
4.80A) (d "'4.69 A) c,\\�Çi C,'i \) --4<;,·L
.
C;,Ct,· ly_ �"' '<.So'911J�
L.
Li
1.5H
3_41r0
4(D)
H
3+xlrO
4(C)
•
1
t
'
1
1 , ••
�
•
1
'
B A B A T1 stacking 8 a= 3.14 A c;:;4.71 A A B A A C P3 stacking a= 3.06A C c= 14.51 A B (d = 4.84 A) B AFigure 7. Overall structural mechanism. Acid leaching of the parent Li31r04 phase (A) modifies the stacking from 03 to P3 for H3.4lr04 (B). Cycling in aqueous media does not modify the stacking (C) whereas insertion of Li in organic electrolyte changes the stacking to Tl (D).
a
b
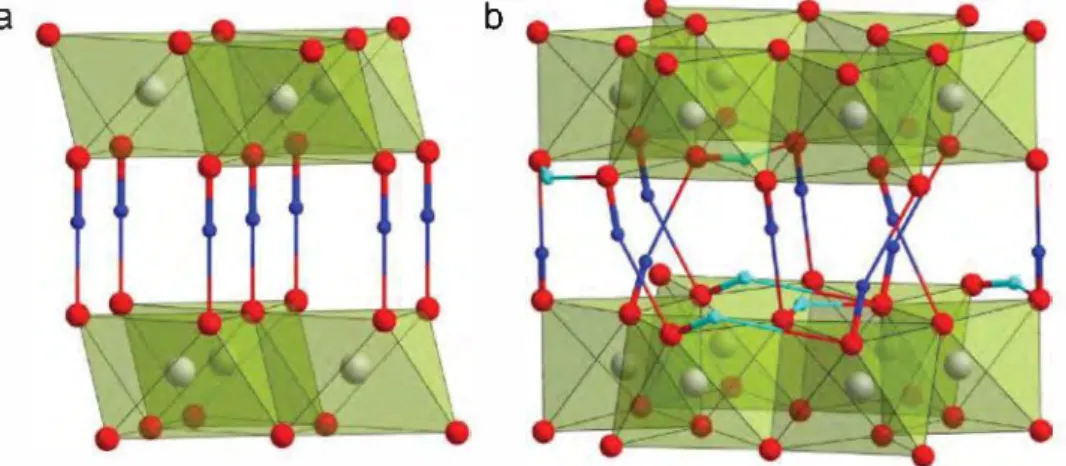
Figure 8. Proton positions in a) layered CrOOH and b) Al(OH)J bayerite structures. ln the CrOOH structure, protons form a strong covalent bond with oxygen atoms from one (Cr02) octahedral layer and a weaker hydrogen bond with the facing oxygen in the adjacent layer. Al(OH)J shows a honeycomb ordering of the AI06 octahedra and vacant oxygen octahedra that creates free space to accommodate protons almost in the oxygen close packed planes. The metal cations and oxygens are shown as gray and red spheres, respectively. The "out-of-plane" and "in-plane" proton positions are colored with dark blue and cyan, respectively. Thick and thin bonds denote short covalent 0-H bonds and long hydrogen bonds, respectively.
insertion of Li+ or H+, respectively. Therefore, getting insights into the local positioning of the different guest ions, namely H+, is quite complex, owing to their transparency to XRD, as well as to the large incoherent neutron scattering of H+, which can be overcome by using deuterated samples. In absence of such measurements, a valuable alternative consists in looking for possible proton location among the known structures of layered hydroxides such as CrOOH, which adopts a P3 struc ture (Figure Sa). Typically, protons form strong covalent bond to one oxygen atom, with a typical length of se0.85-1.0 A, and one weaker "hydrogen'' bond to another oxygen atom, which has more electrostatic nature and a length that can vary between 1.5-2.5 A. In CrOOH, protons occupy "out-of-plane" position between two successive (CrO2) octahedral layers being doser to one O atom (d(O-H) = 1.05 À) and more distant from the 0 atom from the neighboring layer (d(O-H) = 1.53 A)J23l Thus a linear 0-H-O fragment is formed.
Tuming to the protons within the metal layers, their position at the Li octahedral sites is quite unlikely. A more likely location could be deduced from the known hydroxide Al(OHh, which surprisingly has a very similar structure to Li-rich layered oxides with honeycomb orderingJ24l In this structure, the hon eycomb ordering of the Al-filled and vacant oxygen octahedra within the (AlO3) layers provides extra "in-plane" proton posi tions, sitting almost within the oxygen close packed layers, with one short 0-H bond of O. 94-1.0 A and another longer one of 2.11-2.43 A to the oxygen atoms of the same layer (Figure 8b). Together, the "out-of-plane" and "in-plane" proton positions can account for the hydrogen atoms in H3.4IrO4.
Now moving to the inserted compound, we should recall that the insertion of Li in Li3IrO4 has led to a phase change through which the Li-ions move from octahedral to tetrahedral sites. Along that line it does not corne as a surprise that the insertion of 1.5 Li+ in H3.4IrO4 triggers a P3 to Tl structural transition with the extra Li+ occupying the tetrahedral sites. As we suspect that 7Li and 2H NMR signals from the materiafs bulk are not visible due to the vicinity of paramagnetic Ir4+ cations, neutron
diffraction on deuterated samples is being planned to support most of our hypothesis relying on well-known compounds.
From a materiafs prospective we should recall that the iridate family is rich and still largely unexplored, hence the numerous opportunities presented by this simple room temperature one step acid leaching technique. For proof concept generalization, we have already prepared several other members, among which are the a and ,6-Li2IrO3 phases with either Li or Na, and we could equally confirm the feasibility to obtain the corresponding protonic phases with a reaction kinetics slightly depending upon the pristine material structure. For broader generaliza tion, we could also demonstrate that the ruthenates share sim ilar chemistry versus the leaching technique approaches which, however, compete in some cases with decomposition reactions. So, a multitude of new protonic phases remain to be discovered and studied for their electrochemical properties.
Tuming to the fondamental (de)insertion mechanisms of these protonic phases, they fall in line with the classical cati onic insertion mechanism involving the reversible Ir5+ ➔ Ir3+ redox for the storage capacity of Li/H3.4IrO4 cells. Charging the material above 4.2 V versus Li+ /Li results in limited capacity retention indicative of some electrolyte degradation at high potential. Thus, the need to develop a proper electrolyte formu lation that resists to hydrolysis to properly evaluate the depro tonation of the material and its long-term cycling stability. In aqueous media there is, besides a low potential process govemed by cationic insertion, a high potential process associated to a reversible uptake/release of 0.7 e- for which, based on charge counting, one could invoke some anionic redox process: "H2_7 Ir5+o3.4(O2)3-0_3." This is quite unlikely as anionic redox affects the structure and usually leads to sluggish kinetic as compared to cationic redox; which is not what we found. Moreover, the participation of lattice oxygen can lead, as discussed by Gri maud et al. to an OER activityl25•261 which could jeopardize the
stability of our electrode, but this is not the case either. Thus, we are left with a small amount of Ir6+, which is not frequent, or, more likely, we underestimated the amount of H+ in the
material owing to the experimental uncertainty. The kinetic of each process is dictated by the slowest contribution to the electrochemical reaction and we have shown from PITT meas urements that the two processes observed at low and high potential have similar electrochemical kinetics (charge transfer and diffusion). They only differ by the existence of a greater ohmic polarization for the low potential domain process which cannot be triggered in absence of carbon additive. Its origin is most likely linked to the increasing amount of Ir3+ during the reduction of the HxirO4 phase, bearing in mind that Ir3+ adopts a d6 configuration so that all the t
2g levels are filled, thus lim iting the conductivity of the material. It is the same explanation given by Conway in the 1980s to explain why there is no cur rent in IrO2 below 0.8 V versus SHE (0.15 V vs Hg/Hg2SO4))81 Otherwise, besides such a difference, the capacity of each pro cess was shown to be the cumulative contribution of a diffusion limited (bulk) and a nondiffusion limited (surface, or more gen erally highly accessible sites) components, bath being related to charge transfer (faradaic) reactions. The surface charge contri bution was found greater than the diffusion contribution, while the diffusion versus nondiffusion charge ratio was similar for bath low and high potential domains. We believe that the pro nounced surface charge transfer contribution is nested in a spe cific modification of the Li3IrO4 particles morphology during the acid leaching treatment. Nevertheless, a question still remains regarding the absence of structural changes detectable by XRD for the high potential process. We thus could envision, in light of previous studies on V2O5 powders showing extra capacities not associated to structural changes, the emergence of a core-shell like process within a single particle, during the uptake-removal of proton, with the shell operating via a pseu docapacitive behavior enabling changes in the Ir oxidation state without affecting the structure. Obviously, further experiments, namely, operando X-ray absorption spectroscopy at Ir-Lm edge to track changes in the Ir oxidation states, have to be done to test our hypothesis and fully elucidate the high potential mech anism observed for the aqueous H+/H3+xlrO4 system.
In summary, we have successfully synthesized a new pro tonie iridate phase that shows large capacity storage (1.5 c per transition metal), while presenting attractive rate capabilities in aqueous systems. Such a storage process was shown to mainly rely on cationic redox reactions with the eventual connivance of a pseudocapacitive behavior to account for the total redox process in aqueous media. Besides the synthesis and fonda mental aspects, this work also bears importance application wise provided that we can implement our protonation strategy to other Li-rich phases, hence deviating from the use of poorly abundant and costly Ir. Lastly, this proton chemistry opens new opportunities within the field of energy bearing in mind that Ir based materials also present a great interest for water splitting applications.
4. Experimental Section
Materials Synthesis and Characterization: Li31r04 was prepared by
mixing stoichiometric amounts of metallic Ir and Li2C03 and heating at 950 °C for 24 h in air. The prepared sample was then acid-leached in 0.1 M H2S04 during l h with a fivefold excess of H+ over exchangeable
u+ in the material. The powder and the supernatant were separated by
centrifugation and the sample washed three times with distilled water prior to being dried overnight at 55 °C under vacuum. D2S04 solution
and D20 were alternatively used to prepare deuterated samples. The u+ and H+ contents in the supernatant after reaction were measured by ICP-MS and acid-base titration, respectively. TGA-MS was done under high purity Ar gas (5.0) with 15-20 mg of samples, using a heating ramp of 5 K min-1 from room temperature to 1000 °C. X-ray diffraction was
performed at each step to confirm the success of the synthesis using a BRUl<ER D8 Advance diffractometer with Cu l<a radiation (ÂKal = l.54056 A, ÂKa2 = l.54439 A). NMR experiments were performed on a Bruker 4.7 T Avance Ill spectrometer, using a 1.3 mm doube-resonance probehead. The spinning rate was 62.5 kHz except for the D4.41r04 sample that could not be spun above 59 kHz. 7Li NMR experiments were performed using a Hahn-echo with a repetition time chosen to ensure full relaxation, and referenced against an aqueous LiCI solution (l mol L-1) at a chemical shift of O ppm. 2H NMR experiments were performed using a quadrupolar echo and a repetition time ofO.l s, and referenced against liquid D20 at 4.8 ppm.
Electrochemical Characterization: For electrochemical characterization, self-standing PTFE electrodes were prepared. H3_41r04 was mixed with
l O wt% Csp and 5 wt% PTFE, and laminated several times to obtain films of different thickness (l 0-150 µm) and density of material (4-30 mg cm-2). Li half cells were prepared with the thicker films with typical loadings of l O mg. Metallic lithium was used as the anode material, LPl 00 (l M LiPF6
in ethylene carbonate/propylene carbonate/dimethylcarbonate with l :l :3 weight ratio) as the electrolyte and Wh atm an GF /D borosilicate glass fiber membrane as the separator. Swagelok or coin cells were assembled in an Ar-filled glovebox and cycled in galvanostatic mode between 1.5 and 4.2 V versus u+ /Li. Characterization in aqueous media (l M H2S04/ D2S04 in H20/D20) was done using three-electrode PFA Swagelok cells with two glassy carbon current collectors and Hg/Hg2S04 reference
electrode. 6.5 mm diameter electrodes (0.322 cm2) were punched from the laminated H3.4I r04/Csp/PTFE film for the working electrode, and
from PTFE electrodes of overcapacitive carbon (YP50) for the counter electrode. The proton release/uptake value was obtained from coulombic titration assuming the formula H3) r04 for the starting material and that only protons participate to the charge storage mechanism. The cavity microelectrode used here consists in a thin platinum wire (0 100 µm) sealed into a low melting glass; a laser beam was then focused on the Pt wire to dig a cavity of 80 µm in diameter and 70 µm in depth. The active mate rial was mixed with l O wt% Csp and dipped the CM E in the powder to fill the cavity. For the in situ XRD experiment, a Swagelok-derived electrochemical cell equipped from a Be window was used in organic electrolyte.1271 The same measurements were done in acidic media by replacing the Be window with a Kapton film and a flexible graphite film as current collector, the latter being punched with a hale slightly smaller than the working electrode size, in order to ensure a good electronic conductivity without masking the diffraction signal of the material. Prior and after the measurement with the in situ cell, the working and counter electrodes used in the experiment where measured in the three-electrode set up in order to establish the relationship between the cell voltage and the working electrode potential.
PITT Experiments and Kinetic Study: PITT experiments were done in PFA Swagelok cells using thin electrodes. During the experiment, the potential was increased by steps of 25 mV, and hold du ring 60 s. For each potentiostatic step, the current was recorded �ersus time. The current was integrated versus time according to Q = J 1 /dt to calculate the electrode capacity at different equivalent potential0 scan rates. For
instance, the integration of the current during the first 11t = 5 s for a potential step of 25 mV gives an equivalent scan rate of 5 mV ç1 and
the integration during the first 25 s gives an equivalent scan rate of l mV ç1. The mean current during each potential step was calculated
J'idt
according to / =
1
t.
As a result, for each potential step, the currentand replat cyclic voltammetry curves could be recalculated at different potential scan rates. CVs calculated from potentiostatic experiments minimize the ohmic drop contribution. To estimate the contribution of the diffusion limited and nondiffusion limited processes to the total
current, the current at each potential as the sum of the nondiffusion limited and diffusion limited processes was considered as follows: i(v)=k1v+k2
.Jv,
where the nondiffusion limited redox contribution is defined by the k1 coefficient, associated with electrochemical processes occurring onto accessible sites, and the k2 coefficient representingdiffusion limited (bulk) processes. Consequently, it becomes possible to determine the phenomenon governing the reaction kinetics by calculating the ratio kifk2 and to accurately observe the changes in the kinetic behavior of the material. Considering Equation (1) and plotting i/v112 versus v1i2, k1 was calculated as the slope of the plot, and k2 its y-intercept. Calculation of k1 and k2 at each potential allows for the
separation ofthe nondiffusion and diffusion currents.
Supporting Information
Supporting Information is available from the Wiley Online Library or from the author.
Acknowledgements
The authors thank M. Courty for TGA-MS measurements, D. Giaume for ICPMS measurements, C. Yang, A. Grimaud, and G. Rousse for useful discussions. J.-M.T. acknowledges funding from the European Research Council (ERC) (FP/2014)/ERC Grant-Project 670116-ARPEMA.
Conflict of I nterest
The authors declare no conflict of interest.
Keywords
batteries, layered oxides, protons, pseudocapacitors
[l] M. Sathiya, G. Rousse, K. Ramesha, C. P. Laisa, H. Vezin, M. T. Sougrati, M.-L. Doublet, D. Foix, D. Gonbeau, W. Walker, A. S. Prakash, M. Ben Hassine, L. Dupont, J.-M. Tarascon, Nat.
Mater. 2013, 12, 827.
[2] E. McCalla, A. M. Abakumov, M. Saubanère, D. Foix, E. J. Berg, G. Rousse, M.-L. Doublet, D. Gonbeau, P. Novak, G. V. Tendeloo,
R. Dominko, J.-M. Tarascon, Science 2015, 350, 1516.
[3] P. E. Pearce, A. J. Perez, G. Rousse, M. Saubanère, D. Batuk, D. Foix, E. McCalla, A. M. Abakumov, G. Van Tendeloo, M.-L. Doublet, J.-M. Tarascon, Nat. Mater. 2017, 76, 580.
[4] M. Sathiya, A. M. Abakumov, D. Foix, G. Rousse, K. Ramesha, M. Saubanère, M. L. Doublet, H. Vezin, C. P. Laisa, A. S. Prakash, D. Gonbeau, G. VanTendeloo, J.-M. Tarascon, Nat. Mater. 2015, 74,
230.
[5] D. N. Buckley, L. D. Burke,). Chem. Soc., Faraday Trans. 1 1976, 72,
2431.
[6] M. Carmo, D. L. Fritz, J. Mergel, D. Stolten, /nt.
J.
Hydrogen Energy2013, 38, 4901.
[7] J. Mozota, B. E. Conway, Electrochim. Acta 1983, 28, 1.
[8] B. E. Conway, J. Mozota, Electrochim. Acta 1983, 28, 9.
[9] B. E. Conway,J. Electrochem. Soc. 1991, 138, 1539.
[l O] S. Ardizzone, G. Fregonara, S. Trasatti, Electrochim. Acta 1990, 35,
263.
[11] J. P. Zheng, P. J. Cygan, T. R. Jow,
J.
Electrochem. Soc. 1995, 142,2699.
[12] R. L. Doyle, 1. J. Godwin, M. P. Brandon, M. E. G. Lyons, Phys.
Chem. Chem. Phys. 2013, 75, 13737.
[13] Y. Lee, J. Suntivich, K. J. May, E. E. Perry, Y. Shao-Horn, j. Phys. Chem. Lett. 2012, 3, 399.
[14] D. Takimoto, K. Fukuda, S. Miyasaka, T. lshida, Y. Ayato, D. Mochizuki, W. Shimizu, W. Sugimoto, Electrocatalysis 2017, 8, 144.
[15] A. J. Perez, Q. Jacquet, D. Batuk, A. ladecola, M. Saubanère, G. Rousse, D. Larcher, H. Vezin, M.-L. Doublet, J.-M. Tarascon, Nat.
Energy 2017, 2, 954.
[16] Y. Paik, C. P. Grey, C. S. Johnson, J.-S. Kim, M. M. Thackeray, Chem.
Mater. 2002, 74, 5109.
[17] S. Venkatraman, A. Manthiram,J. Solid State Chem. 2004, 177, 4244.
[18] M. R. Lukatskaya, S. Kota, Z. Lin, M.-Q. Zhao, N. Shpigel, M. D. Levi, J. Halim, P.-L. Taberna, M. W. Barsoum, P. Simon, Y. Gogotsi, Nat. Energy 2017, 2, 17105.
[19] M. F. Dupont, S. W. Donne, Electrochim. Acta 2015, 767, 268.
[20] J. Wang, J. Polleux, J. Lim, B. Dunn, j. Phys. Chem. C 2007, 111,
14925.
[21] V. Augustyn, P. Simon, B. Dunn, Energy Environ. Sei. 2014, 7, 1597.
[22] J. Come, P.-L. Taberna, S. Hamelet, C. Masquelier, P. Simon,
J.
Electrochem. Soc. 2011, 158, Al 090.[23] A. N. Christensen, P. Hansen, M. S. Lehmann,). Solid State Chem.
1977, 21, 325.
[24] F. Zigan, W. Joswig, N. Burger, Z. Kristallogr. 1978, 148, 255.
[25] A. Grimaud, W. T. Hong, Y. Shao-Horn, J.-M. Tarascon, Nat. Mater.
2016, 75,121.
[26] A. Grimaud, O. Diaz-Morales, B. Han, W. T. Hong, Y.-L. Lee, L. Giordano, K. A. Stoerzinger, M. T. M. Koper, Y. Shao-Horn, Nat.
Chem. 2017, 9, 457.
[27] J. B. Leriche, S. Hamelet, J. Shu, M. Morcrette, C. Masquelier, G. Ouvrard, M. Zerrouki, P. Soudan, S. Belin, E. Elkaïm, F. Baudelet,J. Electrochem. Soc. 2010, 757, A606.