an author's
https://oatao.univ-toulouse.fr/21691
https://doi.org/10.1016/j.isprsjprs.2018.09.016
Aval, Josselin and Jean, Demuynck and Zenou, Emmanuel and Sophie, Fabre and David, Sheeren and Mathieu,
Fauvel and Karine, Adeline and Xavier, Briottet Detection of individual trees in urban alignment from airborne data
and T contextual information: A marked point process approach. (2018) ISPRS Journal of Photogrammetry and
Remote Sensing, 146. 197-210. ISSN 0924-2716
Detection of individual trees in urban alignment from airborne data and
contextual information: A marked point process approach
Josselin Aval
a,⁎, Jean Demuynck
b, Emmanuel Zenou
b, Sophie Fabre
a, David Sheeren
c,
Mathieu Fauvel
c, Karine Adeline
a, Xavier Briottet
aaONERA-DOTA, University of Toulouse, Toulouse 31055, France bISAE-SUPAERO, University of Toulouse, Toulouse 31400, France
cDYNAFOR, INP-ENSAT, INP-EI Purpan, INRA, University of Toulouse, Auzeville 31320, France
Keywords: Street tree Urban remote sensing Airborne data
Geographic information system Individual tree crown delineation Marked point process
A B S T R A C T
With the current expansion of cities, urban trees have an important role for preserving the health of its in-habitants. With their evapotranspiration, they reduce the urban heat island phenomenon, by trapping CO2 emission, improve air quality. In particular, street trees or alignment trees, create shade on the road network, are structuring elements of the cities and decorate the roads. Street trees are also subject to specific conditions as they have little space for growth, are pruned and can be affected by the spread of diseases in single-species plantations. Thus, their detection, identification and monitoring are necessary. In this study, an approach is proposed for mapping these trees that are characteristic of the urban environment. Three areas of the city of Toulouse in the south of France are studied. Airborne hyperspectral data and a Digital Surface Model (DSM) for high vegetation detection are used. Then, contextual information is used to identify the street trees. Indeed, Geographic Information System (GIS) data are considered to detect the vegetation canopies close to the streets. Afterwards, individual street tree crown delineation is carried out by modeling the discriminative contextual features of individual street trees (hypotheses of small angle between the trees and similar heights) based on Marked Point Process (MPP). Compared to a baseline individual tree crown delineation method based on region growing, our method logically provides the best results with F-score values of 91%, 75% and 85% against 70%, 41% and 20% for the three studied areas respectively. Our approach mainly succeeds in identifying the street trees. In addition, the contribution of the angle, the height and the GIS data in the street tree mapping has been studied. The results encourage the use of the angle, the height and the GIS data together. However, with only the angle and the height, the results are similar to those obtained with the inclusion of the GIS data for thefirst and the second study cases with F-score values of 88%, 79% and 62% against 91%, 75% and 85% for the three study cases respectively. Finally, it is shown that the GIS data only is not sufficient.
1. Introduction
The world urban population will increase to nearly 5 billions by 2030, and at the same time the urban land cover will increase by 1.2 millions km2 (Seto et al., 2012). With this expansion of urban areas,
urban canopies have an important role to play as they improve air quality (Yang et al., 2005), reduce heat islands (Doick et al., 2014), promote biodiversity and have a relaxing psychic action (Chiesura, 2004). Urban tree structures including street trees and park ones do not have necessarily the same functions/roles in the urban context (Bolund
and Hunhammar, 1999). In addition to the properties mentioned above
(Vailshery et al., 2013; Gillner et al., 2015), the street trees create
shade, are structuring elements of the cities and decorate the roads (McPherson et al., 2016). They are also subject to specific conditions as
they have little space for growth and are pruned, most often to be adapted to the constraints of the sites, and can be affected by the spread of diseases in single species plantations (Sebestyen et al., 2008). As a case in point, a pruned lime tree (Tilia) has a life expectancy of 150 years against 800 years without constraint (Baraton, 2014; Fini et al., 2015). In order to highlight the crucial place of the street trees in the urban environment, the example of Paris, France can be cited with nearly 100,000 street trees (about half of the trees). These street trees cover around 700 km of roads and concern approximately 1600 roads out of 6000. Especially, the shadow produced by the street trees
⁎Corresponding author.
E-mail address: [email protected](J. Aval).
represents 3% of the area of Paris (Rol Tanguy et al., 2010). The managers of the urban environment have to consider the distinctive characteristics of the street trees for a specific urban planning and a specific monitoring, and a first step is the individual street tree iden tification. Nowadays, this type of procedure is carried out manually, by field campaign or by photointerpretation (Pulighe and Lupia, 2016), and does not allow to cover large scales of continuous urban area with regular time basis.
Remote sensing opens the way to automate the individual street tree mapping. Indeed, airborne remote sensing sensors can cover entire ci ties with a spatial resolution of an order of magnitude of 1 m and with regular time basis (Alonzo et al., 2014). Airborne multispectral and hyperspectral sensors measure the spectral radiance and thus allow the vegetation to be detected (Xiao et al., 2004). Active sensors as Light Detection And Ranging (LiDAR) or passive sensors in stereoscopic configurations can be used to measure the height and makes it possible to characterize the vertical structure of the objects (MacFaden et al., 2012). With the association of these remote sensing technologies, the urban canopy considered as high vegetation can then be mapped
(Ramdani, 2013). On the other hand, Geographic Information System
(GIS) data, especially vector data, constitute an important source of information and are often available at a city scale from the urban managers, but also more and more on a global scale from open data bases such as OpenStreetMap (OSM). In a perspective of street tree identification, such vector data are of interest because an information such as the road network is often available and would allow the ca nopies close to the streets to be detected (Wen et al., 2017).
From these remote sensing data, individual tree mapping, con ventionally termed Individual Tree Crown Delineation and Detection (ITCD), has been addressed for many years and several ITCD methods have been proposed (Zhen et al., 2016). Raster based methods such as valley following (Leckie et al., 2003), region growing (Adeline, 2014), watershed segmentation (Chen et al., 2006) and template matching
(Gomesa and Maillarda, 2014) have been developed. Point cloud based
and tree shape reconstruction approaches like K means clustering technique (Gupta et al., 2010) and Hough transform (Van Leeuwen
et al., 2010) have been explored respectively. Finally, there are
methods combining raster, point, and a priori information such as Markov randomfields (Ardila et al., 2011), Marked Point Process (MPP) approaches (Perrin et al., 2006) which can use a prior contextual in formation on the trees (Van Lieshout, 2000). Even if these methods have exhibited good performance in the literature, complicated urban and non urban forests are still challenging (mainly in case of important overlaps) (Zhen et al., 2016). Focusing on the urban environment, of the 207 studies identified in the recent review ofZhen et al. (2016)on the ITCD methods, only 18 have been applied in urban areas. The ob jective of these studies was to map the urban trees individually, and no distinction is made between the different structures of the trees in the urban context such as street trees and park trees.
However, these structures are of interest for the urban managers for a specific urban planning and a specific monitoring, with the example of the street trees highlighted previously. In addition, this information could be used in order to improve not only the individual tree mapping itself (by taking advantage of a prior contextual information knowledge about the urban trees depending on their structure), but also the tree species classification for example (by defining specific categories of urban trees depending on their structure because street trees have not necessarily the same spectral traits than park ones). To our knowledge, this consideration of the tree structures in the urban canopy mapping is the subject of only one study,Wen et al. (2017)where an approach for classifying the urban canopies (patch level classification) in three classes (park, roadside and residential institutional canopies) has been proposed. GIS data and specific spectral, textural, shape and contextual features (such as the proximity to the road) are considered in order to characterize these classes. Shenzhen and Wuhan (China) constitute the study sites and the method is based on WorldView 2 satellite imagery
(spatial resolution of 2 m for the multispectral mode). F score values of 76%, 89% and 87% are obtained for park, roadside and residential canopies respectively. In such a patch level framework, there are con fusions between the street trees and the other populations of trees be cause of the spatial connections between the canopies, which could be probably better handled with an individual detection approach.
Summarizing the existing literature, there is minimal consideration of the specific tree structures in the urban environment such as street trees and park trees. In particular, no individual tree mapping which takes into account the structure of the alignment trees has been pro posed. To alleviate this issue, the aim of this paper is to map the trees which belong to an alignment individually. Airborne data and con textual information are used in an approach based on MPP, which al lows a prior information to be modeled. For that purpose, the following issues are addressed:
1. What are the discriminative contextual features of the street trees? 2. How to model these features for individual street tree mapping? 3. Which features contribute the most in individual street tree map
ping?
The paper is organized as follows. Section2presents the study area and the data used for individual street tree mapping, followed by Sec tion3with the description of the proposed method and a baseline ITCD method used for comparison. Afterwards, the results are showed in Section4and discussed in Section5. Finally, main conclusions of the study are detailed and the perspectives of the work highlighted in Section6.
2. Materials 2.1. Study area
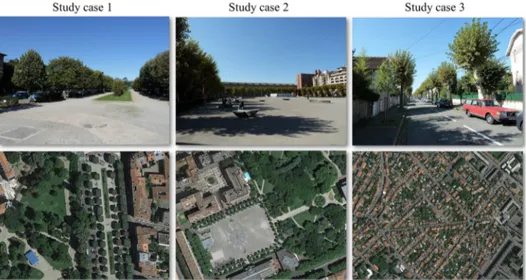
The study is carried out in Toulouse city located in the South West of France (43.6°N, 1.44°E). With about 500,000 inhabitants, Toulouse is the fourth city in France. The climate of Toulouse is temperate with oceanic, Mediterranean and continental characteristics. Concerning the urban vegetation, Toulouse would have approximately 140,000 trees with at least 20,000 street trees according to urban managers. Three areas in Toulouse downtown are selected in this study (Fig. 1).
The three study cases are presented inFig. 2. In all cases, the street trees form lines along roads and are pruned as it will be highlighted in Section3.1. This results in small angle between the street tree trunks and similar tree heights. Thefirst study site is located in the center of Toulouse and includes street and park trees. The street trees do not overlap and are silver linden trees (Tilia tomentosa). The second site is also located in the center of Toulouse and also includes street and park trees. However, this case is more challenging than thefirst one because the number of trees is higher and the street trees overlap more and are organized in two adjacent lines. In this case, the street trees are plane trees (Platanus × hispanica). The third site is situated in a quarter of private properties. For this site, the number of trees is high with a complex spatial organization because of the presence of many garden trees. The majority of the trees are not aligned, and spread over a great extent. The street trees do not overlap and are plane trees (Pla tanus × hispanica).
2.2. Airborne and GIS data
Airborne data were acquired on October 24, 2012 at 11:00 UT (Universal Time) during the UMBRA campaign (Adeline et al., 2013) organized by the French Aerospace Lab (ONERA) and the French Mapping Agency (IGN). Theflight height was approximately 2000 m over the study area. The HySpex Visible Near Infrared (VNIR) system
(Köhler, 2016) was used and consists of an hyperspectral push broom
resolution, the VNIR camera data are acquired with a spatial resolution of 0.4 m and 0.8 m across and along tracks, respectively. In order to build a DSM, the French Mapping Agency CAMv2 system was used
(Souchon et al., 2010) for performing stereoscopic acquisitions with an
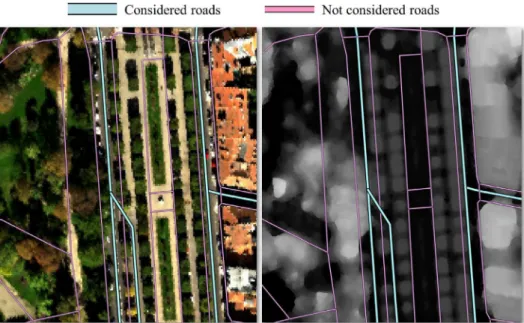
overlap of 80%. A vector layer of roads derived from the OSM database is used and identified as “GIS data” in the next sections. In OSM, each road of the road network is characterized by the attribute type which describes the type of road (motorway, primary, path, etc.). Only the primary, secondary, tertiary, residential and service roads are con sidered because we assume that the street trees are only planted along roads with motor vehicle traffic (Fig. 3).
2.3. Preprocessing
Geometric and radiometric preprocessing is carried out. From the stereoscopic measurements, the French Mapping Agency provides us a
georeferenced DSM with a spatial resolution of 12.5 cm. Then, the VNIR image is registered on the DSM by defining Ground Control Points (GCP) on QGIS and by using the function gdalwarp from GDAL. Nearest neighbor resampling is applied in order to preserve the original spectral data. Also, the Thin Plate Spline (TPS) transformation (Duchon, 1977) is applied for its ability to correct the deformations locally. Because the VNIR pixels have rectangular shapes with the longer side along track, a square grid with a spatial resolution of 0.4 m (minimum between the rectangle sides) is chosen to preserve the original data. Visual assess ment suggests that the error is less than a pixel for the whole data set. Furthermore, the hyperspectral data are atmospherically corrected to deal with spectral reflectances with COCHISE (Poutier et al., 2002) based on MODTRAN and assuming aflat scene. The DSM is resampled to the VNIR image resolution (0.4 m × 0.4 m) with the nearest neighbor resampling. In order to get a normalized DSM (nDSM) and assuming a flat ground, the ground altitude is estimated as the altitude corre sponding to the maximum of the DSM histogram and we make the difference between the DSM and the estimated altitude (Adeline, 2014). The size of the bins of the histogram is 1 m.
3. Methods
The description of the proposed method is carried out in Section3.1, followed by Section3.2with the description of a baseline ITCD method used for comparison.
3.1. Proposed street tree mapping
Fig. 4presents the proposed street tree mapping scheme. First, the
high vegetation close to the streets is detected (Section3.1.1). Secondly, the street tree crowns are delineated based on MPP which allow a prior contextual information to be modeled via an interaction term (Section
3.1.2). In this paper, we assume that the street trees can be character
ized by the following discriminative contextual features:
•
A street tree is close to a road.•
A street tree is aligned with its neighbors.•
A street tree has the same height as its neighbors. 3.1.1. High vegetation detectionFour masks (vegetation, shadow, height and optionally distance) are combined (geometric intersection, i.e. logical operator and) in order to generate a high vegetation mask. This last one is then used for com puting the data energy U xd( ) of the MPP, defined in Section 3.1.2
(Fig. 4). The mask is the MPP input data that allows to reduce the
Fig. 1. Study area with the three study cases represented on a Google Earth image. The yellow rectangles correspond to each study case. (For interpretation of the references to color in thisfigure legend, the reader is referred to the web version of this article.)
Fig. 2. Description of the study cases. At the top,field view is showed for each case. At the bottom, Google Earth images illustrate each case. J. Aval et al.
computational time, by restricting the search space P (introduced in Section3.1.2). For the vegetation mask, the NDVI (Normalized Differ ence Vegetation Index) index (Rouse et al., 1974) is computed for each pixel of the VNIR image from a red and an infrared hyperspectral bands. Above a threshold determined automatically with the Otsu method
(Otsu, 1975), the pixels are kept. About the shadow mask, the spectral
reflectance cannot be retrieved in shadows, as the atmospheric
correction method is based on aflat scene hypothesis (Fig. 3near trees and buildings). To avoid errors from these shadow regions, a literature index defined as: =I 1/6 (2∗ ∗R+G+B+ ∗2 NIR) (Nagao et al., 1979) is used for its efficiency and simplicity in the same way as the NDVI. Regarding the height mask, all the pixels with a nDSM value higher than 5 m arefiltered (the minimum height value of the alignment trees in Toulouse according to urban managers). Finally, a distance to the Fig. 3. Illustration of the data used in this study for thefirst site. Left: VNIR reflectance image. Right: DSM. The GIS data is represented by blue and violet lines indicated over the airborne data. (For interpretation of the references to color in thisfigure legend, the reader is referred to the web version of this article.)
roads mask is optionally used to assess the contribution of the GIS data to the street tree mapping. Below a distance threshold of 20 m, the pixels are retained. Indeed, from the width of the roads and the rules for planting the trees along the roads in France, street tree trunks can be at more than 10 m from the middle of the roads. A margin of 10 m is taken in order to consider all the pixels of the crowns. For building the high vegetation mask, the NDVI and the shadow index could be computed from multispectral data. For next sections, the use of the GIS data is referred as“with GIS”, “without GIS” otherwise (with or without road network information).
3.1.2. Street tree crown delineation based on MPP
The street tree map can be viewed as a space where positions and attributes of street trees are a specific realization of a marked point process noted x (Van Lieshout, 2000). The proposed method assumes that the street tree crowns can be represented as disks. In this context, a state space χin which x is a realization can be defined such as:
= × = × ×
χ P M [1,XM] [1,YM] [ ,rm rM] (1) wherePandM correspond to the position space and the space of the marks, respectively. Regarding the positions,XMandYMare the column
and line numbers of the VNIR image. About the marks,rmandrMare the
minimum and maximum radius of the disks (2 m and 8 m respectively because the street trees are pruned and have their radius included in this range according to urban managers). Tofind the realization of x which corresponds to the street tree map, the issue becomes an energy minimization including two energy terms called the data energy U xd( ) and the interaction energy U xi( )(Perrin et al., 2006). In the context of the street tree mapping, the data term models individual street trees (tree level) while the interaction term models the discriminative con textual features of the street trees (alignment level with hypotheses of small angle between the trees and similar heights).
The data energy U xd( )is the sum of the individual data energies
U xd( )i of each street treexi(xiis defined by its position and radius). The
computation ofU xd( )i is taken from Zhou et al. (2010). Instead of
computing a grey level radiometric distance between the pixels in the disk and the pixels in the concentric annulus around the disk (i.e. outside the possible crown) corresponding to xi, a simple difference
between the proportion of high vegetation pixels (from the high vege tation mask) in the disk and the proportion of high vegetation pixels in
the concentric annulus is computed. We consider thatxicorresponds to
a street tree if this distance exceeds a certain threshold d0(0.2fixed
after testing multiple values between 0 and 1) (Eq.(2)).
= − =⎧ ⎨ ⎩ − < − − − ⩽ d x U x if d x d d x d if d d x ( ) ( ) 1 ( ) exp[ ( ( ) )] 1 ( ) i N N N N d i d x d i i i ( ) 0 0 0 xi t xi axi t axi i , , 0 (2) with Nxi and Nt x,ithe number of high vegetation pixels and the total number of pixels in the disk (i.e. N
N
xi
t xi, is a proportion of high vegetation pixels in the disk). Similarly, Naxi and Nt a,xi are the number of high
vegetation pixels and the total number of pixels in the concentric an nulus whose radius isfixed to 1 m in order to include pixels all along the annulus.
The interaction energy U xi( )is the sum of an energy U xis( )that ensures the stability of the process and the street tree feature energy Uif( )x that models the features of the street trees. As inPerrin et al.
(2005), the energy U xis( )i for a street treexiis defined according to the
intersected areas between the street tree crowns and avoids an ex cessive overlap of the trees (for example trees located almost in the same place) (Eq.(3)).
∑
= ∩ ≠ U x A A A A ( ) min( , ) i i j i x x x x s i j i j (3)whereAxiandAxjrefer to the areas ofxiand xj. Concerning the street
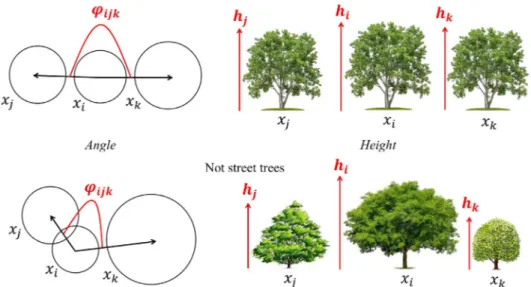
tree feature energy U xif( ), it is defined by considering the features of the street trees in the urban environment illustrated inFig. 5. Whereas the not street trees have no particular spatial organization and different heights, the street trees form lines and are pruned in the same way, most often to adapt the trees to the constraints of the sites. This results in a small angle between the trees and similar shapes (here we only consider the height to model the shape). In order to model these fea tures, we define the street tree feature energy U xif( )i for a street treexi
based on its features and the features of two of its neighboring street trees, i.e. an alignment is modeled from three street trees (Fig. 5and Eq.
(4)). We choose three trees because such a model is moreflexible in case of curved roads for example.
Fig. 5. Illustration of the contextual features used to compute the interaction energy. At the top, the case of street trees is described (similar height, tree species and alignment). At the bottom, the case of trees which are not street trees is presented (various height, different tree species and no alignment).
⎜ ⎟ ⎜ ⎟ ⎡ ⎣ ⎢ ⎛ ⎝ ⎞ ⎠ ⎤ ⎦ ⎥= ⎛ ⎝ + ⎞ ⎠ ∈ ⎡ ⎣ ⎢ ⎤ ⎦ ⎥ =⎧ ⎨ ⎩ = ∅ = − < ⩽ = ⩽ ⩽ + − + − ∈ U x x x a b U if V U x x x otherwise where θ π φ if π φ π and θ φ if φ π , , · · · 0, 1 1 min [ , ( , )] /2 0 /2 i i j k a b θ π h h h h h h h i x x x x V i i j k
ijk ijk ijk
ijk ijk ijk
1 / 2 2·max( , , ) ( ) ( , ) f ijk i j i k i j k f i i j k xi f (4) and the boolean a and b are used to study the contribution of the angle between the trees (first term) and the heights (second term) in the street tree mapping. For next sections,a=1is referred as“with θ” whereas is referred as“without θ” (with or without angle information). Similarly,
=
b 1is referred as“with h” whereasb=0is referred as“without h” (with or without height information). φijkis the angle between the two
segments joining the center ofxiwith the centers of xj andxk. In par
ticular, U xif[ , ( ,i x xj k)]is computed for all pairs of neighbors xjandxkin
the neighborhood Vxiofxi(radius of 25 m because the distance between
two trees in an alignment does not exceed 10 m according to urban managers and the first and last trees have to be considered). The minimum U xif[ , ( ,i x xj k)]is then retained as U xif( )i. If there is no pair of neighbors, U xif( )i is equal to 1 (penalized), because an alignment tree is
never isolated. When there is a small angle between the street treexi
and its neighboring street trees of similar heights, U xif( )i is close to 0.
Other configurations are penalized as they result in higher values of Uif( )xi .
For the energy minimization, the simulated annealing Multiple Births and Deaths process (MBD) (Descombes et al., 2009) is chosen as the optimization algorithm because it has proven good performance in the literature when applied in combination with MPP for mapping tree plantations in a rural environment (Perrin et al., 2005). The principle of this algorithm is to alternate phases of“birth” (proposal of street trees) and phases of“death” (removal of the street trees that are not relevant in the sense of the defined energy). A temperature term that decreases during the process is used to explore different tree configurations. This is necessary in order to reach the global minimum of the energy and not to stop at a local minimum. First, we initialize the temperature T (fixed to 0.01) and the birth rate δ (equal to 200 which corresponds to the order of magnitude of the number of trees in the scenes). Concerning the value of the initial temperature which is similar to the one used in
Descamps et al. (2009), the minimized energy distributions resulting
from higher initial temperature values (tests from 0.01 to 0.05) are similar. The lowest is then kept to reduce computational time. There fore, this choice is empirical and may thus be specific to our dataset and study areas. Then, the algorithm is defined as follows:
1.Birth of the street trees: For each pixel s of the VNIR image, if there is not already a street tree at this position, we place a street tree with the probability ∗δ B s r( , ) at this position. B s r( , ) is proportional to the data energyU xd( )i corresponding to a disk placed at the pixel s
with a radius r and is used to reduce computational time as in
Descombes et al. (2009). Otherwise, the street trees would be ran
domly positioned uniformly.
2.Sorting of the street trees according to their energy: We compute the data energyU xd( )i for each street treexiin the current street tree
map. Then, the street trees are sorted according to decreasing data energy.
3.Death of the irrelevant street trees: For each street treexitaken in
this order, we compute the death rate as follows:
⎜ ⎟ = ⎛ ⎝ ⎜ ⧹ ⎞ ⎠ ⎟ = ⎛ ⎝ ⎞ ⎠ ⧹ + ⧹ + + d x where e x x ( ) exp i δ e x δ e x i α U x β U x γ U x T x x · ( ) 1 · ( ) · ( ) · ( ) · ( ) i i d i is i if i (5) with α β, andγ corresponding to the weights of the different en ergies (fixed to 1, 1 and 3.5 respectively after testing multiple
These three steps are repeated 1000 times as the street tree map does not change from one iteration to another at this stage of the process. In other words, the convergence is reached at this stage. In order the reduce computational time, γ is set to 0 for the first 600 iterations to map the trees without distinction between the street trees and the not street trees. From the 600th iteration,γis set to 3.5 to map the street trees. At the end of each iteration, T and δ are multiplied by a factor of 0.997 (similar to that used inDescombes et al. (2009)). 3.2. Baseline tree crown delineation used for comparison
To our knowledge, no individual street tree mapping has been proposed. Thus, as a baseline for comparison, we chose a standard tree crown delineation that is today the only available solution for the purpose of that paper, even if the objectives are not exactly the same. The baseline tree crown delineation considered as the reference method is a region growing method developed inAdeline (2014)and inspired from the work ofIovan et al. (2008). This type of approach is chosen as a baseline because it is commonly used in the literature (Zhen et al., 2016). In particular, a Canopy Height Model (CHM) is derived from a high vegetation mask obtained similarly to the one generated with the proposed method and the DSM. The CHM is smoothed with a Gaussian filter whose standard deviationsGaussis equal to 2 here as inAdeline
(2014). This allows the irregularities at the surface of the trees to be
removed. Indeed, because of the foliage structure at the top of the trees, there can be multiple local maximums that do not correspond to mul tiple trees. The high vegetation mask is then treated such that the smallest regions are removed. This is done according to a parameter Nmintreewhich defines the minimum number of pixel per tree (here equal to
5 as inAdeline (2014)). From this step, every pixel of the CHM is as signed to a particular tree by decreasing height. As an initialization step, the highest pixel of the CHM is chosen as thefirst pixel of the first delineated tree. Then the height is decremented and the corresponding pixel is either assigned to thatfirst tree if it is at a distancedadjless than
2 m here as inAdeline (2014), or assigned to a new tree, and so on. 3.3. Accuracy assessment
In order to assess the results of the methods and compare their performances, a confusion matrix is built by visual interpretation (Table 1).
From the confusion matrix, the Producer Accuracy (PA), the User Accuracy (UA) and the F score are used to assess the performance specifically for the street trees:PA(%)= =
+ UA + 100· TP , (%) 100· TP FN TP TP FP andF score- = + (%) 100· PA UA PA UA 2· · . Table 1
Description of the confusion matrix.“True” refers to the real street trees and not street trees in the scene while“Predicted” refers to the predicted street trees and not street trees by the method under consideration. The“–” symbol signifies that we do not take into account the“True Negative” trees (well predicted not street trees). To consider the“True Negative” trees, it would be necessary to have the number of park trees in thefirst and second study cases, and the number of trees in private properties for the third study case, an information that is not available.
Predicted
Street tree (st) Not street tree (st) Total
True Street tree (st) True Positive (TP) False Negative (FN) TP + FN Not street tree (st ) False Positive (FP) –
Total TP + FP
values). γ = 0 refers to “without θ and without h” (without angle information and without height information).
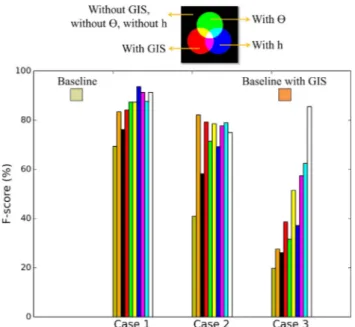
improvements of 15p.p., 17p.p. and 59p.p. compared to the case where no feature is used). However, using only θ and h gives already good results. On the other hand, using only the GIS data is not appropriate and needs the integration of θ and h. Focusing on θ and h, they have to be used together.Fig. 10illustrates the contribution of the angle be tween the trees and the heights. With the integration of these features, the majority of the street trees are mapped correctly. This result is ex pected because the street trees form lines and are mostly the same height which is highlighted in the interaction energy defined in the proposed method.
In order to go further in the analysis,Fig. 11shows the confusion matrices of the three main configurations of features. The F score im provements obtained with the integration of the street tree features is mainly explained by a decrease of the number of“True Negative” trees. Nevertheless, the evolution of the number of“False Negative” among the configurations of features shows that the “False Negative” tree number is increasing with the integration of θ and h. Especially, there are 3 further“False Negative” trees (PA decreases of 6p.p. and 4p.p.) with the integration of these features for the first and second cases when using the GIS data. Even if these errors are marginal, this trend is
observed among the set of simulations. In fact, the street trees do not form perfectly straight lines and that they do not have strictly the same heights (hypothesis not always verified). Thus a too strong integration of these features (via the parameterγin the proposed method, Section
3.1.2, Eq.(5)) can result to consider some“non perfect” street trees as not street trees. In the second case, the number of“False Negative” trees is particularly high when using GIS data. Indeed, in the GIS data, there is no considered road at the right side of the square as it is a pathway in the park (Fig. 10, pink road). As a consequence, all the street trees along this pathway arefiltered at the high vegetation detection step when using GIS data as they are too far from the closest roads (other sides of the square).
5. Discussions
5.1. Individual tree detection in its context
These results demonstrate the ability of the proposed method to detect the street trees in three different circumstances, while a standard tree crown delineation obviously does not allow the specific urban tree structures to be identified. This performance is consistent with that of
Wen et al. (2017) who obtained a F score of 89% when mapping
roadside canopies with a patch level approach. However, our scheme maps the trees individually, which is essential for an individual health monitoring of the street trees. Indeed, the prevention of the fall of sick trees cannot be carried out if the trees are not mapped individually. In the urban environment, the alignment trees are subject to specific conditions as they have little space for growth, are pruned and can be affected by the spread of diseases in single species plantations (Fini et al., 2015; Sebestyen et al., 2008).
The proposed study also highlights the interest of considering the tree in its context, i.e. considering tree structures. In addition to their usefulness for urban managers, the tree structures could be used in order to improve not only the individual tree mapping itself (by taking advantage of a prior contextual information knowledge about the urban trees depending on their structure), but also the tree species classifi cation for example (by defining specific categories of urban trees Fig. 8. Comparison of the produced maps for the baseline method and the
proposed method for the third case. The colors under“Baseline method” and “Proposed method” refer to the colors used inFig. 6. (For interpretation of the references to color in thisfigure legend, the reader is referred to the web ver-sion of this article.)
Fig. 9. Contribution of the angle, the height and the GIS data in terms of F-score for each study case. Each color corresponds to a combination of (if GIS used), (if θ used) and (if h used) colors. The color under“Baseline method” and the white color refer to the colors used inFig. 6. (For inter-pretation of the references to color in thisfigure legend, the reader is referred to the web version of this article.)
mapping other types of vegetation such as hedges which form lines and have similar heights. The same statement can be made regarding the detection of the vineyards.
However, using more and more features requires logically the de finition of as many parameters. In this study, the MPP parameters are the same for the three cases which demonstrates that the proposed scheme is robust from a case to another, but that the set of parameters could be better estimated for each case. The parameter estimation is an important step which effectively impacts the performance of the methods based on MPP (Chatelain et al., 2009; Hadj et al., 2010). On the other hand, the MBD optimization algorithm has been chosen, in particular for its very good speed of convergence and its simplicity of implementation. Instead, other algorithms such as Reversible Jump MCMC (RJMCMC) or Multiple Birth and Cut (MBC) could have been used. While the MBD outperforms the RJMCMC in terms of speed of convergence, the MBC reaches a lower energy level than the MBD but in longer time (Descombes et al., 2009; Gamal Eldin et al., 2010). Thus the MBC could be considered as another optimization algorithm in order to get a more accurate street tree map.
5.3. Applicability of the proposed method in other cities
The proposed framework has been applied to three study areas and the observed trends are the same among these different conditions. But of course, the applicability of the method in other cities is not assessed here.
In order to get an idea of its applicability, the proposed method (with GIS, θ and h) is tested on the ISPRS dataset (Cramer, 2010), keeping the same set of parameters than for Toulouse city for assessing the robustness of the method. The Vaihingen data corresponding to the 2D semantic labelling benchmark test are considered. Initially equal to 8 cm and 9 cm respectively, the spatial resolutions of the digital aerial images and DSM are resampled (nearest neighbor) to 50 cm, in order to reduce computational time. On the other hand, as the ground is notflat, the DSM is normalized using the histogram based thresholding detailed in Section2.3, except that the histogram is computed in a 60 m window (instead of the whole DSM initially) to ensure that we include ground areas in cases of overlapping canopies. The results of this test are illu strated inFig. 13. The proposed approach reaches a F score value of 61%, against 55% (−6p.p.) for the baseline. UA values of 89% and 40% are obtained, while PA values of 47% and 88% are achieved, respec tively.Fig. 13illustrates these accuracies. The proposed approach leads to only few false positive cases, while the baseline one detects all the trees that are close to the streets, leading to many false positive trees. For that reason, the alignment trees are not omitted by the reference method. However, our approach omits many street trees, for example
an alignment of very small tree crowns in the lower right corner of
Fig. 13. This is the same behavior as in Toulouse: the proposed ap
proach does not confuse the street trees and the other ones, but tends to underestimate the number of street trees, especially because the street trees are not perfectly circular, aligned and of the same height. Overall, from the user’s point of view, our method only detects street trees, which is the objective of this study. In addition, our method allows curved alignments to be identified, thanks to the flexibility of using triplets of trees.
Moreover, we have computed the street tree feature energy (Section
3.1.2, Eq.(4)) of all the inventoried street trees in the tree database of Paris (Fig. 14). This database contains, among other information, the location of the street tree trunks and the heights. This histogram shows that the street trees of Paris have overall the discriminative contextual features highlighted in this paper. In particular, the peak near 0 cor responds to around 8000 street trees that are perfectly aligned with their neighbors and have exactly the same heights than their neighbors. And knowing that the height resolution of the Paris tree database is 1 m, the other local peaks highlight recurrent differences in height. For ex ample, the peak around 0.08 corresponds to perfectly aligned street trees with a height of 12 m and two neighbors with heights of 11 m, or a neighbor with a height of 11 m and the other with a height of 13 m, or a neighbor with a height of 14 m and the other with a height of 12 m, etc. On the other hand, theflexibility of the alignment model based on three trees should allow to deal with curved roads. This is encouraging with a view to doing the street tree map of Paris and this attests the potential of the proposed method for other cities.
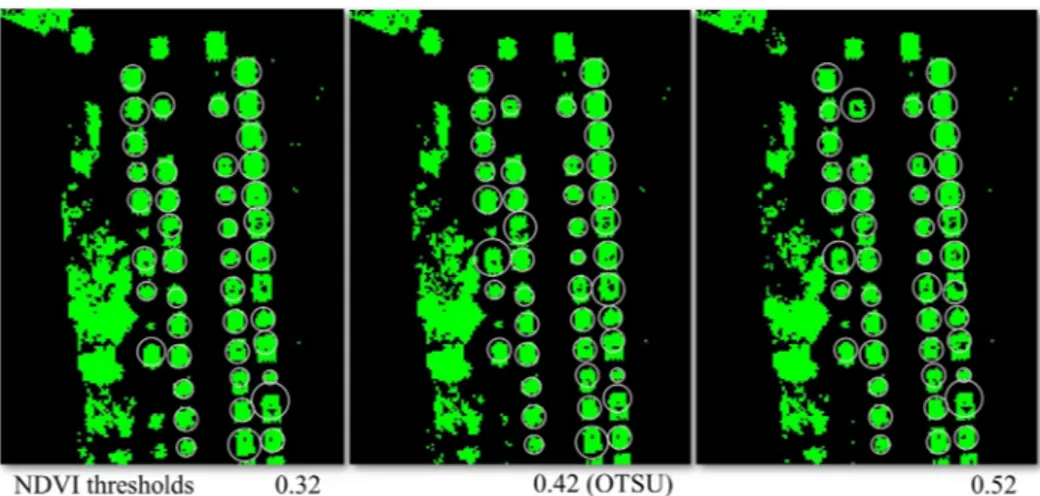
Another key element when talking about the applicability of the proposed method in other cities is the computational burden of the method.Table 2highlights the duration of the baseline and proposed approaches, knowing that the baseline is written in Interactive Data Language (IDL) and the proposed one in python. The baseline method is the best in terms of computational burden with execution times of approximately 10 s, 10 min and 30 min (10 s, 1 min and 20 min with the GIS data) for the three study cases, instead of 20 min, 50 min and 3 h (20 min, 30 min and 1.5 h with the GIS data) for the proposed method. Logically, the execution time decreases when using the GIS data be cause the high vegetation mask covers a smaller area. This table highlights also that the behavior of the baseline and proposed ap proaches are different according to the increasing surface covered by the high vegetation mask from thefirst to the third case. Indeed, using the GIS data, the baseline approach is 120 times faster than the pro posed one for thefirst study case, whereas the baseline becomes 30 and 4.5 times faster for the second and third cases, respectively. From a small scene to a larger scene, the number of pixels increases more than the number of trees. The baseline approach suffers from its pixel to Fig. 12. Street tree maps obtained with the proposed method for different values of NDVI thresholds in the first study case. All the features (with GIS, θ and h, Section
pixel approach which implies the consideration of each pixel during the delineation process. As the data energy can be computed in advance for the proposed method, it can benefit from its object oriented principle. Finally, even if the computational burden is not an issue for a city wide application (because it does not need very frequent updating), and that the baseline gives better execution times for the cases under con sideration in this study, the proposed framework may be more appro priate for scenes larger than those considered here.
5.4. Limits of the proposed approach
In summary, the limits of the proposed approach are illustrated in
Fig. 15. On the one hand, thefirst limit of the proposed method occurs
for cases of significant overlaps between the tree crowns (Fig. 15, left). In such a situation, the crowns are difficult to discern in the high ve getation mask, and it is accentuated in our autumn based experiment because of certain trees having a lot of senescent leaves (Fig. 15, left). Thus this implies having data outside winter/autumn. For these cases, nDSM based features modeling the 3D shape of the trees could make the approach more accurate. An alternative would be also to consider
the radiometric levels of the optical images directly, for example, by considering that the boundaries of the crowns appear darker in the images. On the other hand, a significant spatial connection between the street trees and the other ones can lead to failure cases, as illustrated in
Fig. 15, middle. Focusing on this figure, the magenta individual is
aligned with one of its neighboring street trees, and has the same height. Including that the street trees are aligned along the roads, in addition to be close to them, could be an effective solution. However, this is an unlikely thus less critical issue. Moreover, the street trees can have different heights. This is the case inFig. 15, right, and the smallest tree is omitted by our approach. This happens when new trees are planted. A solution could be to consider that a tree aligned with its neighbors along a road is probably a street tree, even if it has a different height. Finally, the results of the proposed method on the Vaihingen data demonstrate that very small crowns can be omitted. While de grading the spatial resolution allows to reduce computational time, this leads very small crowns to have few pixels, thus a non circular shape which is not well handled by our approach. A solution would be to improve the modeling of the crown shape.
Fig. 13. Comparison of the produced maps for the baseline method and the proposed method for the ISPRS dataset. The colors under“Baseline method” and “Proposed method” refer to the colors used inFig. 6. (For interpretation of the references to color in thisfigure legend, the reader is referred to the web version of this article.)
5.5. Improving tree species classification in urban alignment
For several applications such as state of health monitoring, tree species information is essential (Fassnacht et al., 2016). Remote sensing gives encouraging results in tree species classification, especially thanks to hyperspectral data (Alonzo et al., 2014), but in urban environment it remains a challenging task because of the large tree diversity (species, age, life conditions, pruning, etc.) (Welch, 1982). As a case in point, we propose to map the species of the third study area, whose alignment is composed of Platanus × hispanica trees. In particular, the tree crowns arefirst estimated thanks to the proposed method with all the features (with GIS, θ and h, Section3.1.2, Eq.(4)). Then, the tree species are classified thanks to an object based approach similar to that used in
Alonzo et al. (2014). In fact, the VNIR pixels within the tree crowns are classified, followed by a majority vote for each crown. The learning step is carried out from pixels of a reference site situated near thefirst study area, and the Minimum Noise Fraction (MNF) components are used as feature vector. Focusing onFig. 16(top: before regularization), there are mainly errors in the right part of the alignment (18 trees on the
basis of 69 detected are misclassified). From that baseline, the proposed method can be used in order to regularize the species estimation within the alignment. Indeed, the different tree triplets identified thanks to the street tree feature energy U xif( )(Section3.1.2, Eq.(4)) can easily be linked to form networks. The majority species of each network can then be assigned to the corresponding trees. With 100% of correct predic tions (over the 69 detected trees) for this study case,Fig. 16(bottom: after regularization) demonstrates the potential of the proposed method Fig. 14. Histogram of the street tree feature energy (Section 3.1.2, Eq.(4))
computed from 43,168 street trees of the tree database of Paris. Only the main species are taken into account: plane tree, horse chestnut, pagoda tree and lime tree (Platanus × hispanica, Aesculus hippocastanum, Sophora japonica and Tilia tomentosa).
Table 2
Comparison of the baseline and proposed methods in terms of computational burden.
Framework Case 1 Case 2 Case 3
Without GIS Baseline ∼10 s ∼10 min ∼30 min
Proposed ∼20 min ∼50 min ∼3 h
With GIS Baseline ∼10 s ∼1 min ∼20 min
Proposed ∼20 min ∼30 min ∼1.5 h
Fig. 15. Illustration of the limits of the proposed approach. Left: overlapping with an illustration of the corresponding high vegetation mask in the bottom right-hand corner, showing that the street trees are difficult to discern. Middle: spatial connection. Right: different heights.
Fig. 16. Improvement of tree species classification in urban alignment thanks to the proposed method for the third case (whose alignment is mainly composed of Platanus × hispanica tress).
for improving tree species classification within urban alignment. Even if a limit of that approach occurs for cases of alignments with multiple species, the proposed method could be modified in order to handle these cases, only if the trees are planted in a specific way (bispecific alignment whose species is alternated one in two for example).
6. Conclusions
The objective of this study is to map the street trees using airborne data and contextual information based on MPP method. Three test sites are considered for assessing the performance of the proposed method under different conditions. Airborne hyperspectral data, a DSM and GIS data which included the roads are used, but multispectral data could be used instead of the hyperspectral data. From these data, the vegetation canopies close to the streets are detected thanks to simple thresholds of NDVI, shadow index, height and distance to the streets respectively. The obtained high vegetation mask is then treated through a scheme based on MPP. In particular, the discriminative contextual features of the street trees (hypotheses of small angle between the trees and similar heights) are modeled in the interaction energy of the MPP. As a baseline for comparisons, a standard region growing crown delineation ap proach is considered.
Regarding the results, the proposed method logically outperforms the reference method with overall F score values on the three study sites of 85% with all the features against 44% with differences of 15p.p., 38p.p. and 65p.p. respectively in favor of the proposed method. It demonstrates the ability of the proposed method to map the street trees in three different circumstances. Focusing on the contributions of the discriminative contextual features in the individual street tree mapping, the F score values are 91%, 75% and 85% with all the fea tures (with GIS, θ and h). Without GIS but with θ and h, the F score values become 88%, 79% and 62% (−3p.p., +4p.p. and −23p.p.). It is thus more appropriate to exploit together the GIS data, the angle be tween the trees and the heights. Nevertheless, using only θ and h gives already good results (76% overall on the three study sites). Finally, the GIS data alone is not sufficient.
Further work is necessary and there are many perspectives. In this paper, we see that the proposed method can be improved in the case of significant overlap. In addition, the same set of parameters have been used for the three cases. Compared to the obtained results, it shows that the proposed approach is robust but highlights the importance of the parameter estimation step. Also, other features could be used in order to model the street trees. Moreover, the method will be applied on more difficult cases, like area with street trees forming a homogeneous ca nopy. In theses cases, it is often impossible to distinguish the crowns from the spectral data and from the DSM, which encourages the use of another technology. For example, multitemporal data acquired during the winter could help. In the long term, the proposed approach could be improved to map the other populations of trees such as park trees. The species and the state of health of the trees will be also of interest.
Acknowledgments
The authors would like to thank the French Aerospace Lab and the Occitanie region for funding this research. Regarding airborne data, thanks to Philippe Deliot and the French Mapping Agency for their participation in the UMBRA campaign. The Vaihingen data set was provided by the German Society for Photogrammetry, Remote Sensing and Geoinformation (DGPF) (Cramer, 2010): http://www.ifp.uni
stuttgart.de/dgpf/DKEP Allg.html. Thanks to the members of the HY
perspectral imagery for Environmental urban Planning (HYEP) project, funded by the French National Research Agency (ANR). Thanks to Bertrand Peyce, Etienne Ducasse and Manon Daumur for discussions about the features of the urban environment.
Appendix A. Supplementary material
Supplementary data associated with this article can be found, in the online version, athttps://doi.org/10.1016/j.isprsjprs.2018.09.016. References
Adeline, K., 2014. Classification des matériaux urbains en présence de végétation éparse par télédétection hyperspectrale à haute résolution spatiale (Ph.D. thesis). Toulouse, ISAE.
Adeline, K.R., Le Bris, A., Coubard, F., Briottet, X., Paparoditis, N., Viallefont, F., Rivière, N., Papelard, J.-P., David, N., Deliot, P., et al., 2013. Description de la campagne aéroportée UMBRA: étude de l’impact anthropique sur les écosystèmes urbains et naturels avec des images THR multispectrales et hyperspectrales. Revue française de photogrammétrie et de télédétection (202), 79–92.
Alonzo, M., Bookhagen, B., Roberts, D.A., 2014. Urban tree species mapping using hy-perspectral and lidar data fusion. Remote Sens. Environ. 148, 70–83.
Alvarez-Uria, P., Körner, C., 2007. Low temperature limits of root growth in deciduous and evergreen temperate tree species. Funct. Ecol. 21 (2), 211–218.
Ardila, J.P., Tolpekin, V.A., Bijker, W., Stein, A., 2011. Markov-random-field-based super-resolution mapping for identification of urban trees in vhr images. ISPRS J. Photogrammet. Remote Sens. 66 (6), 762–775.
Baraton, A., 2014. Mes trucs et astuces de jardinier. Flammarion.
Bolund, P., Hunhammar, S., 1999. Ecosystem services in urban areas. Ecol. Econ. 29 (2), 293–301.
Chatelain, F., Descombes, X., Zerubia, J., 2009. Parameter estimation for marked point processes application to object extraction from remote sensing images. In: International Workshop on Energy Minimization Methods in Computer Vision and Pattern Recognition. Springer, pp. 221–234.
Chen, Q., Baldocchi, D., Gong, P., Kelly, M., 2006. Isolating individual trees in a savanna woodland using small footprint lidar data. Photogrammetr. Eng. Remote Sens. 72 (8), 923–932.
Chiesura, A., 2004. The role of urban parks for the sustainable city. Landscape Urban Plann. 68 (1), 129–138.
Cramer, M., 2010. The dgpf-test on digital airborne camera evaluation—overview and test design. Photogrammet.-Fernerkund.-Geoinform. 2010 (2), 73–82.
Descamps, S., Descombes, X., Bechet, A., Zerubia, J., 2009. Flamingo detection using marked point processes for estimating the size of populations. Traitem. Signal 26 (2), 95–108.
Descombes, X., Minlos, R., Zhizhina, E., 2009. Object extraction using a stochastic birth-and-death dynamics in continuum. J. Math. Imaging Vision 33 (3), 347–359.
Doick, K.J., Peace, A., Hutchings, T.R., 2014. The role of one large greenspace in miti-gating London’s nocturnal urban heat island. Sci. Total Environ. 493, 662–671.
Duchon, J., 1977. Splines minimizing rotation-invariant semi-norms in Sobolev spaces. In: Constructive Theory of Functions of Several Variables. Springer, pp. 85–100.
Fassnacht, F.E., Latifi, H., Stereńczak, K., Modzelewska, A., Lefsky, M., Waser, L.T., Straub, C., Ghosh, A., 2016. Review of studies on tree species classification from remotely sensed data. Remote Sens. Environ. 186, 64–87.
Fini, A., Frangi, P., Faoro, M., Piatti, R., Amoroso, G., Ferrini, F., 2015. Effects of different pruning methods on an urban tree species: a four-year-experiment scaling down from the whole tree to the chloroplasts. Urban For. Urban Green. 14 (3), 664–674.
Gamal-Eldin, A., Descombes, X., Zerubia, J., 2010. Multiple birth and cut algorithm for point process optimization. In: 2010 Sixth International Conference on Signal-Image Technology and Internet-Based Systems (SITIS). IEEE, pp. 35–42.
Gillner, S., Vogt, J., Tharang, A., Dettmann, S., Roloff, A., 2015. Role of street trees in mitigating effects of heat and drought at highly sealed urban sites. Landscape Urban Plann. 143, 33–42.
Gomesa, M.F., Maillarda, P., 2014. Integration of marked point processes and template matching for the identification of individual tree crowns in an urban and a wooded savanna environment in Brazil. In: Proc. of SPIE, vol. 9245, p. 92450X-1.
Gupta, S., Weinacker, H., Koch, B., 2010. Comparative analysis of clustering-based ap-proaches for 3-d single tree detection using airborne fullwave lidar data. Remote Sensi. 2 (4), 968–989.
Hadj, S.B., Chatelain, F., Descombes, X., Zerubia, J., 2010. Parameter estimation for a marked point process within a framework of multidimensional shape extraction from remote sensing images. In: ISPRS Technical Commission III Symposium on Photogrammetry Computer Vision and Image Analysis (PCV 2010), p. 1.
Iovan, C., Boldo, D., Cord, M., 2008. Modelisation de la vegetation en milieu urbain: Detection et caracterisation a partir d’images aeriennes haute resolution couleur et infrarouge. Revue française de photogrammétrie et de télédétection (189), 17–27.
Köhler, C.H., 2016. Airborne imaging spectrometer hyspex. J. Large-scale Res. Facil. JLSRF 2 (A93), 1–6.
Leckie, D., Gougeon, F., Hill, D., Quinn, R., Armstrong, L., Shreenan, R., 2003. Combined high-density lidar and multispectral imagery for individual tree crown analysis. Can. J. Remote Sens. 29 (5), 633–649.
MacFaden, S.W., O’Neil-Dunne, J.P., Royar, A.R., Lu, J.W., Rundle, A.G., 2012. High-resolution tree canopy mapping for New York city using lidar and object-based image analysis. J. Appl. Remote Sens. 6 (1) 063567-1.
McPherson, E.G., van Doorn, N., de Goede, J., 2016. Structure, function and value of street trees in California, USA. Urban For. Urban Green. 17, 104–115.
Miyajima, Y., Takahashi, K., 2007. Changes with altitude of the stand structure of tem-perate forests on mount Norikura, Central Japan. J. For. Res. 12 (3), 187–192.
Nagao, M., Matsuyama, T., Ikeda, Y., 1979. Region extraction and shape analysis in aerial photographs. Comput. Graph. Image Process. 10 (3), 195–223.
Otsu, N., 1975. A threshold selection method from gray-level histograms. Automatica 11 (285–296), 23–27.
Perrin, G., Descombes, X., Zerubia, J., 2005. A marked point process model for tree crown extraction in plantations. In: IEEE International Conference on Image Processing, 2005. ICIP 2005, vol. 1. IEEE, pp. I–661.
Perrin, G., Descombes, X., Zerubia, J., Boureau, J.-G., 2006. Forest resource assessment using stochastic geometry. In: International Precision Forestry Symposium. Poutier, L., Miesch, C., Lenot, X., Achard, V., Boucher, Y., 2002. Comanche and cochise:
two reciprocal atmospheric codes for hyperspectral remote sensing. In: 2002 AVIRIS Earth Science and Applications Workshop Proceedings.
Pulighe, G., Lupia, F., 2016. Mapping spatial patterns of urban agriculture in Rome (Italy) using Google earth and web-mapping services. Land Use Policy 59, 49–58.
Ramdani, F., 2013. Urban vegetation mapping from fused hyperspectral image and lidar data with application to monitor urban tree heights. J. Geograph. Inform. Syst. 5 (04), 404.
Rol-Tanguy, F., Alba, D., Dragoni, M., Ter Minassian, H., Blancot, C., 2010. Essai de bilan sur le développement des arbres d’alignement dans paris, 2010. <https://www. apur.org/fr/nos-travaux/bilan-developpement-arbres-alignement-paris> (accessed: 24/10/17).
Rouse Jr. J., Haas, R., Schell, J., Deering, D., 1974. Monitoring vegetation systems in the great plains with ERTS. In: Third ERTS Symposium, NASA SP-351 I. pp. 309–317.
Sebestyen, D., Nemeth, M., Hangyal, R., Krizbai, L., Ember, I., Nyerges, K., Kolber, M., Kiss, E., Bese, G., 2008. Ornamental prunus species as new natural hosts of plum pox virus and their importance in the spread of the virus in Hungary. J. Plant Pathol. S57–S61.
Seto, K.C., Güneralp, B., Hutyra, L.R., 2012. Global forecasts of urban expansion to 2030 and direct impacts on biodiversity and carbon pools. Proc. Nat. Acad. Sci. 109 (40),
16083–16088.
Souchon, J.-P., Thom, C., Meynard, C., Martin, O., Pierrot-Deseilligny, M., 2010. The IGN CAMv2 system. Photogram. Rec. 25 (132), 402–421.
Vailshery, L.S., Jaganmohan, M., Nagendra, H., 2013. Effect of street trees on micro-climate and air pollution in a tropical city. Urban For. Urban Green. 12 (3), 408–415.
Van Leeuwen, M., Coops, N.C., Wulder, M.A., 2010. Canopy surface reconstruction from a LiDAR point cloud using hough transform. Remote Sens. Lett. 1 (3), 125–132.
Van Lieshout, M., 2000. Markov Point Processes and their Applications. World Scientific.
Welch, R., 1982. Spatial resolution requirements for urban studies. Int. J. Remote Sens. 3 (2), 139–146.
Wen, D., Huang, X., Liu, H., Liao, W., Zhang, L., 2017. Semantic classification of urban trees using very high resolution satellite imagery. IEEE J. Sel. Top. Appl. Earth Obser. Remote Sens. 10 (4), 1413–1424.
Xiao, Q., Ustin, S., McPherson, E., 2004. Using aviris data and multiple-masking techni-ques to map urban forest tree species. Int. J. Remote Sens. 25 (24), 5637–5654.
Yang, J., McBride, J., Zhou, J., Sun, Z., 2005. The urban forest in Beijing and its role in air pollution reduction. Urban For. Urban Green. 3 (2), 65–78.
Zhen, Z., Quackenbush, L.J., Stehman, S.V., Zhang, L., 2015. Agent-based region growing for individual tree crown delineation from airborne laser scanning (als) data. Int. J. Remote Sens. 36 (7), 1965–1993.
Zhen, Z., Quackenbush, L.J., Zhang, L., 2016. Trends in automatic individual tree crown detection and delineation-evolution of lidar data. Remote Sens. 8 (4), 333.
Zhou, J., Proisy, C., Descombes, X., Hedhli, I., Barbier, N., Zerubia, J., Gastellu-Etchegorry, J.-P., Couteron, P., 2010. Tree crown detection in high resolution optical and lidar images of tropical forest. In: Remote Sensing. International Society for Optics and Photonics pp. 78240Q–78240Q.