HAL Id: pastel-00550432
https://pastel.archives-ouvertes.fr/pastel-00550432
Submitted on 27 Dec 2010
HAL is a multi-disciplinary open access
archive for the deposit and dissemination of sci-entific research documents, whether they are pub-lished or not. The documents may come from teaching and research institutions in France or abroad, or from public or private research centers.
L’archive ouverte pluridisciplinaire HAL, est destinée au dépôt et à la diffusion de documents scientifiques de niveau recherche, publiés ou non, émanant des établissements d’enseignement et de recherche français ou étrangers, des laboratoires publics ou privés.
Oxydation of Clay Nanoreinforced Polyolefins
Glennys Giovanna Gutiérrez
To cite this version:
Glennys Giovanna Gutiérrez. Oxydation of Clay Nanoreinforced Polyolefins. Materials. Arts et Métiers ParisTech, 2010. English. �NNT : 2010ENAM0045�. �pastel-00550432�
N°: 2009 ENAM XXXX
Arts et Métiers ParisTech - Centre de Paris
Procédés et Ingénierie en Mécanique et Matériaux, PIMM
2010-ENAM-0045
École doctorale n° 432 : SMI, Sciences des Métiers de l’Ingénieur
présentée et soutenue publiquement par
Glennys Giovanna GUTIERREZ CASTRO
le 30 novembre 2010
OXIDATION OF NANOREINFORCED POLYOLEFINS
Doctorat ParisTech
T H È S E
pour obtenir le grade de docteur délivré par
l’École Nationale Supérieure d'Arts et Métiers
Spécialité “ Mécanique – Matériaux ”
Directeur de thèse : Gilles REGNIER Co-encadrement de la thèse : Bruno FAYOLLE
T
H
È
S
E
JuryM. Roland SEGUELA Directeur de Recherche au CNRS, UMT, Université Lille1, Lille. Président Mme Sandrine THERIAS Chargée de Recherche HDR, Université Blaise Pascal, Clermont- Ferrand Rapporteur M. Mathew CELINA Directeur de Recherche, Sandia National Laboratories, New Mexico. Rapporteur M. Jorge MEDINA Professeur, CIPP - CIPEM, Université des Andes, Bogota. Examinateur M. Gilles REGNIER Professeur, PIMM, Arts et Métiers ParisTech- Centre de Paris. Examinateur M. Bruno Fayolle Professeur, PIMM, Arts et Métiers ParisTech- Centre de Paris. Examinateur
I want to express my gratitude to Professor Verdu and his wise advices at the right time, to Gilles and Bruno for their great support, their faith in my work and their camaraderie.
Also, I thank my friends for all the moments we shared and all the good memories.
I’m grateful to my family for the joy of life they impressed on me and their constant
encouragement.
OXIDATION OF NANOREINFORCED
POLYOLEFINES
INDEX OF SYMBOLS ... 2
INTRODUCTION ... 4
INTRODUCTION ( in French language) ... 8
CHAPTER I Bibliographic Study ... 12
CHAPTER II: Materials and Methods ... 76
CHAPTER III Clay Nanoreinforced Polypropylene ... 96
CHAPTER IV Clay Nanoreinforced Polyethylene ... 130
GENERAL CONCLUSIONS AND PERSPECTIVES ... 206
2
INDEX OF SYMBOLS
%w Per cent in weigh
2 Scanned angle in X-ray diffraction [°]
d Silicate interlayer space [nm]
d0 Basal space of the clay [nm]
D Diffusion coefficient [m2s-1]
Do Diffusion coefficient of polymer matrix [m2s-1]
Dc Diffusion coefficient of clay nanocomposite [m2s-1]
DO2 Oxygen diffusion coefficient [m2s-1]
DO2 am Oxygen diffusion coefficient of amorphous phase [m2s-1]
L Horizontal dimension of the silicate layer,
half-value of sample thickness [nm, µm]
Mw Weigh average molar mass [kg mol-1]
ME Weigh average molar mass between entanglements [kg mol-1]
Mw 0 Weigh average initial molar mass [kg mol-1]
p Gas partial pressure [Pa]
P Permeability coefficient [m2s-1Pa-1]
PO2 Oxygen permeability coefficient [m2s-1Pa-1]
PO2 am Oxygen permeability coefficient of amorphous phase [m2s-1Pa-1]
3
SO2 Oxygen solubility coefficient [mol l-1Pa-1]
SO2 am Oxygen solubility coefficient of amorphous phase [mol l-1Pa-1]
W Thickness of the silicate layer [nm]
ti Induction time [h]
rs Oxidation rate during stationary state [mol kg-1h-1]
[mol l-1h-1]
Density [kg m-3]
s Chain scission number [mol l-1]
[x] Concentration of the “x” specie [mol kg-1]
[mol l-1]
Xclay Clay mass fraction
Xc by Apparent crystalline ratio
rW Weigh average gyration ratio for a polymer
rWE Weigh average gyration ratio for an entanglement
s Chain scission efficiency factor
Clay aspect ratio, stoichiometric coefficient
Volume fraction of the clay
Tortuosity factor
Stoichiometric coefficient
Stoichiometric coefficient
Parameter depending on chemical structure
and crystallization conditions.
MMT Montmorillonite, volumic fraction of organically
4
INTRODUCTION
Nanocomposite materials are attracting great search for better performing materials with improved thermal, mechanical, electrical and barrier properties. Using polymers as a matrix in this technology is advantageous due to their capability to improve such properties by incorporating nanofiller quantities lower than the 20 % vol required by conventional fillers such as talc, calcium carbonate, and glass fibers. Higher aspect ratios as those provided by clay layers permit stronger superficial contact between MMT-O and polymer justifying nowadays use of such clay as fillers.
Nanocomposites present good properties when they are produced, however the question is: does a clay nanocomposite exhibit a different oxidative behavior compared to those of the pure polymer? Do the improved permeability properties change the material thermo oxidative behavior under used conditions?
In the case of thermo-oxidation (above melting temperature), there are few studies regarding the nanofilled polypropylene and polyethylene aging kinetics, even so all were developed at high temperatures and integrating an empiric approach of study. Since these experimental data
5 was obtained at very high temperatures, such information can not be extrapolated at lower temperatures.
The aging process induced by photo-oxidation in polymer-matrix nanocomposites has been studied by several researchers. Through those studies it was found that the incorporation of nanoclays decreases induction times during UV exposure, meaning that the organically modified montmorillonite (MMT-O) essentially accelerates the oxidation process.
The aim of this work is to study the montmorillonite filler influence over the oxidation process of unstabilized polypropylene and polyethylene at low and moderated temperatures between 60 ºC and 100 ºC by using a non-empiric method of approach to predict lifetime
A dual MMT-O nature will be looked closer in order to understand effects caused by it within the matrix degradation process: first aspect to be considered is the chemical role played by the clay during a simple thermo-oxidation process. At this point two main questions come up:
Do the degradation mechanisms of the pure matrix remain unchanged or they will be affected by the clay presence?
May the clay result an effective catalytic agent during a thermal oxidation process of the polyolefinic matrix?
The second aspect will be related to a clay attribute frequently mentioned in literature as the theory of the tortuous path when nanoclays are present. If nanoclay represents a physical barrier when small gas particles pass through nanocomposite films, does this impediment effect be remarkable when coupled with the thermal oxidation process? Does clay affect
6 heterogeneous thermal oxidation when oxygen diffusion limitations drive the oxidation process?
In order to get an answer to all these questions we tackled the problem from an experimental and a modelling point of view. A great experimental work is performed using independently two different unstabilized polyolefin/coupling agent/clay systems, each case of study will contribute to elucidate different aspects going deeper in the subject of the clay/polyolefin thermo-oxidation: polypropylene/MMT and polyethylene/MMT. At the same time, polypropylene and polyethylene matrix oxidation without filler are examinated.
Computational simulations of the thermo-oxidation process will be a counterpart of the practical observations: they are performed for both systems in homogeneous and heterogeneous conditions (non controlled and controlled by oxygen diffusion) and for the temperature range under study.
To conclude this introduction section, the general text structure is provided. It accounted with a brief description of the content of each chapter, included with the aim to assist and guide the lector when looking for a desired topic.
Chapter I - Bibliographic Study - presents the state of the art of the thermal oxidation of clay
nanoreinforced polyolefins. This compilation comprehends relevant aspects regarding nanocomposite composition and morphological characterization as well as the main features concerning the study of long term properties of polymer materials.
7
Chapter II - Materials and experimental Methods – provides a detailed description of raw
materials, sample preparation and test conditions used for each experimental procedure performed in this work. Such information is stratified going from a small matter-scale to a macro scale: experimental procedures corresponding to the molecular scale are first presented, secondly those regarding morphologic and macroscopic scale.
Chapter III – Clay Nanoreinforced Polypropylene – corresponds to the study of the
thermo-oxidation behavior of the montmorillonite / polypropylene system. This first case permits put in evidence main effects of the clay presence in the polyolefinic matrix. A kinetic study is performed at low and moderated temperatures. Furthermore, effects of oxygen diffusion limitations are explored especially when coupled with the thermal degradation.
Chapter IV – Clay Nanoreinforced Polyethylene – regards the case of study of the /
polyethylene system. This section not only contains a kinetic study of the materials but also goes further into the catalytic effect induced by the clay in order to quantify it. Thanks to the nature of the matrix, the thermal oxidation and the oxygen diffusion phenomena could be independently studied. Additional aspects related to the oxidative degradation such as changes of molecular mass, crystallinity ratio and oxygen permeability changes are studied and linked in order to get to a in-depth analysis of the processes taking place. Finally, the influence of the oxygen diffusion limitations on the oxidation profiles is studied. This study includes simulations of degradation profiles using our diffusion limited oxidation modeling.
8
INTRODUCTION
Les matériaux nanocomposites suscitent un intérêt grandissant grâce aux améliorations qu’ils apportent sur de nombreuses propriétés : propriétés thermiques, mécaniques, électriques ou barrières. L’utilisation de nanocharges dans une matrice polymère apporte de nombreux avantages du au fait qu’il suffit un moindre pourcentage de charge comparativement aux charges classiques (talc, carbonate de calcium, ou fibre de verre) pour améliorer ces propriétés. Les rapports de forme élevés caractérisant les feuillets d’argile permettent en effet d’optimiser la surface de contact entre la charge et la matrice.
Considérant que l’introduction de nanocharges améliore les propriétés des polymères, une question reste posée : quel rôle peut jouer la présence de ces nanocharges quant à la durabilité du nanocomposite comparativement à la matrice seule ? Est-ce-que ces nouvelles propriétés de barrière vont changer le comportement thermo oxydative du matériau sous les conditions d’utilisation?
Dans le cas de la thermo-oxydation quelques études traitent des nanocomposites à matrice polypropylène et polyéthylène mais ils ont été menés à hautes températures (largement
9 supérieures à la température de fusion), ainsi leurs conclusions sont difficilement applicables à des vieillissements à températures modérés et basses.
Le vieillissement photoxydant de nanocomposite a été étudié par quelques équipes dans le monde. Ces études ont montré que l’incorporation de nanocharges à base d’argile conduit à diminuer le temps d’induction au cours d’une irradiation par UV, ce qui indique que la montmorillonite organiquement modifiée (MMT-O) accélère le processus d’oxydation. survenant à des faibles températures.
L’objectif de ce travail est d’étudier l’influence d’une charge de montmorillonite sur l’oxydation du polypropylène et du polyéthylène non stabilisés à basses températures en utilisant une approche non empirique permettant de prédire une durée de vie.
Deux aspects de l’ajout de MMT-O sur la dégradation de la matrice polymère seront abordés dans ce travail. Un premier aspect s’attachera à mettre en évidence le rôle « chimique » joué par la MMT dans le processus d’oxydation. On tentera de répondre aux deux questions suivantes :
Les mécanismes chimiques à l’origine de la dégradation à l’œuvre dans la matrice sont-ils modifiés par la présence de MMT ?
Si oui, la MMT-O peut-elle être considérée comme une catalyseur efficace des réactions d’oxydation dans le cas de la thermo oxydation de polyoléfines ?
Le deuxième aspect que nous étudierons traitera des conséquences bien connues de l’introduction de MMT-O sur les propriétés de transport à l’oxygène (par augmentation de la tortuosité). En effet si les feuillets d’argile réduisent la diffusion d’oxygène, quelles sont les
10 conséquences de cette réduction sur un processus d’oxydation limité par la diffusion d’oxygène ? En d’autres termes, l’introduction de MMT-O va-t-elle modifiée l’hétérogénéité de l’oxydation lorsque celle-ci est contrôlée par la diffusion d’oxygène ?
Pour répondre à ces questions, on se propose de mettre en place une démarche expérimentale et de modélisation. La démarche expérimentale se basera sur l’étude simultanée de deux systèmes polyoléfines/agent de couplage/argile différents. Ces deux systèmes ne présenteront pas de stabilisant pouvant compliquer l’interprétation des résultats. Le premier système est un nanocomposite à matrice polypropylène, le deuxième ayant pour matrice un polyéthylène. A titre comparatif, l’oxydation des matrices seules sera étudiée en parallèle.
Des simulations numériques de la cinétique de thermooxydation seront réalisées sur les deux systèmes en se basant sur une modélisation cinétique homogène d’une part et sur une modélisation cinétique hétérogène d’autre part.
Le présent manuscrit s’articule selon les chapitres suivants :
Le Chapitre I: Etude Bibliographique présente l’état de l’art sur la thermo oxydation des
nanocomposites à matrice polyoléfine. Cette étude comprend différents aspects relatifs aux nano composites comme la caractérisation de l’état de dispersion des nanocharges dans la matrice et une description de notre méthodologie pour prédire la durabilité des polymères lorsqu’ils sont soumis à une oxydation.
Le Chapitre II : Matériaux et méthodes expérimentales décrit en détail les matériaux de
11 Les différentes méthodes sont regroupées par échelle d’observation : de l’échelle moléculaire à l’échelle macroscopique en passant par une échelle morphologique.
Le chapitre III : Nanocomposite à matrice polypropylène - traite de l’influence de
l’incorporation de MMT-O sur l’oxydation du polypropylène. Les cinétiques d’oxydation du nanocomposite et de la matrice seules aux faibles températures d’exposition sont présentées et simulées par un modèle d’oxydation couplé à la diffusion d’oxygène.
Le Chapitre IV : Nanocomposite à matrice polyéthylène - a pour objet d’étudier l’ajout de MMT-O dans du polyéthylène. Ce chapitre contient non seulement une étude cinétique mais
approfondit aussi l’effet catalytique induit par l’argile. Grâce à une spécificité du polyéthylène par rapport au polypropylène, il nous est permis d’étudier d’une façon indépendante la cinétique d’oxydation en conditions homogènes et hétérogènes (i.e. contrôlée par la diffusion d’oxygène). D’une façon complémentaire, la dégradation oxydante est étudiée au travers de mesures de masses molaires, de taux de cristallinité et de perméabilité à l’oxygène. On s’attachera à établir un lien quantitatif entre toutes ces mesures. Enfin, on mettra en évidence les profils de dégradations au travers de plusieurs techniques, les résultats expérimentaux étant systématiquement simulés en utilisant une modélisation de l’oxydation couplée à la diffusion d’oxygène.
12
Chapter I
Bibliographic Study
Index of Figures _________________________________________________________ 14
Index of Tables _________________________________________________________ 14
Extended Abstract of Chapter I (In French language) _________________________ 15
1. General Aspects of Nanocomposites ______________________________________ 20
1.1 Polypropylene ______________________________________________________ 21 1.2 Polyethylene _______________________________________________________ 22 1.3 Montmorillonite ____________________________________________________ 23 1.4 Nanocomposite Preparation Methods ____________________________________ 25 1.5 Morphology of Nanocomposites ________________________________________ 26 1.6 Characterization of the Nanocomposite Morphology ________________________ 28 1.7 Nanocomposite Properties _____________________________________________ 29 1.7.1 Gas permeability of Clay Nanoreinforced Polyolefins ___________________ 30 1.7.1.1. Semicrystalline Polymers ____________________________________ 30 1.7.1.2. Clay Nanocomposites _______________________________________ 31
13
2. Prediction of the Long Term Behavior ____________________________________ 35
2.1 Lifetime Definition __________________________________________________ 36 2.2 Methodologies to Study Long Term Behavior _____________________________ 36 2.3 Empiric Methods for the Lifetime Prediction ______________________________ 38 2.4 Non Empiric Methods for the Lifetime Prediction __________________________ 44 2.5 Closed Loop Model, CLM _____________________________________________ 48 2.5.1 Initiation Reactions ______________________________________________ 48 2.5.2 Propagation Reactions ____________________________________________ 52 2.5.3 Termination Reactions ____________________________________________ 53 2.6 Applied Kinetic Scheme ______________________________________________ 54 2.7 Heterogeneity Features of the Oxidation Process ___________________________ 56 2.7.1. Intrinsic Heterogeneity __________________________________________ 56 2.7.2. Heterogeneity Limited by the Oxygen Diffusion ______________________ 57
2.8. Phenomenon of Oxygen Diffusion ___________________________________ 58
2.9. Application of the CLM in the Study of the Composite Degradation ________ 61
14
Index of Figures
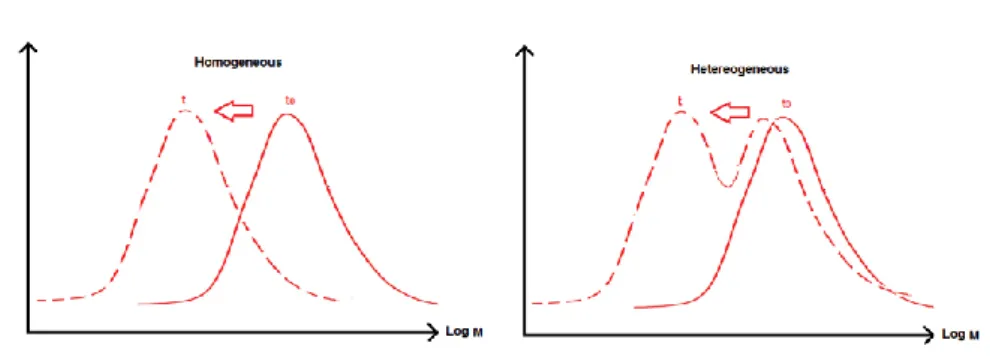
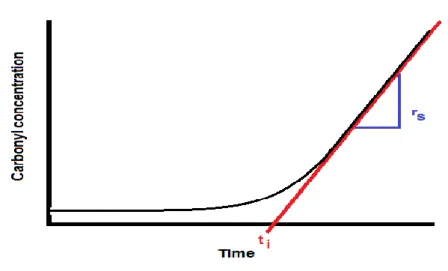
Figure 1 Polypropylene ______________________________________________________ 21 Figure 2 Polyethylene monomer _______________________________________________ 22 Figure 3 Montmorillonite, MMT ______________________________________________ 24 Figure 4 Morphological states in nanocomposites _________________________________ 27 Figure 5 Clay monolayer: basal space ___________________________________________ 28 Figure 6 Scheme of the gas permeability mechanisms in a clay nanocomposite system ____ 32 Figure 7 Schema of the scission on the polypropylene tertiary carbon. _______________ 37 Figure 8 Arrhenius methodology ______________________________________________ 39 Figure 9. Effects of the homogeneous and heterogeneous degradation on mass distribution changes. __________________________________________________________________ 57 Figure 10 Scheme of an autoaccelerated curve of thermal degradation of a polymer ______ 62
Index of Tables
Table 1. Kinetic parameters for polypropylene modeling at 80°C _____________________ 64 Table 2. Parameters for kinetic modeling of polyethylene ___________________________ 65 Table 3 Complete set of kinetic parameters for polyethylene at 100°C _________________ 65
15
Résumé Chapitre I
Etude Bibliographique
Ce chapitre consiste en une revue bibliographique concernant les polyoléfines nano-structurés à base de montmorillonite et les approches permettant de prédire leur comportement aux temps longs lorsqu’ils sont soumis à un vieillissement oxydant.
Apres un bref rappel concernant les polymères de cette présente étude, à savoir le polypropylène et le polyéthylène, on s’attardera à présenter les morphologies de ces matériaux nano composites en insistant plus particulièrement sur les techniques de caractérisation de ces morphologies. Les nano-charges utilisées dans cette étude sont de la famille des argiles disposées sous forme de feuillets (montmorillonite, MMT).
L’enjeu en termes de préparation des nanocomposites est de réaliser des mélanges dans lesquels les feuillets de montmorillonite sont bien séparés et dispersés dans la matrice polymère (intercalés ou exfoliés) de façon à favoriser les interactions avec la matrice polymère, qui est dans notre cas faiblement polaire.
16
Etats morphologiques de dispersion des feuillettes argileuses pour les nanocomposites.
Trois voies sont disponibles pour assurer la meilleure dispersion possible des feuillets à l’échelle nanométrique : la première consiste à préparer le mélange charge-polymère en présence de solvant. S’il est judicieusement choisi, ce dernier doit permettre de favoriser la séparation des feuillets d’argile et la diffusion des chaînes de polymère entre ces feuillets. La deuxième voie consiste, toujours en présence de solvant, de réaliser la polymérisation du polymère en présence des charges. Enfin, la dernière voie et non la moindre d’un point de vue industriel, consiste à mélanger les charges avec le polymère quand celui-ci est porté à l’état fondu. C’est cette dernière voie qui a été choisie pour notre étude.
17 On rappelle ensuite les différentes techniques de caractérisation de l’état de dispersion des feuillets d’argile dans une matrice polymère : diffraction des rayons X et microscopie électronique en transmission.
Les propriétés attendues de ce type de matériau sont rappelées en portant une attention toute particulière sur les conséquences d’ajout de nano-charges sur les propriétés de transport vis-à-vis de gaz comme l’oxygène. On présente les modèles disponibles dans la littérature permettant de prédire l’influence de nano charges sur la perméabilité et donc aussi les coefficients de solubilité et de diffusion. En effet, l’ajout de feuillet à de faibles pourcentages (inférieurs à 10% en masse) doit conduire à une réduction du coefficient de diffusion de gaz comme l’oxygène au travers du nanocomposite. En théorie, cette réduction est liée à un phénomène d’augmentation de la tortuosité de la trajectoire des molécules de gaz dans le polymère entre les feuillets d’argile, ces derniers pouvant être considérés comme imperméable.
Schéma du mécanisme de perméation de gaz dans des nanocomposites à base d’argile.
La deuxième partie de ce chapitre bibliographique appelle les enjeux et les méthodologies mis en place pour prédire le comportement des polymères lorsqu’ils sont soumis à un vieillissement oxydant. La méthode que nous employons ici est résumée : il s’agit d’une
18 méthodologie non empirique qui s’attache à décrire les mécanismes de dégradation qui sont à l’origine des modifications du polymère, à quantifier la cinétique de ces mécanismes et enfin de relier les modifications chimiques de propriétés macroscopiques. Dans le cas de nos matrices polyoléfines semi-cristallines, on s’intéressera plus particulièrement aux conséquences du phénomène de coupure de chaine induit par l’oxydation sur la morphologie cristalline (phénomène de « chimie-cristallisation »).
Sachant que les mécanismes d’oxydation du polypropylène et du polyéthylène ont font l’objet de nombreux travaux, on rappelle ici le modèle cinétique développée par notre équipe et les hypothèses qui y sont associées (homogénéité à petites échelles permettant l’utilisation de la cinétique chimique par exemple).Ce modèle est basé sur un schéma en boucle fermée comme suit : P POOH 2 k1u (Ia) 2 2POOH P PO k1b (Ib) 2 2 PO O P k 2 (II) P POOH PH PO2 k 3 (III) products Inactive P P k 4 (IV) products Inactive PO P 2 k 5 (V) products Inactive PO PO2 2 k 6 (VI)
Les phénomènes à l’origine d’hétérogénéité de l’oxydation sont présentés en insistant sur le cas où l’oxydation est limitée par la diffusion d’oxygène. En effet dans ce cas, la cinétique
19 d’oxydation est contrôlée par la cinétique d’apport d’oxygène depuis la surface de l’échantillon si ce dernier est suffisamment épais. Ce contrôle se manifeste alors par l’apparition de gradient d’oxydation dans l’épaisseur de l’échantillon. Pour modéliser ce phénomène, on se basera sur un modèle couplant oxydation et diffusion dont chacun des paramètres seront identifiés d’une façon indépendante par méthode inverse.
20
Chapter I
Bibliographic Study
This chapter represents a compilation of the available information regarding the different aspects involved in a thermo-oxidation process and the methods used with traditional materials attempting to predict the aging process and the lifetime under different conditions.
In addition, different techniques and approaches used nowadays for the study of the thermal behavior of clay nanocomposite materials are also presented.
Finally, this background includes other implicit aspects such as the nature of the nanocomposites, their preparation process and their morphologic characterization.
1. General Aspects of Nanocomposites
In view of the differed properties and performance that nanocomposites show under specific environments and conditions, their activity is highly studied in the research field.
Nanocomposite materials are fabricated by mixing a small quantity of nano filler with a matrix. In the case of a polyolefin matrix, several filler materials can be used as aggregates: calcium carbonate, carbon nanofibers, aluminum and zinc containing isobutyl silsesquioxanes (POSS), graphite nanoflakes, carboxilate alumoxane nanoparticles, synthetic clay fibers such
21 as fluorohectorite, short glass fibers, hydrotalcite, rhodamine B, talc, mica and clays [1,2,3,4,5,6,7,8].
Conventional polymer composites are filled with a high load of 20- 40% w in order to improve their properties, but also resulting in a weight increase. On the other hand, nanocomposites need much lower amounts of filler to reach remarkable improvements in their behavior. For instance, the load of a clay nanocomposite oscillates between 5 to 10%w with barely noticeable weight increase [9,10].
A great sort of polymers can be used as a matrix: vinyl polymers as methyl methacrylate, methyl methacrylate copolymers, acrylates, selective polymers such as PVC and ethyl vinyl alcohol copolymers; condensation polymers such as the nylon 66, polycarbonates, polybutadiene, epoxy polymer resins, and polyurethanes. Finally, the polyolefin family has as main exponents the polyethylene (PE) and polypropylene (PP), which are the materials used in the present study [11].
1.1 Polypropylene
The polypropylene (PP) is a vinyl polymer constituted by carbon and hydrogen molecules. It has the propylene as monomer in which a tertiary hydrogen has been substituted by a methyl group (Figure 1).
22 The polypropylene is a low cost semi crystalline thermoplastic material. PP also shows good mechanical properties especially against fatigue and impact even at high temperatures (generally up to 100°C). Nevertheless, PP is ultraviolet (UV) sensitive and shows fragility under low temperatures. Indeed, due to the tertiary carbon (Figure 1) PP is more sensitive to oxidation process compared to polyethylene. This variety of properties explains why such material is a commodity widely used in diverse applications such as fibers, films, molded parts, liquid containers, geotextiles and reinforcement in asphaltic mixtures and for packaging applications, amongst others [9,12,13,14].
Polypropylene copolymers are also used in industry and they can be obtained by adding a co- monomer to the polymer chain without following a specific order. Such is the random polypropylene- ethylene copolymer case, where the ethylene content varies between 1 and 7%w in order to form an elastomeric phase ethylene – polypropylene flowing on a polypropylene matrix [15].
1.2 Polyethylene
Figure 2 Polyethylene monomer
The polyethylene is another member of the vinyl family (Figure2) and its monomer is the ethylene. This thermoplastic material has not only excellent chemical resistance, good mechanical properties and lower density and UV sensitivity than the PP, it also presents good behavior at low temperatures due to its low crystal melting temperature. PE is widely used in
23 industry for several applications such as pipes, cables, toys, communication equipment and packaging [16].
1.3 Montmorillonite
The montmorillonite (MMT) is the kind of clay the most widely used in industry as well as the bentonite and the saponite clays. The size of the clay is a determinant factor of the clay physical-chemical properties. In the montmorillonite case, it presents a very small particle size (less than 2 mm) and a high aspect ratio (between 10 and 1000). Such characteristics added to its high cationic interchange capacity (about 60 and 200 meq / 100g, the highest value in clays), and its specific area (between 60 and 300 m2 / g), make the MMT a good candidate for nanofiller [17].
The montmorillonite is a phyllosilicate since its minimal entity is a layer. Such crystalline lattice is constituted by two tetrahedral silica sheets linked by oxygen molecules to a central octahedral sheet of alumina or magnesia [18]. (Figure 3). This configuration with chemical formula (Si2O5)-2, known as 2:1 or T:O:T ( Tetrahedric: Octahedric: Tetrahedric), corresponds to the main unit of the phyllosilicate and when assembled with equals constitutes a 1nm-thick layer that can be laterally extended from 30 nm to several micrometers larger [19].
The space between two stacks, is filled with water molecules and cations, is called gallery or interlayer. The interaction between cations such as Na+1, Ca+1 and metallic oxides (especially Fe+3) provides an electric charge equilibrium. One last characteristic of a clay is its basal space which comprises the length of a layer plus the length of a gallery [11].
24
Figure 3 Montmorillonite, MMT
The Van der Walls forces keeping the stack structure together are much weaker when compared to those generated by the ions located in the gallery. That is why phyllosilicates present a clear tendency to separate or exfoliate their sheets in a parallel fashion [20].
In order to use clay as a nanofiller, different authors as Shina Ray and Vaia [11,19] advised that the surface of the MMT must be organically modified to reduce surface energy of the clay sheets helping to develop stronger interactions between the phyllosilicate and the non-polar polymer matrix. Indeed, authors such as Okada, Giannelis and Biswas [21,22,23,24] confirmed that more important superficial interactions permit a better dispersion at a nanometric level and homogeneous dispersion of the inorganic phase in the organic (polymeric) domain, resulting in more remarkable improvements in the final properties of the nanocomposite. As an alternative or as a complement to the clay organic modification
(MMT-O) a modified polymer matrix may be used to improve the clay dispersion in the matrix.
25
1.4 Nanocomposite Preparation Methods
The preparation of a nanocomposite can be achieved through three methods [11,18,25,26]:
Intercalation of polymer or pre-polymer from solution, also known as the exfoliation-absorption method: it involves the swelling of the clay in a solvent (such as water, toluene, or chloroform) where the polymer or pre-polymer is soluble. On account of the separation of the clay sheets into the solvent, polymer chains stick onto the gallery and therefore a permanent clay exfoliation takes place. Finally, the solvent is removed and the polymer layered silicate (PLS) structure remains. Despite the usefulness of this method in the production of thin films, it can only be used with certain polymers. For instance, Greenland et al have used PVA [27], Jeon et al used HDPE [28], and Kawasumi et al [29] experimented with liquid crystal. Moreover, it has a high environmental cost related to the solvent removal.
In-situ intercalative polymerization: after swelling the clay in a solvent where the monomer is soluble, polymerization process is initiated by heat or radiation. Therefore, polymer chains are formed into the clay stacks reaching a reinforced PLS structure. The N6/MMT produced by Toyota is the most representative example of clay nanomaterial obtained by this method, which has been thoroughly described by Usuky et al [26].
Melting Intercalation method: this technique involves a mechanical action used to mix the clay with the polymer in molten state in order to obtain either an intercalated or an exfoliated structure. The melting intercalation method does not require any solvent, thus open the possibility to make clay nanocomposites with any polymers that could not be
26 processed by the previously mentioned methods. Nowadays, such method has become standard for the preparation of nanocomposites.
Different preparation methods and experimental conditions generate distinct types of nanocomposite morphology, with several levels of interaction between the components and phases present in the system.
1.5 Morphology of Nanocomposites
In nanocomposites three main different morphological states can be identified [11, 18]: a) Immiscible: this state is characterized by the non-mixture of the clay into the matrix. Two
distinct phases, with equivalent associations to those found in a microcomposite, can be seen. Figure 4 a) illustrates such situation in an immiscible novalac-based cianate ester nanocomposite obtained by Gilman et al [30] by mixing ester resin at high-shear with montmorillonite clay and coupling agent at 150°C.
b) Intercalated: this morphology corresponds to the first step in the separation of the clay stacks towards their segregation into individual clay sheets. In fact, clay presents a finite expansion of its layers allowing some polymer chains to penetrate into the gallery, it results in a well ordered multilayer structure constituted by alternated clay and polymer layers. Figure 4 b) is an example obtained by Vaia et al [19] by using melt state processing in a polystyrene montmorillonite system.
c) Exfoliated: the last step to attain a full separation of the clay stacks in a random but homogeneous distribution at nano and microscopic scale in the polymer matrix is called exfoliation. Extensive polymer chain penetration occurs into the gallery: each clay layer is
27 surrounded by polymer chains permitting high superficial interactions improving material the behavior. To illustrate, Figure 4 c) corresponds to a fully exfoliated clay polystyrene nanocomposite obtained by Doh et al [31] using the in-situ polymerization method.
Figure 4 Morphological states in nanocomposites
Finally, two intermediary states can be seen: the immiscible-intercalate and the intercalate-exfoliated which correspond respectively to the transition state between immiscible and intercalate and between intercalate and exfoliate configurations. Their characteristics are a result of the mixing of the two predominant morphological states from which they are derived. Figures 4 d) and 4 e) exemplify intercalate-exfoliate
28 arrangement for a clay high density polyethylene obtained by Swain et al [32] and for a clay polystyrene nanocomposites by Zhu et al [33], respectively. Such type of morphology is often obtained in of the nanocomposite prepared by using the melt state intercalation method.
1.6 Characterization of the Nanocomposite Morphology
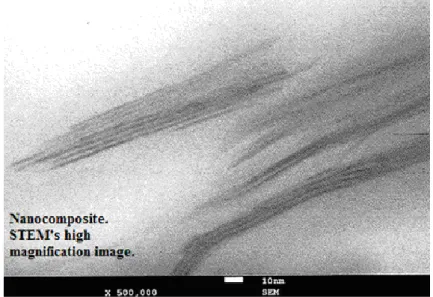
Authors such as Shina Ray et al and Davis et al [11, 34] agreed that at least two methods should be employed to characterize the morphology of nanocomposites: the wide angle x ray diffraction (WAXS) and the transmission electron microscopy (TEM).
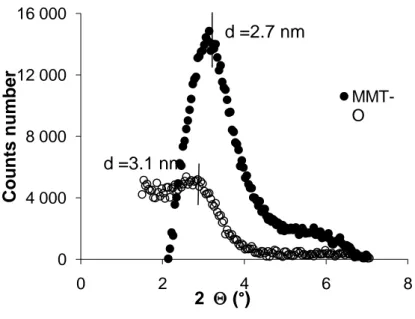
In the WAXS test, the angle 2is scanned between 11.3° and 90° so that the constructive interference caused by the crystalline structures can be detected. Fukushima et al [4] affirmed that it provides a convenient method to determine the interlayer space between silicate layers. Such “d” distance is an indicator of the degree of clay distribution in the matrix. For instance, in an intercalated sample there is an increase of clay–clay space when “d” is bigger than the basal space of the clay (do). Usually, “d” values are ranked between 1-4 nm (Figure 5).
According to Ray et al [11], when the interlayer space after mixture (d) is bigger than 6-7 nm, it can be said that the clay sheets are fully exfoliated.
29 Despite the WAXS test is a good approach to get information on the nanocomposite morphology , it is not a fail proof indicator since it could present the same kind of response for two different morphologies: this occurs because constructive interference neither exists in the immiscible nor in the fully exfoliated cases. For this reason, Morgan et al [35] suggested using a complementary method (TEM) to inspect additional morphology aspects in order to corroborate information provided by WAXS.
The TEM test supplies a quantitative information of the internal distribution of the phases. Information describing size and geometry of the clay sheets is accurate and permits to calculate the aspect ratio of the clay. Besides the geometric description of the filler, it is possible to verify the dispersion degree of the clay into the matrix.
In addition to these two methods, some other tests leading to additional information to characterize different aspects of the nanocomposites [4,11,36]:
The evaluation of the filler thermal stability by Thermal Gravimetric analysis (TGA) [3,34], the crystallization behavior by Differential Scanning Calorimetry (DSC) [37], the stability of the morphologic configuration during small amplitude oscillatory shear experiments of rheology [38], the characterization of the orientation of the clay sheets by Fourier Transform Infra Red (FTIR) [39], Small Angles X-ray Scattering (SAXS) [11,36] and finally the interface structure and mobility by Nuclear Magnetic Resonance (NMR) [40].
1.7 Nanocomposite Properties
Several effects are produced by the clay insertion in polyolefins. However, the most affected properties are the mechanical ones. Several authors [5,19, 24, 32, 41,42,43] reported some
30 other effects in polypropylene and polyethylene-based nanocomposites such as a decrease of thermal expansion, improvements of dimensional stability, higher solvent resistance, enhanced ionic conductivity, flame retardance and reduced gas permeability.
1.7.1 Gas permeability of Clay Nanoreinforced Polyolefins
The permeability of clay nanocomposites depends on several factors. Concerning the clay aspects the filler content and the morphological and chemical aspects like aspect ratio and interaction between filler and permeant are crucial. For the pure polymer and the coupling agent, their crystallinity and initial permeability properties are characteristics to be taken into account. Finally, additional practical aspects such as the ratio filler/coupling agent, the dispersion of the clay pallets relative orientation are also fundamental to better understand and predict the permeability properties of nanocomposites [44,45].
1.7.1.1. Semicrystalline Polymers
In the case of the pure semicrystalline polymer, Compañ et al [46] proposed an expression for the variation of the diffusion coefficient (D) in function of the crystalline ratio (Xc) and the
temperature.
( )* )
exp * ) , ( 2 c am c O X T D AT X D (1)Under the premise that the crystalline phase is impermeable to gas, DO2 is the measured
31 The A coefficient is the amorphous-crystalline phase rate conversion of polyethylene, which
corresponds to the slope in the graph ln D against Xc. For oxygen diffusion at 23°C,
A= -1.7461.
Furthermore, an expression for measured permeability P has been proposed taking into account Xc, A and the permeability of the amorphous face (P ) [46]. am
( )* )
exp * * ) (T Xc Pam AT Xc P (2)Finally, given that the solubility of the amorphous phase (Sam) corresponds the material solubility (S) since the crystalline face is a gas barrier, P may be defined as: am
am am
am D S
P * (3)
1.7.1.2. Clay Nanocomposites
The presence of clay nanoparticles in a polymer matrix changes the permeation mechanisms by increasing the effective path length for diffusion when a permeant traverses the material from one surface to another [22].
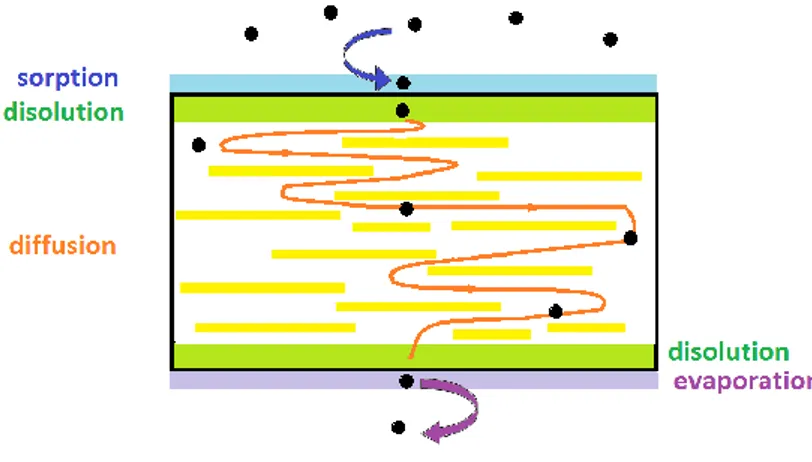
The first step of the permeation – diffusion mechanism is the gas sorption on the sample surface: this stage is barely affected by the clay particles since it is directly related to the chemical interaction between polymer and permeant (which corresponds to the solubility or sorption coefficient, S). Next, permeant particles are dissolved in a thin layer to initiate a molecular diffusion process (described by the Fick’s diffusion law) until their arrival to the
32 opposite dissolution layer in their way out of the sample (Figure 6). It is during the diffusion step that the clay particles play a crucial role in the barrier properties of the material: they act as a physical barrier creating a tortuous path through the polymer matrix, forcing the gas particles to pursuit longer distances than in a non filled matrix [47].
As a result of this steric effect, the small low-molecular weight particles have a restricted mobility and the rate of their mass transfer process is remarkably slowed down especially in the case of oxygen (O2), carbon dioxide (CO2), nitrogen (N2) helium (He) and water
molecules (H2O) [11]. For these molecules, the gas permeability of the nanocomposite can
attain a value between 50 and 500 times lower than that of pure polymer [45].
Figure 6 Scheme of the gas permeability mechanisms in a clay nanocomposite system
In order to illustrate the impact of the montmorillonite clay filler on real nanocomposites some examples are presented: in nanocomposites having a polystyrene (PS) matrix, permeability improvements of approximately 18% to 35% were found [48]. Similar results were reported for poly-ester systems charged at 2%w and 15%w of montmorillonite reaching respectively 20% and 58% of permeability decrease [49]. Finally, for a poly
(ethylene-33 terephtalate) (PET) system with 2%w of montmorillonite, the permeability of the nanocomposite was 34% lower compared to the pure PET matrix [50].
In the case of polypropylene/organically modified montmorillonite/coupling agent systems, oxygen permeability reductions were ranged between 10% and 44% as reported by Golebiewski et al [51], and Mizadeh et al [52]. In the case of the polyethylene/organically modified montmorillonite (4- 5%w clay content) /coupling agent system the decrease of oxygen permeability was between 25% and 50% when compared to the pure matrix [53,54].
In order to describe the effect of nanoclay reinforcement on the permeability properties of polymer materials several models have been proposed: Barrer and Petropoulus presented a model in which regular arrays of clays platelets exist in the matrix and where the permeability properties vary in function of the proportion of the clay content.
Later, Nielsen proposed a semi-empirical model using very thin impermeable rectangular
layers with thickness (W), finite horizontal extension (L) and aspect ratio (
W L
) [45].
Those layers are homogeneously dispersed perpendicularly to the flux of permeant. The solubility coefficient of the composite (Sc) is calculated in function of the solubility
coefficient of the pure polymer (So) and the volume fraction of the clay () (Equation 4).
S0 1
Sc (4)
The diffusion coefficient of the composite (Dc) is calculated as the ratio between the diffusion
coefficient of the pure material (Do) and the tortuosity factor ():
0 D Dc with W L l l 2 1 ' (5)
34 l’ being the path length for the permeant diffusion in presence of filler, and l the path length for diffusion of the permeant in the pure matrix.
As a result, the permeability of the composite (Pc) is related with the permeability of the pure
polymer (Po ) as : W L P P o c 2 1 1 (6)
The Nielsen’s model provides good prediction of the nanocomposite materials permeability properties in the dilute regimen (when the clay has a large aspect ratio and volume fraction lower than 10). Cussler et al [55] proposed a renewed version of Nielsen’s expression which can be used for semi-dilute regimen at volume fractions higher than 10 for systems where the clays presents a low aspect ratio. In this model the clay is represented not by rectangular but by randomly oriented circular layers and the gas permeability is driven not only by the tortuosity factor but also by pore constrictions. Moreover, Cussler’s model includes the aspect ratio term ( when expressing the relationship between the diffusion coefficient of the nanocomposite (Dc) and those of the pure matrix (Do) (Equation 7).
1 2 1 2 1 o c D D (7)
The relationship between the permeability of the nanocomposite and the one of the pure polymer is expressed as:
35 1 2 1 1 2 o c P P (8)
Other models have been proposed by varying the geometry of the filler, distribution and agglomeration of the platelets in the matrix [45]. Nevertheless, for most nanocomposites (mostly under dilute regimen) Nielsen’s equation provides a good description of the experimental results.
2. Prediction of the Long Term Behavior
The progressive changes of the material structure with time are known as aging. Two classes of aging can be distinguished: physical and chemical. In the former, only reversible chemical and physical changes (no permanent modification of the polymer structure) take place. Those changes are classified in three categories: the structural relaxation observed in amorphous polymer, the absorption of solvent and small molecules by the polymer and the loss of additives initially present in the polymer.
On the other hand, the slow and irreversible process of a material structure and properties is known as chemical aging. It alters the material aspect and induce to profound permanent and irreversible changes of the macromolecular structure.
36 When the polymer does not interact with the environment, only anaerobic thermal aging is possible. Otherwise, several mechanisms are present during chemical aging, all of them alter the chemical polymer structure by creating or breaking atomic bonds: hydrolysis (polymer + H2O), thermo-oxidation (polymer + O2 + low to medium temperatures), photo-oxidation (polymer + O2 + UV), and radiolysis (polymer + irradiation) are some examples.
Nonetheless, pursuant to Colin et al [56], despite there are many considerable causes of polymer degradation, temperature deserves particular attention due to its enhancing aging power when coupled to another chemical aging source. Moreover, physical-chemical associations may exist during aging: they are related to stabilizers loss when polymer is in service. In practice physical and chemical aging phenomena often coexist and interact having an impact on the long term behavior.
2.1 Lifetime Definition
Since polymer behavior changes in time as its structure is modified like a degradation consequence, a t parameter is defined in order to determine the moment where the material cannot longer be used. According to Verdu [57], such lifetime can be defined as the time interval between the piece fabrication and the moment when certain property fails to attend the minimal threshold.
2.2 Methodologies to Study Long Term Behavior
Although aging is responsible for the failure of the material, it is not its start that causes the break. Indeed, secondary steps determine the actual moment where aging reaches a critical
37 point. A general cause chain of material fail is schematized to illustrate the steps involved during the process (Scheme 1).
Scheme 1. Cause chain of material failing.
Chemical degradation leads to a molar mass decrease due to a chain scission process that will induce morphological modifications and derive to material endlife.
For instance in polypropylene, chain scission process is associated to carbonyl formation which is the predominant phenomenon during its oxidation (Figure 7):
2 3 2 2 3 2 CH O C CH CH CH O C CH CH
Figure 7 Schema of the scission on the polypropylene tertiary carbon.
Fayolle et al [58] provided evidence to support that the chain scission causes the fall of molar mass, the decrease of molecular weight and a chain length reduction that bring to an easier disentanglement of the polymer chains. Such process induces the chemicrystallization process
38 which involves morphological changes regarding the mobility of the amorphous phase and its integration to the crystalline phase. The thickening of lamella leads to rapidly attain the ductile – brittle transition criteria associated to a critical interlamellar thickness (lc) under
which the material becomes brittle [59]. Physical-chemistry provides a detailed description of the chemical changes occurring during such processes however, it does not take into account kinetic aspects of the failure. In practice fatigue tests studied the kinetics aspects of the failure process through tests basically focus on macroscopic reflex of the material inner configuration [60,61]. Nonetheless, they neglect how and why structure changes during degradation, which is definitely where the origin of such behavior can be found.
Empiric methods have been proposed in the 50’s in order to study the kinetics of the aging process at molecular scale, hence a more accurate prediction of the long term behavior of the materials was latter developed.
2.3 Empiric Methods for the Lifetime Prediction
They are based on accelerated aging tests at temperatures higher than use temperature, so that an equivalent aged state corresponding to the same material but exposed at lower temperature could be faster reached. Prior to experimentation, a property is chosen as critical and a lifetime ending condition is defined. Measurement and control of the property are then performed while material is been aged and a lifetime value is calculated at each experimental temperature using the fail criterion previously established. Next, assuming that material follows the Arrhenius law, an Arrhenius diagram Lntf f
T1 is built to graphically asses39
RT E t T t a f f 0exp (9)where T is the use temperature [K], R is the ideal gas constant [Jmol-1K-1], tf0 is the
pre-exponential factor [same time units than tf], and Ea is the activation energy of the reaction
[Jmol-1]. tf0 and Ea are constants determined from experimental data. Such approach supposes
that the activation energy (Ea) does not vary with temperature and that the aging mechanism is
independent of the exposure temperature. In other words, it is tacitly assumed that material attains an identical final aged state regardless the thermal route it follows, if the other exposure conditions remain unchanged. Le Huy et al [62] illustrated the Arrhenius principle for a “y” property, an endlife criterion “Yi”, at three temperatures T1, T2, T3 and the times t1,
t2, and t3 associated ( Figure 8 a)). Finally, the relation between lifetime and absolute
temperature is deducted by a thermal endurance profile (Figure 8 b)). The graphic is constructed as 1/T in abscise and Ln t in the ordinate.
a) b)
Figure 8 Arrhenius methodology
When using an empirical method it is important to notice that such approach does not provide any information about the origin of the failure. Thus it does not permit to deal with the cause
40 of fail in order to solve the problem. Besides, when using a thermal endurance profile in order to ascertain a lifetime under a determinate condition, extrapolations in logarithmic scale could induce great incertitude when put in linear time scale. As reported by Celina et al [63] non Arrhenius behavior has been observed due to differences of the activation energy for competitive process at different temperatures over a wide temperature range, consequently no linear extrapolation should be done.
Often, due to easy measurements lost weight is selected as the variable to be tracked during exposition at high and even at very high temperatures in order to deduct the kinetic material behavior. Nowadays, several authors apply such methodology to study thermal stability of nanocomposites by using thermo-gravimetric analysis, TGA. However, it has to be noted that
TGA analysis performed at high temperatures is a very controversial method to be used in
order to assess the thermal stability behavior at low temperatures.
Zanetti et al [64] have performed TGA to montmorillonite / ethyl vinyl acetate (EVA) system in oxygen and nitrogen atmospheres at temperatures ranged between 50°C and 550°C. They reported a thermal destabilization effect manifested as an increase of the initial degradation of the nanocomposite which could take place at lower temperatures than for the pure polypropylene. The use of clay speeds up deacylation from 350°C to 338°C and degradation from 470°C to 425°C.
Later, several research groups provided experimental evidence acquired by TGA on thermal stability improvements of polypropylene and polyethylene clay nanocomposites. In order to collect more information, additional parameters were included: not only the temperatures where the main changes started but also those where a 10% weight loss (T10) and the
41 Bertini [65] studied a montmorillonite/ coupling agent/ polypropylene system in temperature range between 50°C and 700°C. He found that under atmosphere air, nanocomposites can reach T10 and Trm under 18°C and 31°C respectively. These temperatures are higher than those
of the pure polymer. Qin et al [66] who studied a montmorillonite/ polypropylene system at 200°C confirmed such tendency reporting temperature degradation improvements between 20°C and 50°C for nanocomposites. Both research groups identify a possible MMT catalytic role at the beginning of polymer decomposition by diminishing the temperature at which weight loss starts compared to the PP pure. For polyethylene systems such as montmorillonite/high density polyethylene and HDPE/ coupling agent studied by Minkova et al [67] it was found that the degradation process of the nanocomposites proceeds by the clay organic modification which degrades at temperatures above 300°C. Also, Lomakin et al [68] described an accelerated formation and decomposition of hydroperoxides during thermal oxidation at temperatures up to 170°C. They associated such effect to a catalytic action of the
MMT-O.
As a consensus, authors attributed thermal stability improvements of nanocomposites to physical effects of silicate layers which play a gas barrier role. However, such barrier effect involves all diffusion phenomena: neither oxidation products go out of the sample nor does environmental oxygen diffuses toward the sample bulk. In other words, increase of decomposition temperature can also be ascribed to the hindered diffusion of volatile decomposition products caused by the clay particles, not necessarily involving a thermal stabilization. Additionally, they associated such stabilizing effect to a degree of clay dispersion in to the matrix.
42 Finally, TGA is also used to deduce individual chemical reactions involved during thermal degradation at high temperatures. Authors such as Lomakin et al [69] have used such approach in order to describe the thermal oxidation of clay polypropylene and clay polyethylene nanocomposites. As a result TGA indicates the evaporation of degradation products, this fact which may be associated to bond breaking. Results can be interpreted either as a multi step process made of independent steps or as a system composed by parallel, competitive or consecutive reactions [70].
According to Opfermann [71], the principle used to develop the kinetic analysis of TGA results supposes that material decomposes according to:
' /liquid gas solid
solid B B
A (10)
The rate expression of a reactant “e”,
dt de
is assumed to be defined by:
T xf e p k dt de , (11)where p is the product concentration, k is a kinetic constant that obeys the Arrhenius law
RT E A k a
exp , A is the frequency factor, Ea is the activation energy and R is the ideal gas
constant.
Nevertheless, knowing that aging is a complex process, using the Arrhenius requires certain precautions [72,73]:
The Arrhenius approach can be reliably used when a process can be described just by an elementary reaction. This is not the case of the chemical ageing where at least three different reactions are involved.
43
The global reaction rate of a complex process (v, is a linear combination of the rate reaction of its sub-reactions: v= v1+v2+….+vn; therefore E of the global reaction is
E=1E1+2E2+……+nEn.
In the case of a complex process such as aging, which results from a succession of several elementary reactions most of them competitive at a given temperature, the Arrhenius law could be reasonably applicable in a temperature domain where the kinetic regimen of the elementary reactions does not change and chiefly, where the competitive relationship between concurrent reactions is not altered by the exposition temperature during testing. In practice, this represents a complex situation since different reaction temperatures have associated different proportion and distribution of aging products.
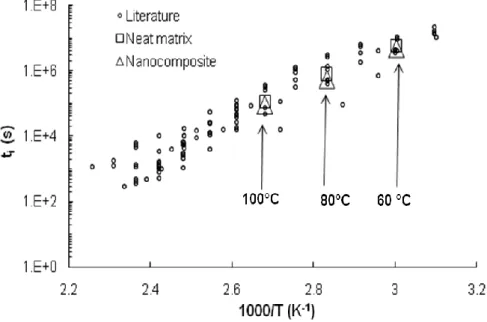
Celina et al [63] compiled experimental data obtained by several authors of thermo-oxidation studies for polymers such as polypropylene (PP), polyethylene (PE), high density polyethylene (HDPE) and some elastomers. They came to the conclusion that in all cases thermo-oxidation behavior presents a curvature indicating a non- Arrhenius behavior above a critical temperature. Such temperature varies for each polymer and evidences changes of kinetic regimen of degradation sub-reactions. When temperature rises thermo-oxidation is globally accelerated, meaning that each sub-reaction is concerned in function of its own activation energy.
Pursuant to thermal studies carried out by Gugumus [74], Richters [75] and Gijsman [76] mentioned by Celina et al [63], different activation energies for pure polypropylene thermal-degradation appear at temperatures above and below 83 2°C. Transition of the thermo-oxidative regimen for polyethylenes was assessed either by thermal analysis of oxygen uptake above their melting point of approximatively 130°C. Such results suggest that not only
44 thermal oxidation itself is concerned when temperature varies but also the oxygen diffusion process. Further experimental information regarding a non- Arrhenius behavior of the oxygen diffusion was provided by Gillen [77] for chlorosulfonated polyethylenes samples and changes in activation energy values were detected when calculated at lower or higher temperatures than 100°C. It suggests that oxygen diffusion phenomena may not follow a linear behavior in a large range of temperatures, hence, thermal degradation may present important deviations of the Arrhenius extrapolation when those two phenomena are coupled.
Those results indicate that a different non-empirical approach must be applied to study thermo-oxidation process, only a methodology based on a detailed kinetic model able to describe the non–Arrhenius behavior may provide realistic information of individual reactions and their temperature dependence.
2.4 Non Empiric Methods for the Lifetime Prediction
Methodology of non empiric study concerns several aspects related to different morphological scales. Scheme 2 presents main steps of the cause chain of material embrittlement which leads to endlife.
45
Scheme 2. Methodology of study of several processes involving different material scales during material embrittlement.
In the 40’s, Bolland [78] proposed the first general kinetic model in order to describe the course of oxidation based on experimental identification of the oxidation products of linoleate thermo-oxidation at low temperatures between 45°C- 75°C.
As a first consideration, the proposed mechanism must fully describe the kinetic characteristics of the oxidation, secondly it ought to provide a complete explanation of the peroxide role and its catalytic action, and finally it should be consistent with experimental information. As a result, an auto-oxidation scheme involving the generation of several ion species, including peroxides, was proposed. The free radical mechanism consists in three steps: initiation, propagation and termination:
46 2 2POOH P or PO (12) 2 2 PO O P (13) POOH P PH PO2 (14) products Inactive P P (15) products Inactive PO P 2 (16) products Inactive PO PO2 2 (17)
Here, the principle of kinetic equivalence is applied in order to describe using the fewest number of representative reactions, a group of sub-stages that independently may not have a remarkable effect on their equivalent reaction.
Such scheme became a useful tool to determine the overall rate of oxidation process and additionally clarify the origin of peroxide molecules during oxidation: their formation is preceded by a radical chain mechanism in which two types of radical are involved.
Even if the Basic Autooxidation Scheme (BAS) had been rapidly diffused to study thermal and photo–oxidation of olefins [79] proposed the first general kinetic model in order to describe the course of oxidation based on experimental identification of the oxidation products of linoleate thermo-oxidation at low temperatures between 45°C- 75°C there was no general consensus on the individual involved reactions.
Different alternatives were proposed in order to solve the BAS without simplifying assumptions regarding the oxygen excess or limitation involving interrelationship between termination constants and the assumption of a long kinetic chain length. Such hypotheses