This manuscript has been reproctuced from the microfilm master. UMI films the text directly from the original or copy submitted. Thus, some thesis and dissertation copies are in typewriter face, while others may be from any type of computer printer.
The quality of this reproduction is dependent upon the quality of the copy submitted. Broken or indistinct print, colored or poor quality illustrations and photographs, print bleedthrough, substandard margins, and improper alignment can adversely affect reproduction.
ln the unlikely event that the author did not send UMI a complete manuscript and there are missing pages, these will be noted. Also, if unauthorized copyright material had to be removed, a note will indicate the deletion.
Oversize materials (e.g., maps, drawings, charts) are reproduced by sectioning the original, beginning at the upper left-hand corner and continuing from left to right in equal sections with small overtaps.
ProQuest Information and Leaming
300 North Zeeb Road, Ann Arbor, Ml 48106-1346 USA
800-521-0600
FACULTÉ D'ÉDUCATION PHYSIQUE ET SPORTIVE DÉPARTEMENT DE KINANTHROPOLOGIE
Effect of Glycerol Hyperhydration Before Exercise in Trained Triathletes on Endurance Perfonnance and Cardiovascular and Thennoregulatory Responses
Eric Goulet Mémoire de maîtrise Directeur de recherche : Membres du comité :
, r---,-.-:--· ., . _.
·1-, -... ; . J c . · / - l f - ; r , SusanLaTit:.D. .
. Cu-c-/ ./ ..__
{,.JJ-.-·~ Doyen de la Faculté : ( Paul Deshaies, Ph.D. Octobre 2001~uilitions and Acquiaitiana et
Bibliographie Services services bibliographiques
3115 wa1111g1a1, Street • . rue '/.Mington
011awa ON K1A ON4 Olaa ON K1A CIN4
canada c.n.da
The author
bas
granted a
non-exclusive licence allowing the
National Library of Canada
to
reproduce,
Joan,
distnbute or sell
copies of this thesis
in
microform,
paper
or electronic formats.
The author retains ownership of the
copyright
in
tbis thesis. Neither the
thesis nor substantial extracts ftom it
may
be
printed or otherwise
reproduced without the author' s
permission.
L'auteur a accordé une licence non
exclusive permettant
àla
Bibliothèque nationale du Canada de
reproduire, prêter, distribuer ou
vendre
des
copies de
cettethèse sous
la
forme de microfiche/~ de
reproduction sur papier ou sur format
électronique.
L'auteur conserve
la
propriété du
droit
d'auteur
qui
protège
cettethèse.
Ni
la
thèse
ni
des extraits substantiels
de celle-ci ne
doivent
être
imprimés
ou autrement reproduits sans son
autorisation.
ACKNOWLEDGEMENTS
Je tiens à remercier mon directeur de mémoire, le professeur Donald Royer, Ph.D., ainsi que les membres de mon comité de recherche, le professeur Pierre Gauthier, Ph.D., et madame Susan Labrecque, médecin, pour avoir soigneusement lu, commenté et critiqué mon mémoire, ainsi que pour avoir pris le temps de répondre à mes multiples questions au meilleur de leur connaissance.
Un énorme merci doit aller au professeur Marcel Nadeau, Ph.D., qui, malgré un horaire très chargé, a su répondre de façon claire et rapide à mes nombreuses questions.
Je remercie sincèrement le professeur François Péronnet, Ph.D., directeur du Département de kinésiologie de l'Université de Montréal, pour m'avoir prêté un télé-thermomètre de haute qualité (et plusieurs sondes), ainsi que Pierre Côté, technicien à la Faculté d'éducation physique et sportive de l'Université de Sherbrooke, pour sa grande implication dans l'étude.
Finalement, je remercie sincèrement tous les sujets qui ont participé à cette étude en voulant bien m'accorder, de façon tout à fait gratuite, 15 heures de leur temps. Sans eux, ce projet n'aurait pu être réalisé. Merci beaucoup.
ABSTRACT
This experimental project determined the effect of glycerol hyperhydration in 4 trained male triathletes on endurance performance and cardiovascular and thennoregulatory responses. For this purpose, the subjects received, using a randomized, double-blind and crossover protocol, either a glycerol (1.2 g glycerol/kg/bodyweight (BW) with 18 ml/kg/BW of aspartame-tlavored juice plus 8 ml/kg/BW of distilled water) or a placebo solution (aspartame-flavored juice and water only) over an 80 min period, 40 min before exercise, then performed 2 h of cycling at 65% of maximal oxygen consumption (V02
max), which was immediately followed by an endurance performance test to exhaustion. Ali trials were conducted at 25 °C, 38-42% relative humidity (RH). During exercise, subjects consumed a 6% sports drink (SD) solution at a rate of 166 ml every 20 min, up to min l 00. Compared to the placebo, glycerol hyperhydration increased fluid retention by 275
±
649 ml before exercise. Additionally, glycerol hyperhydration decreased urine production by 289 ± 174 ml during exercise. Thus, compared to the placebo (1.6% of BW), glycerol hyperhydration (O. 7% of BW) attenuated dehydration during exercise. Sweat volume, heart rate (HR) and perceived exertion were apparently not affected during exercise by the hydrotional advantage provided by glycerol hyperhydration. However, with glycerol hyperhydration, rectal temperatureCRn
was 0.2 ± 0.17 °C lower at the end of exercise. Thus, these preliminary results suggest that glycerol hyperhydration could attenuate dehydration better than water hyperhydration during a cycling exercise at 65% V02 max in a thennoneutral climate, which could improve coretemperature, but not HR. With respect to the endurance performance test, the comparison of the mean of each group reveals that glycerol hyperhydration did not increase time to exhaustion. Individually, however, 2 subjects showed increased times to exhaustion with glycerol hyperhydration. Interestingly, when the results of one subject are eliminated -because of concems over validity -, glycerol hyperhydration would have improved times to exhaustion by an average of 87 sec in the 3 rernaining subjects.
TABLE OF CONTENTS ACKNOWLEDGEMENTS ... 11 ABSTRACT ... III TABLE OF CONTENTS ... IV TABLES LIST ... VI FIGURES LIST ... VI Chapter I INTRODUCTION ... l LITERATURE REVIEW ... 3
EFFECTS OF DEHYDRA TION ON EXERCISE CAPACITY ... 3
PHYSIOLOGICAL EFFECTS OF DEHYDRA TION ... 5
Plasma Volume ... 5
Serum Osmolality and Serum Sodium Concentrations ... 6
Sweat Rate ... 6
Rectal, Tympanic and Esophageal T emperatures ... 6
Heart Rate and Stroke Volume ... 7
Perceived Exertion ... 7
Gastrie Emptying ... 7
Fuel Utilization ... 7
ACSM POSITION ST AND ON EXERCISE AND FLUID REPLACEMENT ... 8
RA TES OF FLUID INGESTION OF ENDURANCE ATHLETES 0URING EXERCISE ... 9
IMPROVING BODY WATER ST A TUS BEF ORE EXERCISE ... 9
GL YCEROL ... 11
Glycerol Studies: Literature Review ... 11
Glycerol Loading ... 17
Commercial Availability of Glycerol ... 17
PROBLEM STATEMENT ... 18
HYPOTfŒSES OF RESEARCH ... 18
IMPORT ANCE OF TfΠSTUDY ... 19
Chapter Il METHODS ... 20
SUBJECTS ... ··· 20
PRELIMINARY TESTING ... 21
Perceived Exertion Scale ... 22
Perceived Thirst Scale ... 22
Abdominal Discornfort Scale ... 22
Height ... 22
Body Surface Area ... 23
Maximal Oxygen Consumption ... 23
Familiarization Trial ... 24
EXPERIMENTAL PROCEDURES .•.•.•.••..•...•..•....•..•.•...•.••...•...•..•...••...•...•...•....•• 24
Chapterffi RESULTS ... 30
HYPERHYDRA TION PERIOD •···•···•···•·•···•···•····••···•····•••••···•··•• 30
EXERCISE PERIOD ...•...••...•...•...•.••..••...•...•...•. 32
ENDURANCE PERFORMANCE TEST··· 36
Chapter IV DISCUSSION ... 38 CONCLUSION ... 48 RECOMMENDA TI ONS ... 48 REFERENCES ... 50 APPENDIX A ... 55
Table 1
TABLES LIST
Summary of glycerol hyperhydration studies
2 Followed procedures from the arrivai at the laboratory to the end of the recovery period, after the endurance perfonnance test
3 Hyperhydration protocol
4 Changes in total body water and urine production over time in the placebo and glycerol trials
5 Individual results of total fluid retention and total volume of urine produced in the placebo and glycerol trials
6 Individual results of final heart rate and rectal temperature at the
Page 12
25
27
30 31completion of the exercise period in the placebo and glycerol trials 34 7 Perceived exertion and perceived thirst values during exercise in the
placebo and glycerol trials
8 Individual results of total urine production and sweat volume during exercise in the placebo and glycerol trials
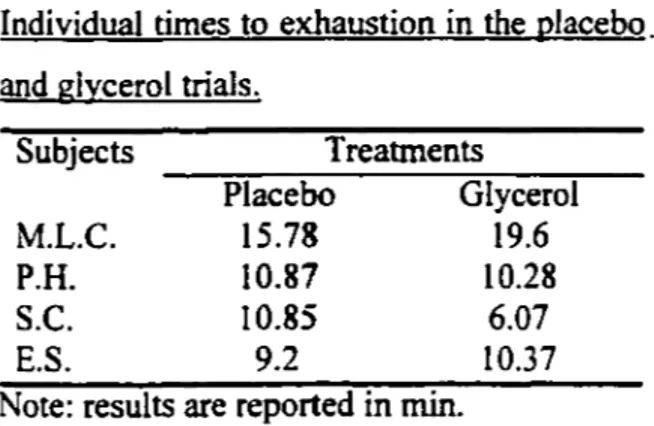
9 Individual times to exhaustion in the placebo and glycerol trials
10 Starting and maximal heart rate and rectal temperature at the completion of the endurance perfonnance test in the placebo and glycerol trials
FIGURES LIST Figure
1 Heart rate and rectal temperature values at 20-min intervals during exercise in the placebo and glycerol trials
2 Times to exhaustion and peak power outputs m the placebo and glycerol trials 35 35 36 37 Page 33 36
INTRODUCTION
It bas been demonstrated that, compared to no or scarce intakes of fluid, maintaining euhydration or minimizing dehydration during prolonged moderate-intensity exercise improves thermoregulation (Barr, Costill & Fink, 1991; McConnel, Burge, Skinner & Hargreaves, 1997; Montain & Coyle, 1992) and better maintains cardiac function (Barr et al., 1991; McConnel et al., 1997; Montain
&
Coyle, 1992) and this, in a warm (> 30 °C) and thermoneutral (21 °C) environment. Of practical importance is that it has been shown, in a warm climate, that dehydration as low as 1.8% of BW impaired performance during a high-intensity (- 85% V02 max) cycling time trial (Below, Mora-Rodriguez, Gonzalez-Alonso & Coyle, 1995) and decreased cycling time to exhaustion at 90% V02peak (Walsh, Noakes, Hawley & Dennis, 1994).
To promote adequate hydration during exercise, the American College of Sports Medicine (ACSM) recommends that athletes "consume fluids at a rate sufficient to replace ail the water lost through sweating, or consume the maximal amount that can be tolerated (ACSM, 1996)." Sweat rates in 25-32 °C environments are routinely greater than 1 L/h (Daries, Noakes & Dennis, 2000; Montain & Coyle, 1992; Noakes, 1993; Walsh et al., 1994). When athletes attempt to compensate for such sweat rates they often time report increased symptoms of gastric discomfort (Brouns, Saris & Reher, 1987; Daries et al., 2000), which can be deleterious to exercise capacity (Daries et al., 2000; Robinson et al., 1995). Therefore, data from field investigations demonstrate that endurance athletes drink conservatively during exercise. In fact, Noakes (1993) reported that actual rates of intake of fluid of endurance athletes during exercise vary considerably but are seldom more than 500 ml/h. Consequently, because sweat rates are higher than fluid consumption, athletes develop dehydration during prolonged exercise.
As a result of their recommendation to replace sweat losses as closely as possible during exercise, the ACSM (1996) advocates that athletes begin any exercises in an euhydrated condition. But, because endurance athletes do not fully replace their losses of sweat
during exercise, it raises a question as to whether pre-exercise hyperhydration, which, compared to pre-exercise euhydration, would prevent or delay the development of hypohydration, be more appropriate in this situation?
When athletes dranlc enough fluid during exercise to compensate for their sweat tosses, it has been shown that pre-exercise hyperhydration with water offered no cardiovascular or thennoregulatory advantage over pre-exercise euhydration (Latzka et al., 1997). However, water hyperhydration has been reported to reduce, compared to pre-exercise euhydration, RT (Grucz.a, Szczypaczewska & Kozlowski, 1987; Nadel, Fortney & Wenger, 1980; Nielsen, Hansen, Jorgensen & Nielsen, 1971) and HR (Nadel et al., 1980; Nielsen et al., 1971) during a subsequent bout of exercise in which no fluid was provided. Likewise, Moroff et Bass (1965) have demonstrated that, compared to pre-exercise euhydration with rehydration (1200 ml) during a 90 min walk in the heat, water hyperhydration with rehydration increased sweating rate, and decreased RT and HR. At the end of this exercise period, hyperhydrated athletes had a slight increase in their BW whereas euhydrated athletes had lost 1.2% of their BW. Therefore, water hyperhydration seems advantageous when athletes allow themselves to become dehydrated during exercise.
The efficacy of water hyperhydration in increasing total body water (TBW) and plasma volume is limited because the kidneys are extremely efficient at rapidly getting rid of any fluid ingested in excess. One way to delay urine excretion and, hence, prolong the state of hyperhydration, is to add glycerol to the ingested fluid. Indeed, compared to water hyperhydration, hyperhydrating with glycerol has been demonstrated to enhance TBW by an additional 250-666 ml (Freund et al., 1995; Hitchins et al., 1999; Lyons, Riedesel, Meuli & Chick, 1990; Montner et al., 1996, 1999; Riedesel, Allen, Peake & Al-Qattan, 1987; Seifert, Luetkemeier, Schrage & Coles, 1995; Wendtland, Nethery, D'Acquisito & Thomas, 1997) after 2-2 Yz h when 21-26 ml/kg/BW of fluid with 0.9-1.5 g glycerol/kg/BW have been ingested together. Such a strategy, during exercise, has been demonstrated, compared to water hyperhydration, to reduce HR (Montner et al., 1996, 1999) and RT (Lyons et al., 1990; Seifert et al., 1995), increase sweat rate (Lyons et al.,
1990) and improve exercise capacity (Hitchins et al., 1999; Montner et al., 1996; Seifert et al., 1997). Others, however, have found that glycerol hyperhydration has no effect on HR (Hitchins et al., 1999; Lamb, Lighfoot & Myhal, 1997; Lyons et al., 1990; Seifert et al., 1995; Wendtland et al., 1997), RT (Hitchins et al., 1999; Lamb et al., 1997; Montner et al., 1996; Wendtland et al., 1997), sweat rate (Hitchins et al., 1999; Lamb et al., 1997; Montner et al., 1996; Seifert et al., 1997; Wendtland et al., 1997) and exercise capacity (Lamb et al., 1997).
To our knowledge, no study bas examined the effect of glycerol hyperhydration during a 2 h bike ride at 65% V02 max in a thermoneutral environment, which is immediately
followed by an endurance performance test. Thus, the goals of this study were twofold. First, to determine whether commencing an exercise while hyperhydrated with glycerol, as opposed to hyperhydrated with water, would increase TBW at the onset of exercise and improve thermoregulatory (sweat rate and RT) and cardiovascular (HR) functions during the 2 h cycling period. Second, to determine whether glycerol hyperhydration would enhance endurance performance. It was hypothesized that glycerol hyperhydration would enhance water retenti on and exercise capacity, but not therrnoregulatory and cardiovascular functions.
LITERATURE REVIEW
Effects of Dehydration on Exercise Capacity
Barr et al. in 1991 investigated in 8 subjects the effects of water, saline or no fluid consumption during prolonged cycling conducted at 55% V02 max for 6 h in a heat chamber maintained at 30 °C. In the water and saline trials (25 millimoles [mrnol]/L), enough fluid was ingested to maintain urine, respiratory and sweat losses, whereas in the no fluid trial no fluid was consumed. In the non-fluid trial, HR, RT, plasma sodium, plasma aldosterone and ratings of perceived exertion were ail significantly higher than in the saline and water trials. Plasma volume was lower in the non-fluid trial compared to the saline and water trials. On average, participants in the non-fluid trial terminated the exercise trials 1.5 h sooner than they did during the saline and water trials.
Mudambo, Leese et Rennie in 1997 examined whether ingesting water atone, or dextrose with electrolytes, or fructose with corn solids at a rate of 400 ml every 20 min would reduce the perceived exertion associated with 16 km (or 3 h) of walking and running in the heat compared with the one perceived during exercise with no fluid intake. When compared to water ingestion during exercise, it was demonstrated in the no fluid ingestion trial that body mass, urine volume and plasma volume ail decreased, whereas perceived exertion, plasma sodium concentration, and plasma osmolality concentration increased. It was also mentioned that one-third of male soldiers could not complete the 3 h walk/run exercise task in the heat when they did not receive fluids, whereas ail soldiers easily completed the physical work when fluids were provided.
McConnell et al. in 1997 studied 7 trained men who exercised for 2 h at 69% V02 peak
while receiving in a first trial no fluid, in the second trial enough fluid to maintain sweat lasses, whereas in a third trial 50% of the volume received during the second trial was ingested. Immediately after the rides of 2 h, subjects rode to exhaustion at about 90% V02 peak. After the 2 h rides, weight loss, HR, and core temperature were highest when the men received no fluid, lowest when they matched sweat tosses, and interrnediate with 50% fluid replacement. Times to exhaustion were 171 ± 75, 248 ± 107 and 328 ± 93 sec for no fluid, intermediate fluid and complete fluid replacement, respectively. Probably because of the low number of subjects, which reduced the statistical power, only the two extremes differed significantly.
Walsh et al. in 1994 studied 6 trained cyclists who had to complete two 60 min exercise trials in the heat at 70% V02 peak followed with a time trial to exhaustion at 90% V02
peak. In one trial no fluid was ingested white in the other trial subjects ingested a total of 1 Lof saline solution during the first 50 min of exercise: 400 ml immediately before the start of the exercise period and subsequently 120 ml every 10 min. During the 60 min rides at 70% V02 peak, subjects lost an average of 1.8% of BW when they received no fluid, but only 0.2% of BW when fluid was provided. When dehydration was minimized by fluid consumption, subjects cycled for 9.8 ± 3.9 min. Conversely, with dehydration of only 1.8% of BW, subjects were only able to perform 6.8 ± 3 min of exercise, which was
significantly lower than the fluid trial. Despite the significant improvement provided by fluid consumption on riding times to exhaustion at 90% V02 peak compared to the ingestion of no fluid, there were no measurable differences between trials for HR, RT and plasma volume. However, the perceived exertion was higher during the no fluid trial.
In summary, the evidence provided by the above briefly summarized studies strongly indicate that the proper ingestion of fluid - as close as hourly sweat lasses - during endurance exercise enhances endurance and bouts of intense exercise that follow endurance exercise.
Physiological Effects of Dehydration
The physiological effects of dehydration have, most of the time, been studied by comparing the physiological responses of athletes when they ingest no fluid with when they only replace in part sweat losses or when they completely replace sweat losses. In
the following paragraphs will be briefly reviewed the effects of exercise-induced dehydration on physiological parameters such as plasma volume, serum osmolality and serum sodium concentrations, sweat rate, rectal, tympanic and esophageal temperatures, HR and stroke volume, perceived exertion, gastric emptying and fuel utilization.
Plasma Volume
As progressive dehydration takes place during exercise, plasma volume gets progressively reduced in direct proportion to the amount and type of fluid ingested during exercise (Noakes, 1993). The inability to maintain plasma volume diminishes venous retum and, therefore, stroke volume (Epstein & Armstrong, 1999). As a result of this decrease in venous retum and stroke volume, cardiac output will be reduced. Consequently, to compensate for the decrease in stroke volume, HR at a given work output will increase in order to maintain cardiac output, which may negatively affect endurance performance (Epstein & Armstrong, 1999). But, most important of all, if dehydration persists and blood volume continues to decrease, the viscosity of the blood will augment - thus increasing the work of the heart - and skin blood flow will be
reduced, which may impair the ability of the body to dissipate heat (Epstein & Armstrong, 1999). Hence, athletes will be at increased risk for heat injury, and without any doubt, endurance will be affected (ACSM, 1996).
Serum Osmolality and Serum Sodium Concentrations
Serum osmolality steadily rises when no fluid is ingested during exercise and this rise is attenuated when fluid is ingested and is least when the quantity of fluid ingested during exercise matches sweat losses (Noakes, 1993). Changes in serum sodium concentrations parallel changes in serum osmolality as the serum sodium concentration is the major determinant of the serum osmolality (Noakes, 1993). Noakes (1993) suggests that the rise in serum osmolality and serum sodium concentration correlates with the rise in esophageal temperature and may be the stimulus for the reduced sweating rate that develops at high levels of dehydration. Accordingly, it suggests that the goal of fluid ingestion during exercise rnight be to prevent changes (increases) in serum osmolality and serum sodium concentrations.
Sweat Rate
Sorne studies have demonstrated that sweat rates fait with an increase in levels of dehydration (Noakes, 1993), whereas others have failed to reproduce these results (Barr et al., 1991; Montain & Coyle, 1992; Noakes, 1993). As a result, it appears that the individual responses to dehydration regarding sweat rates are highly variable.
Rectal, Tympanic and Esophageal T emperatures
The rise in rectal, tympanic and esophageal temperatures is attenuated by fluid ingestion during exercise. This rise seems reduced in direct proportion to the amount of fluid ingested during exercise and is least when the rate of fluid ingestion approximates sweat losses (Barr et al., 1991; McConnel et al., 1997; Montain & Coyle, 1992; Noakes, 1993). Many studies indicate that levels of dehydration of up to 5% usually increase RT by less than l °C (Noakes, 1993).
Heart Rate and Stroke Volume
Heart rate increases and stroke volume decreases in proportion to the accumulated deficit of fluid during an exercise bout (McConnel et al., 1997; Montain & Coyle, 1992; Noakes, 1993). As a result, athletes are encouraged to try to maintain euhydration during exercise in order to maintain HR and stroke volume, which in return will help to preserve cardiac output, blood pressure, muscle blood flow and cutaneous blood flow.
Perceived Exertion
Perceived exertion at a given exercise intensity increases in proportion to the percentage of dehydration (fluid deficit) (Barr et al., 1991; Montain & Coyle, 1992; Mudambo et al.,
1997; Noakes, 1993; Walsh et al., 1994)
Gastrie Emptying
Neufer, Young et Sawka in 1989 investigated the effects of acute heat stress, heat acclimatization and hypohydration on the gastric emptying rates of water during trcadmill exercise conducted in neutral, warm and hot environments at 50% V02 max. The following observations were made by the authors: a) exercise in a hot environrnent impairs gastric emptying rates as compared to exercising in a neutral climate; b) exercise in a warm environrnent does not significantly reduce gastric emptying rates either before or after heat acclimatization and; c) exercise in a warm environrnent when hypohydrated reduces gastric emptying rates and stomach secretion.
Fuel Utilization
Hargreaves, Dillo, Angus et F ebbraio in 1996 compared glycogen utilization during 120 min of cycling exercise conducted at 65% V02 max when subjects were either hydrated sufficiently to maintain BW or dehydrated as a result of receiving no fluid during the exercise period. Compared to the maintenance of euhydration, when no fluid was provided HR and RT increased, and an increased reliance on carbohydrate (CHO) oxidation was suggested by an increase in muscle glycogen utilization (380 vs 318
mmol/kg muscle dry weight), significantly higher lactate levels at 30 and 120
min
of exercise, and fmally a small, but nonetheless significant increase in respiratory exchange ratio at 60 and 120min.
Mudambo et al. in 1997 who studied male soldiers during exercise bouts consisting of walking and running for 16 km ( or 3 h) with no fluid as well as with fluid found a significant decrease in blood glucose when subjects consumed no fluid. The final value for those who ingested no fluid during exercise was about 2.5 mmol/L, whereas when water was provided the final value was close to 4 mmol/L. A lower blood glucose level between exercise tasks of the same duration and length would be consistent with an increase utilization of CHO during exercise.
Current evidence provided by the short review made above on the physiological effects of dehydration indicate that adequate fluid ingestion during exercise attenuates the fall in plasma volume, stroke volume, cardiac output, cutaneous blood flow, and helps maintain
HR.
serum osmolality and serum sodium concentrations, rectal, tympanic and esophageal temperatures, gastric emptying, proper fuel utilization and perception of effort.ACSM Position Stand on Exercise and Fluid Replacement
As a result of the above investigations that demonstrated the many benefits associated with sound water ingestion during exercise, endurance athletes, since the past 25 years, have been highly sensitized and educated about the indisputable importance of maintaining proper hydration before, during exercise and even after exercise. In that respect, and very recently, that is in 1996, the ACSM has written a position stand on exercise and fluid replacement, which strongly emphasizes the importance of proper hydration. Based on the available evidence known in 1996, this organization made the following general recommendations concerning proper hydration strategies before and during exercise for athletes as well as race organizers. Only the recomrnendations relevant to this particular study are reported.
1. T o promote adequate hydration be fore exercise as well as providing enough time to excrete excessive fluid, athletes should ingest 500 ml of fluid approximately 2 h before exercise;
2. During exercise, athletes are encouraged to consume as much fluid as they can tolerate, or ingest fluid at rates that matches their hourly sweat tosses.
Rates of Fluid Ingestion of Endurance Athletes During Exercise
Though many efforts have been undertaken by many goveming authorities to promote intelligent fluid consumption during exercise, still today, most endurance athletes drink insufficient volumes of fluid to offset sweat losses (Adolph, 194 7; Noakes, 1993). In fact, the rates of fluid intake of endurance athletes during exercise may vary considerably but are seldom more than 500 mlJlt, and in ideal conditions 800 ml/h (Noakes, 1993). On the other hand, sweat rates in 25-32 °C environments are routinely greater than 1 L/h (Daries, Noakes & Dennis, 2000; Montain & Coyle, 1992; Noakes, 1993; Walsh et al., 1994). The primary reason for this reduced fluid intake during exercise is thought to originate from the fact that athletes often experience sensations of stomach fullness or abdominal discomforts when they try to ingest too much fluid (Brouns et al., 1987; Noakes, 1993). When Noakes (1993) closely examined 30 studies pertaining to running, triathlon and cycling races of different distances, he noted the remarkable constancy of the 2-3 kg of BW loss experienced by athletes who practice these prolonged exercises. "It is as if total weight Ioss during exercise is a regulated variable", he says. This weight loss represents a fluid deficit of - 2 to 3 L and corresponds for a 70 kg athlete to a percentage of dehydration equaling 3 to 4% of BW. As demonstrated before, a deficit of BW of only
1.8%, which corresponds for a 70 kg athlete to a loss of 1.3 L of fluid, is detrimental to physical performance.
Improving Body Water Status Before Exercise
To avoid, attenuate or delay the detrimental effects of dehydration during endurance exercise, athletes appear to benefit from water hyperhydration before exercise (ACSM, 1996). In fact, compared to pre-exercise euhydration, it has been shown that pre-exercise
hyperhydration with water decreased core temperature (Grucza et al., 1987; Moroff & Bass, 1965; Nadel et al., 1980; Nielsen et al., 1971) and HR (Moroff & Bass, 1965; Nadel et al., 1980; Nielsen et al., 1971 ), and increased sweat rate (Moroff & Bass, 1965) during a subsequent bout of exercise. However, the ingestion of plain water before exercise bas the disadvantage to increase urine production by as much as four times that measured without pre-exercise fluid intake (ACSM, 1996; Moroff & Bass, 1965). Thus, many studies have been conducted in an effort to determine the best possible hyperhydration strategies that would help increase, and maintain the increase in, TB W. The main methods have included desmopressin intake (lnder, Swanney, Donald, Prickett & Hellemans, 1998), saline ingestion (Riedesel et al., 1987), SD ingestion (Hitchins et al., 1999; Lamb et al., 1997) and water, SD, saline or juice
+
glycerol ingestion (Freund et al., 1995; Hitchins et al., 1999; Lamb et al., 1997; Lyons et al., 1990; Montner et al.,1996, 1999; Riedesel et al., 1987; Seifert et al., 1995; Wendtland et al., 1997 ). Of ail these methods, it appears that the most practical and efficient way to increase, and maintain the increase in, TBW is through the ingestion of glycerol with water or SD or juice or saline (Galloway, 1999; Robergs & Griffin, 1998). In fact, numerous studies have shown that combining glycerol with aforementioned solutions in specific quantities adjusted to BW reduced urine excretion and enhanced fluid retention by as muchas 250 to 666 ml in a period of 2-2 Yz h, compared to water, saline, juice or SD ingestion alone. As a result of the ability of glycerol hyperhydration to increase TBW by a significant arnount before exercise, dehydration would be delayed, if compared to hyperhydration with water alone, which could improve both physiological functions and exercise capacity (Robergs & Griffm, 1998). Glycerol hyperhydration, compared to water hyperhydration, bas been shown to increase plasma osmolality (Freund et al., 1995; Hitchins et al., 1999; Latzka et al., 1997, 1998; Lyons et al., 1990; Montner et al., 1996, 1999; Seifert et al., 1995; Wendtland et al., 1997), plasma volume (Murray, Eddy, Paul, Seifert & Halaby, 1991), stroke volume (Montner et al., 1999) and sweat rate (Lyons et al., 1990), decrease HR (Montner et al., 1996, 1999) and RT (Lyons et al., 1990; Seifert et al., 1995), prolong cycling time to exhaustion (Montner et al., 1996), and enhance performance during a cycling time trial (Hitchins et al., 1999; Seifert et al., 1995).
Glycerol
Glycerol is a 3-carbon alcohol metabolite that is produced in the human body (Robergs & Griffm, 1998). It is colorless, viscous and very sweet. lt bas an osmotic action (Freund et al., 1995; Goulet, 1998; Murray et al., 1991; Riedesel et al., 1987; Wagner, 1999), is normally well tolerated, efficiently absorbed by the gastrointestinal tract and medically safe at a specified quantity. Compared to water hyperhydration, glycerol hyperhydration increases fluid retention because glycerol is reabsorbed in the distal tubule of the nephron, and the ingested fluid follows by osmosis (Robergs & Griffin, 1998). It is noteworthy mentioning that glycerol only plays a minor role as an energy source during exercise, and as a result, can't be accounted for the increase of performance seen in some studies (Gleeson, Maughan & Greenhaff, 1986; Miller et al., 1983; Montner et al., 1996; Murray et al., 199 l ). The utilization of glycerol is approved by the IOC and USOC (Robergs & Griffm, 1998). Individuals with health disease are strongly encouraged to consult with their family physician before consuming glycerol (Robergs & Griffin, 1998).
Glycerol Studies: Literature Review
The majority of research that bas been conducted conceming the effectiveness of glycerol hydration has focussed on the effect of this substance as a means to induce hyperhydration before exercise. For a complete review along with the major findings -of studies that investigated the effectiveness -of glycerol hyperhydration, readers are referred to table l.
Table 1
Swnmary of glycerol hyperhydration studies.
Reference Subjects Treatments Environment Exercise
# Glycerol/Placebo
Glycerol usage at rest only
Riedesel et 22 Glycerol: either 0.5, 1 or 1.5 g 21°c None al., 1987 glyceroVkg/B W with 21.4
ml/kg/BWof0.1% NaCI. Experiment
(1) Placebo: 21.4 ml/kg/BW of 0.1% NaCl.
Major Findings (compared ta placebo)
•
Water retention: increased by - 40% for the 1 and 1.5 g glyceroVkg/BW trials at 4 h .•
No significant difference in hemoglobin or hematocrit values .Riedesel et 10 Glycerol: l g glyceroVkg/BW with 21°c None al .. 1987 25.7 mVkg/BWof0.1% NaCl.
Experiment Placebo: 25.7 ml/kg/BW of 0.1%
(2) NaCl.
Major Findings (compared ta placebo)
•
Water retention: 430 ml more fluid retained at 2 and 3 h .•
No significant difference in hematocrit values .Freund et al., 11 Glycerol: l.5 g glycerol/LffBW 22.5 °C with None 1995 with 5 ml/LffBW of juice plus 32 41%RH
ml/LffBW of water.
Placebo: 37 ml/LffBW of water.
Major Findings (compared to placebo)
•
Water retention: increased by- 250 and 500 ml after 2 and 3 h, respectively .•
Plasma volume: no significant difference .•
No significant difference in protein concentration, hemoglobin or hematocrit values .Koenigsberg, 7 Glycerol: l. 49 h period: 3.12 g Unknown None Martin, Hlava glyceroVkg/B W with 13.54
& Riedesel1 ml/kg/BW of orange juice plus
1995 34.43 ml/kg/BW of water
glycerol/kg/BW with 25.9
ml/kg/8 W of water.
Placebo: l. 16.66 ml/kg/BW of orange juice plus 34.43 ml/kg/BW of water
2. 8.5 ml/kg/BW of SD with 25.9
ml/kg/BW of water.
Major Findings (compared to placebo)
• Water retention: increased by- 700 ml in both experiments. • No significant difference in hemoglobin or hematocrit values.
Glycerol usage before exercise
Montner et al., 1996 l. 11
2. 7
Glycerol: l. l.2 g glycerol/kg/BW in 20% solution with 26 ml/kg/BW of water 2. 1.2 g glycerol/kg/BW in 20% solution with 26 ml/kg/BW of water with the addition of 3 ml/kg/BW of a 5% CHO solution every 20 min during exercise. Placebo: l. 26 ml/kg/BW of water 2. 26 ml/kg/BW of water with the addition of 3 ml/kg/BW of a 5%CHO solution every 20 min during exerc1se.
Major Findings (compared to placebo)
-25 °C-27% RH Cycle at 60% of maximum workload until exhaustion
• Water retention: increased in experiment 1 by about 666 ml. But no difference in experiment 2. • Heart rate: significantly reduced in both experiments.
• Sweat rate: no significant difference in both experiments.
• Rectal temperature: no significant difference in both experiments. • Perceived exertion: no significant difference in both experiments.
• Time to exhaustion: significantly increased by 21 and 24% in experiments land 2, respectively. • No significant difference in hemoglobin or hematocrit values.
Seifert et al.,
1995
10 Glycerol: 1.5 g glycerol/kg/B W
with 3.3 ml/kg/BW of orange juice plus 21 ml/kg/BW of water.
Unknown 3 x 30 min cycling intervals at 74%
V02 max + 600 pedal revolutions
Placebo: 4.8 ml/kg/BW of orange juice plus 21 ml/kg/BW of water. Major Findings (compared ta placebo)
• Water retention: increased by- 700 ml. • Heart rate: no significant difference. • Sweat rate: no signiticant difference.
• Rectal temperature: significantly decreased by - 0.3 °C. • Increased performance.
• Plasma volume: no significant difference. Latzka et al .• 1998 8 Glycerol: 1.2 g glycerol/kg/lean body mass (LBM) in 3.9 ml/kg/LBM of juice plus 25.2 ml/kg/LBM of water. Placebo: 3.9 ml/kg/LBM of juice plus 25.2 ml/kg/LBM of water. Major Findings (compared ta placebo)
• Water retention: similar.
35 °C-26% RH 1 time trial T readmill run at 55% V02 max to exhaustion
• No significant difference in performance, physiologie or thennoregulatory responses.
Latzka et al.. 8 Glycerol: 1.2 g glycerol/kg/LBM 3
5
°C - 45% 120 min treadmillin 3.9 ml/kg/LBM of juice plus RH run at 45% V02
25.2 ml/kg/LBM of water. max
Placebo: 3.9 ml/kg/LBM of juice plus 25.2 ml/kg/LBM of water. Major Findings (compared ta placebo)
• Water retention: similar.
• No significant difference in physiologie or therrnoregulatory responses. Wendtland et 8 Glycerol 0.8 g glycerol/kg/BW 24 °C -47%
al.. 1997 with 6 ml/kg/BW of orange juice RH plus 18 ml/kg/BW of water.
Placebo: 6.8 ml/kg/BW of orange juice plus 18 ml/kg/B W of water.
9 x 10 min cycling exercise at 65%
V02 max; 8 x 2 min at 80% V02 max
Major Findings (compared to placebo)
• Water retention: increased by- 26%. • Heart rate: no significant difference. • Sweat rate: no significant difference.
• Tympanic and chest temperatures: no significant difference. Hitchins et
al., 1999
8 Glycerol: 1 g glycerol/kg/BW with 22 ml/kg/BW of diluted SD. Placebo: 22 ml/kg/BW of diluted SD.
Major Findings (compared to placebo)
• Water retention: increased by - 600 ml after 2 ~ h. • Heart rate: no significant difference.
• Sweat rate: no significant difference.
• Rectal temperature: no significant difference. • Perceived exertion: no significant difference.
• Endurance performance: significantly increased by 5%. • Plasma volume: no significant difference.
Lamb et al., 13 Glycerol: l.2 g glycerol/kg/BW with 20 ml/kg/BW ofSD.
SD: 20 ml/kg/BW of SD.
Major Findings (compared to placebo)
• Urine volwne: no significant difference. • Heart rate: no significant difference. • Sweat rate: no significant difference.
• Rectal temperature: no significant difference. • Perceived exertion: no significant difference. • Endurance performance: no significant difference. • Plasma volume: no significant difference.
Glycerol usage before and during exercise
Lyons et al., 6 Glycerol: 1 g glycerol/kg/BW with 3.3 ml/kg/BW of orange juice plus
32 °C-60% RH Unknown 42 °C-25% RH 30 min of cycling exercise at fixed intensity + 30 min at individual maximal capacity Cycling to exhaustion at 75% V02 max 90 min treadmill run at 60% V02
21.4 ml/kg/BW of water and 0.1 g glycerol/kg/BW plus 50 ml of water each hour after 2 h.
Placebo: 3.3 ml/kg/BW of orange juice plus 21.4 ml/kg/BW of water and 0.1 g glycerol/kg/BW plus 50 ml of water each hour after 2 h.
Major Findings (compared to placebo)
• Urine volume: decreased by 54% after 4.5 h. • Heart rate: no significant difference.
• Sweat rate: increased significantly.
• Rectal temperature: decreased significantly.
• No significant difference in hemoglobin or hematocrit values. Montner et
al..
19996 Glycerol: 1.2 g glycerol/kg/BW with 26 ml/kg/BW of water before exercise plus 5 ml/kg/BW of 1.5% glycerol in 5% glucose solution every 20 min during exercise. Placebo: 1.2 g water/kg/BW with
26 ml/kg/BW of water before exercise plus 5 ml/kg/BW of a 5% glucose solution every 20 min
during exercise.
Major Findings (compared to placebo)
• Water retention: increased by 600 ml.
• Urine flow rates and free-water clearance: decreased. • Heart rate: significantly decreased during exercise. • Stroke volume: significantly increased during exercise. • Better maintenance of BW during exercise.
23.5 -24.5 °C and 25-27% RH max Exercise was performed on a semi-recumbent cycle ergometer, at an exerc1se intensity of 44% V02max
Glycerol Loading
Athletes should not consume more than 1-1.5 g glycerol/kg/BW (Robergs & Griffin, 1998). No advantage at doses over 1.5 g/kg/BW is found, as the extra glycerol will be excreted in the urine (Riedesel et al., 1987). Going over this threshold or ingesting a solution too quickly has the potential of causing vomiting, nausea, headaches, dizziness, abdominal bloating and light-headedness (Latzka et al., 1997, 1998; Murray et al., 1991). Most studies which examined the effects of glycerol hyperhydration before exercise have used a dose of glycerol and total volume of fluid ingested situated between 0.9 to 1.5 g/kg/BW and 20-26 ml/kg/BW, respectively (Freund et al., 1995; Hitchins et al., 1999; Latzka et al., 1997, 1998; Lyons et al., 1990; Montner et al., 1996, 1999; Seifert et al., 1995; Wendtland et al., 1997). Diminishing the dose below l g glycerol/kg/B W may not be advantageous since it has been shown to significantly increase urine output, when compared to doses of l and 1.5 g glycerol/kg/BW (Riedesel et al., 1987). Two types of protocols are currently being used. The first consists in ingesting the total volume of fluid and glycerol within 30-40 min and then wait for only undertaking the exercise period 30 min (Latzka et al., 1997, 1998) or 2 h later (Hitchins et al., 1999; Lyons et al., 1990). The second asks to ingest a) at min O l g glycerol/kg/BW in a 20% solution and at min 60 0.2 g glycerol/kg/BW in a 4% solution and then; b) 5 ml/kg/BW of water at min 30, 90 and 120 (Montner et al., 1999) or 5 ml/kg/BW at min 30, 45 and 90 (Montner et al., 1996). In the case of Montner et al. ( 1999) the exercise begins at min 120, whereas than in the case of Montner et al. (l 996) the exercise begins 60 min after the last drink bas been taken. Therefore, one may ask which protocol should be utilized? There is no clear answer, as both seem equally effective at reducing the production of urine. Thus, those who easily tolerate high loads of fluid in the stomach might utilize the shorter protocol of ingestion (i.e., 30-40 min), whereas those who are easily disturbed by large fluid volumes might be encouraged to use the longer protocols.
Commercial A vailabilitv of Glvcerol
Three companies currently sell glycerol: TwinLab Glycerol Fuel, InterNutria Sports -Pro Hydrater, and Advanced Kinetics - Glycerate. Ali these products are essentially
composed of 99.5% pure glycerol. And they are available in most American running stores, cycle shops and health stores.
PROBLEM STA TEMENT
This study compared the effect of glycerol hyperhydration with placebo hyperhydration on fluid retention capacity during a protocol of ingestion lasting 110 min. Tuen it determined the effects of these treatments during 2 h of cycling at 65% V02 max on a) urine volume production; b) RT; c) sweat rate; d) HR; e) perceived exertion; f) perceived thirst and; g) abdominal discomfort. Another goal of this study was to determine the effect of glycerol hyperhydration on endurance performance, which was measured immediately after the cycling period with the aid of an incremental test to exhaustion.
HYPOTHESES OF RESEARCH
Hypothesis 1
Fluid retention at the end of the period of hyperhydration with glycerol will be higher than that of the hyperhydration period with the placebo.
Hypothesis 2
Urine volume at the end of the period ofhyperhydration with glycerol will be lower than that of the hyperhydration period with the placebo.
Hypothesis 3
Urine volume production during exercise will not be different between the placebo and glycerol trials.
Hypothesis 4
Core temperature during exercise, as assessed with the RT, will not be different between the placebo and glycerol trials.
Hypotbesis S
Heart rate during exercise will not be different between the placebo and glycerol trials.
Hypotbesis 6
Hypothesis 7
Perceived exertion during exercise will not be different between the placebo and glycerol trials.
Hypothesis 8
Perceived thirst will not be different between the placebo and glycerol trials.
Hypothesis 9
Rating of abdominal discomfort will be higher in the glycerol trial than in the placebo trial.
Hypothesis 10
Tune to attain complete exhaustion - as assessed with the incremental endurance performance test-will be higher in the glycerol trial than in the placebo trial.
IMPORTANCE OF THE STUDY
The iinportance of an adequate fluid ingestion during prolonged exercise is widely recognized: it substantially prolongs the tirne-period during which the endurance capacity is maximized. Ideally, endurance athletes should replace their hourly sweat losses, which are routinely greater than l L in 25-32 °C environments, with an equivalent ingestion of fluid. However, this is rarely achievable because of individual subjective complaints of gastrointestinal distress associated with a high level of fluid intake. As a result, fluid ingestion during exercise is seldom more than 500 mJ/h, which may precipitate the effects of dehydration, hence reducing endurance capacity, physiological functions and increasing the risk for heat injury. Hyperhydrating with water before exercise will retard the onset of hypohydration during exercise. However, the ingestion of plain water only before exercise is far from ideal: the body rapidly excretes this type of fluid through urine, which reduces the effectiveness of this procedure. On the other band, hyperhydration with glycerol ( 1-1.5 g glycerol/kg/B W with 26 ml/kg/B W of fluid) has been demonstrated to increase fluid retention by an additional 250-666 ml after 2-2 Yi h, compared to hyperhydration with water alone. Thus, by its ability to delay or prevent hypohydration, this strategy might thus better maintain endurance capacity and physiological functions during prolonged exercise, by the way decreasing the incidence for heat injury.
CHAPTERII METHODS
Subjects
Four male subjects participated in this experimental project. Ali were healthy, non-smoker trained triathletes who had dedicated, over the past 16 weeks, an average of 15.9
±
2 h (standard deviation [SD]) per week to their training. Their age, weight, height, body surface area, V02 max, peak power output (PPO) and maximal HR were 26.5±
4 years,67.55
±
4.50 kg, 169.85±
5.1 cm, 1.78±
0.1 m2, 4069±
0.33 ml/min, 347.5±
45 watts and 183 ± 11 b/min, respectively. The subjects possessed an average of 3 ± 3.4 years of competition experience and two ofthem participated in World Championships in the year 2000 (i.e., Military World Championship triathlon, Italy, and World Championship duathlon, France) with finishing times within 10% of the race winner. Ali experimental trials took place from rnid-March to mid-April 2001. Hence, subjects were in the heart of their base training (high volume, low intensity regimens). Only one of these subjects had previously induced hyperhydration with the aid of glycerol. Prior to undertaking this study, ail subjects were required to fill a health questionnaire (Appendix a). Subjects participating in this study did it on a voluntary basis and all were fully informed -verbally and in writing - of the procedures and risks associated with this study (Appendix b). Each subject was infonned that he could quit the study at any time, and for whatever reasons. Subjects signed an informed written consent (Appendix c) and the study was approved by the local Research and Ethic Committee of the Faculté d'éducation physique et sportive of the Université de Sherbrooke. This study's deadline with respect to the completion of the experimental trials was set at the mid-April 2001. Our initial goal prior to undertaking this project was to study the effect of glycerol hyperhydration in six highly trained athletes. Therefore, 8 such athletes - all living in the proximity of our laboratory - were personally contacted at the end of September 2000. Six agreed to participate, without any monetary compensation, to this project, and for 4 of them, only in the condition that the project would be conducted in their off-season, that is, for 3 of them, between the mid-October and the end of December 2000,and for the other until the mid-February 2001. Unfortunately, when came the time to begin the study, at the mid-October, unexpected administrative and equipment problems,
ail of which were outside of our control, forced us to postpone the beginning of the study until the first week of March. Therefore, this delay meant that we had to search again for 4 athletes: we took from November 2000 to mid-March 2001 to do it.
In
order to make our quest for athletes successful, we personally contacted athletes that we knew, made publicity in local gyms and in the University's journal and contacted many clubs and asked them to inform their athletes that researchers in Exercise Sciences from the local University were searching for athletes to participate in a study. Despite ail our efforts, out of the approximately 20 potential candidates with whom we spoke, 14 met our selection criteria and, of them, only 2 agreed to participate in the study, the others justifying their decision not to participate either because of a lack of time or because no financial compensation was offered. We nevertheless decided to go ahead with the study knowing that our results would probably further increase our knowledge about glycerol hyperhydration.Preliminary T esting
On their first visit to the laboratory, ail subjects were personally explained the restrictions, and the importance to comply with them, imposed on training, fluid consumption, diet and sleeping hours before both trials. To ensure compliance, subjects were given a memorandum, which meticulously detailed, starting 6 days prior to the first trial, any imposed restrictions (Appendix d). Prior to this first meeting, subjects were sent the health questionnaire as well as a questionnaire on their training habits (Appendix e), which they were asked to fill as best as they could prior to bringing it for the first meeting. The health questionnaire was reviewed by the researcher, and, if certain answers would have raised doubts as to the capacity of the subject to perform the upcoming tests, the latter would have been asked to be thoroughly evaluated by a physician. However, no subject needed such evaluation. After the revision of the health questionnaire, subjects were explained, and familiarized with, the perceived exertion, perceived thirst and abdominal discomfort scales. Tuen, these measures, in the following order, were taken: a) age; b) baseline BW; c) height; d) body surface area; e) the optimal subjects' bike
position (seat and handlebar heights); f) V02 max; g) PPO; h) maximal HR and; i) the load eliciting - 65% V02 max. After the end of the V02 max test, a familiarization phase of 45 min was performed. Prior to leaving the laboratory, each subject was given a white bagel, which had to be eaten 90 min prior to the first trial.
Perceived Exertion Scale
Measured with the Borg scale (Appendix f). Instructions to each subject were given according to the book Perceived Exertion (Noble et al., 1996).
Perceived Thirst Scale
Measured with an arbitrary scale that we developed (Appendix g). Abdominal Discomfort Scale Measured with an arbitrary scale that we developed (Appendix h).
Baseline Bodyweight
Subjects were weighed on a mechanical scale (Detecto, USA), which had a determined reliability of
±
90 g (0.09 kg). Subjects were weighed post void and nude. They were asked to place each foot on precise points on the platform, to look forward, to maintain both harms alongside their body and to keep their knees slightly bent. Subjects were asked to follow this procedure before each time they would be weighed in the future. At each occasion, subjects were weighed three times, and the average of these values in kg was kept.Height
Standing height was read in centimeters, with no shoes and with the arms alongside the body with both feet reunited. The head and the back were in contact with the wall. Subjects were looking forward and took and maintained an inspiration before the measure. A tape was placed on the wall, behind the subjects.
Body Surface Area
The body surface area (m2) was determined using the following formula (Kenney, 1998):
(0.202 (height) 0·725 • (weight) 0·425]
Maximal Oxygen Consumption
At least one week, but no more than two weeks, before the first trial, subjects underwent a measurement of their individual V02 max on a computer controlled, speed independent, cycle ergometer (Ergotine ergometrics er900, Europe) modified with a road handlebar and the athletes' seats and cleat pedals. After a
5
min warm-up period at l 00 watts, subjects rested on the bike for 2 min. Tuen, the test began at a load of l 00 watts for the first 2 min after which the latter was subsequently increased by 30 watts every min. Such a protocol was employed to ensure a test duration of 8-12 min. The test ended either when subjects claimed complete exhaustion or at the exact moment their pedal frequency went under 60 revolutions per min (RPM). Subjects were asked to maintain a pedal frequency of 60-75 RPM throughout the test and were not allowed to stand on the pedals. During the test, subjects breathed through a facial mask (Hans Rudolph, USA) which was connected to an Oxycon (Jaeger, Europe) ergospirometry testing station. The testing station was automatically calibrated - according to the manufacturer's recommendations - at least 20 min after the unit had been switched on. V02 max was considered as the highest V02 value obtained during the test. Attainment of V02 max was validated when subjects met at least 2 of the following 3 criteria: l) a plateau in V02 with increasing exercise intensity; 2) a respiratory exchange ratio equal to, or greater than, l. l and; 3) attainment of at least 90% of the age-predicted maximal heart rate (220-age). Maximal HR was determined by continuous digital readings using a Polar Vantage NV (Polar Electro, USA) heart rate monitor. Peak power output was defined as the last load that was maintained longer than 30 sec. Subjects were allowed 5 min to cool-down after the test.Familiarization Trial
Immediately after having performed the V02 max test, subjects underwent a familiarization trial consisting in 45 min of cycling at - 65% of V02 max. The goal of this familiarization trial was to precisely determine and confinn the training load to
be
employed in the trials (the one which elicited 65% of V02 max) and to familiarize the subjects with the equipment and procedures employedin
this study. Following the cool-down period allowed after the V02 max test, subjects disembarked the bike, toweled themselves dry and then introduced a rectal probe (YSI, USA) 15 cm passed their anal sphincter. Then, they mounted the bike and were immediately instrumented with the facial mask, which was connected to the testing station. They began to pedal at a load corresponding to 55% of their pre-detennined PPO until the stabilization of V02• Tuenthe load was adjusted until the corresponding V02 was at, or close to (within l 00 ml), 65% of V02 max. During the determination of this parameter, which took 10-15 min, subjects were asked to maintain a pedal frequency of 80 RPM. Tuen the facial mask was removed and for the remaining of the exercise period subjects consumed 166 ml of fluid at 20 and 40 min and were asked to rate their perceived exertion, perceived thirst and abdominal discomfort at 18 and 38 min. During the famiiiarization trial a fan was turned on to minimize thennal stress.
Experimental Procedures
Table 2 exposes,
in
chronological order, the procedures that were followed from the arrivai at the laboratory to the end of the recovery period, after the endurance performance test. At weekly intervals, after the completion of the familiarization trial, subjects returned to the laboratory at the same time of the day. Over the study period, subjects continued their usual training, but refrained from any physical activities the day prior to both trials. For the last 48 h prior to the first trial, subjects kept a diet log. Subjects then replicated that diet log prior to the second trial. Likewise, subjects monitored their intake of fluid the day prior, and morning of, the first trial and ingested the same types and quantities of fluid the day prior, and morning of, the second trial. The day before, as well as the morning of each trial, subjects refrained from consuming diuretic substances such as alcohol, tea, coffee, chocolate and cranberry juice. Subjectsdetennined the hour at which they went to bed prior to the first trial and went to bed at the same exact hour prior to the second trial. Whether subjects complied with these demands was verified with a questionnaire (Appendix i).
Table 2
Followed procedures from the arrivai at the laboratory to the end of the recovery period, after the endurance performance test.
ACTIONS
Temperature and RH were measured
Athletes voided their bladder (no sample of urine was taken) Athletes' BW was measured (nude)
Beginning of the hyperbydration period Time (min)
Either glycerol or placebo: 0,40,80
0.4 g glycerol/kg/BW with 6 ml/kg/BW of aspartame-flavored juice (glycerol) or 6 ml/kg/BW of aspartame-flavored juice only (placebo)
Symptoms measurement (Appendixj) 0, 18, 38,
Collection of urine (18, 38, 58, 78 and 110 min only) 58, 78,
Measurement ofBW (110 min only) 110
4 ml/kg/BW of distilled water 20,60
The rectal probe was installed 112
Subjects dressed themselves The fan was opened
The subjects sat quietly on the bike for 4 min 116 A facial mask was installed for the computation of V02
The HR monitor was installed
Abdominal discomfort 118
Perceived thirst Perceived exertion Rectal temperature Heart rate
Temperature and RH were measured
Beginning of the 2 h cycling period at 65% V02 max 120/0
The facial mask was removed 10
Abdominal discomfort 18, 38, 58, Perceived thirst 78, 98, Perceived exertion 118 Rectal temperature Heart rate Gatorade ingestion ( 166 ml at 25 °C) 20, 40, 60, 80, 100
Athletes were toweled dry 120 Collection of urine
Measurement of BW (nude)
Subjects rested on the bike for l min 126
Heart rate
Rectal temperature
Beginning of the endurance performance test 127
Rectal temperature and HR were measured every 3 min until exhaustion
Recovery period
Temperature and RH were measured
Subjects performed a cool-down period of 3-10 min
Subjects were stripped of any experimental equipment
1
Subjects were given a white bagel (after experimental trial l only)
On the day of each trial, subjects reported to the laboratory 90 min after having drunk and eaten 500 ml of water and a white bagel (200 calories), respectively. Consumption of the bagel and the ingestion of water were respectively designed to ensure sufficient energy level prior to the exercise periods and equal hydration prior the hyperhydration periods.
Soon after their arrivai at the laboratory, subjects voided their bladder and were then weighed in the nude. Afterward, to determine any possible side effects associated with the ingestion of the glycerol and placebo solutions, subjects rated on a scale of 1-5 different symptoms. Subjects then began to hyperhydrate. The hyperhydration solutions were given using a randomized, double-blind and crossover experimental design. As shown in table 3, subjects received over a period of 80 min either 18 ml/kg/BW of aspartame-flavored juice (Crystal Light, USA) plus 8 ml/kg/BW of distilled water (placebo treatment) or 18 ml/kg/BW of aspartame-flavored juice in which 1.2 g glycerol (TwinLab, USA)/kg/BW was added plus 8 ml/kg/BW of distilled water (glycerol treatrnent). Each solution was prepared 24-48 h before each trial by an externat researcher. The amount of glycerol incorporated into the 3 drinks was determined with the aid of a graduated syringe based on the fact that one tablespoon ( 15 ml) is the equivalent of 19 g of glycerol. The quantity of fluid in both trials was detennined with the aid of a graduated cylinder.
Table 3
Hyperhydration protocol.
Min 0: 0.4 g glycerol/kg/BW with 6 ml/kg/BW of aspartame-flavored juice (glycerol) or; 6 ml/kg/BW of aspartame-flavoredjuice (placebo)
Min 20: 4 ml/kg/BW of distilled water
Min 40: 0.4 g glycerol/kg/BW with 6 ml/kg/BW of aspartame-flavored juice (glycerol) or; 6 ml/kg/BW of aspartame-flavored juice (placebo)
Min 60: 4 ml/kg/BW of distilled water
Min 80: 0.4 g glycerol/kg/BW with 6 ml/kg/BW of aspartame-flavored juice (glycerol) or; 6 ml/kg/BW of aspartame-flavored juice (placebo)
At 0, 40 and 80 min subjects received either the placebo or glycerol solutions, and then ingested at 20 and 60 min the rernaining fluid, which was distilled water. Both the placebo and glycerol solutions were served at 4 °C and had the same color, taste and texture. The water was served at room temperature, that is at 25 °C. Immediately after having ingested the glycerol or placebo solutions, subjects rinsed their mouth with 50-100
ml of tap warm water (3 7 °C), which was then spat into a sink. The goal of this procedure was to rernove any residual taste of glycerol. Subjects were unable to differentiate whether it was the glycerol or placebo solution they received.
To determine changes in TBW over time during the hyperhydration periods, subjects, immediately after the rating of side effects, urinated in a graduated urinal at 18, 38, 58, 78 and 110 min. Changes in TBW were cornputed by subtracting the accumulated volume of urine produced from the accumulated volume of fluid ingested. Bodyweight was determined at the end of the hyperhydration periods in the nude and post void. Immediately after the measure of BW was taken, subjects inserted a rectal probe 15 cm beyond their anal sphincter with the aid of a water soluble lubricant (HR Lubricating Jelly, USA). They then dressed with cycling shorts, put on their cycling shoes, rnounted the bike and got quickly instrurnented with the facial rnask and an electrode (Polar Electre, USA) on which an electrolyte gel (Signa Gel, Parker Laboratories, USA) was applied to facilitate signal conductivity. The rectal probe was connected to a switch box
(YSI Tele-Thennometer, [model 46 TUC]) and the facial mask linked to the testing station. The switch box was adjusted to the red line before each experimental trial in order to ensure the reliability of the measures. Subjects then rested quietly for 2 min on the bike after which time a measure of abdominal discomfort, perceived thirst, perceived exertion, RT, HR, temperature and RH was taken. The temperature of the laboratory was measured using a conventional mercury bulb thennometer. Relative humidity was determined from data obtained from dry-bulb and wet-bulb temperatures using a psychometric chart.
Subjects began to exercise, exactly 120 min after the beginning of the hyperhydration periods, at an intensity eliciting 66.5 ± 2.69% of V02 max. During the first l O min of the
exercise periods, V02 was continuously recorded and averaged at 60-sec intervals by the Intelli Support software provided with the Oxycon testing station. Throughout the exercise periods subjects maintained a pedal frequency no lower and higher than 80 and 90 RPM, respectively. Subjects were allowed to stand on the pedals for 1-2 min intervals immediately after each collection of measures. During this tirne, the correct placement of the rectal probe was verified. A fan located 2 meters in front of the subjects circulated air at a low velocity. Measures of perceived exertion, perceived thirst and abdominal discomfort were taken at 18, 36, 58, 78, 98 and 118 min followed by HR and RT, 1 min later. Every 20 min, until min 100, subjects ingested 166 ml of SD (Gatorade, USA) concentrated at 6%, which was given at 25 °C to minimize any cooling effect. Subjects were free to stop at any time during exercise to pass urine, except when the next collection of measures was within the next 10 min. Urine was kept for the detennination of sweat volumes and totai volume of urine produced during exercise.
Immediately after the steady state cycling periods, subjects were quickly disconnected from the switch box, dismounted the bike, urinated, removed their cycling shorts and shoes, toweled dry, and were weighed nude. However, the electrode and probe were not removed. This procedure was designed to determine total sweat volumes, which were computed with the following formula: (BW before exercise - (BW after exercise (bladder emptied] - 145 g [the weight of the probe and electrode together])