Science Arts & Métiers (SAM)
is an open access repository that collects the work of Arts et Métiers Institute of
Technology researchers and makes it freely available over the web where possible.
This is an author-deposited version published in: https://sam.ensam.eu Handle ID: .http://hdl.handle.net/10985/6378
To cite this version :
Carole MAUDET-CHARBUILLET, Gwenola BERTOLUCI, Daniel FROELICH - Integrating plastic recycling industries into the automotive supply chain - 2009
Integrating plastic recycling industries into the automotive supply chain
Carole Maudet
Laboratoire MAPIE ENSAM Chambéry, France
Carole.Maudet@chambery.ensam.fr
Gwenola Bertoluci (Corresponding author)
Laboratoire CEPAL ENSIA Massy, France
bertoluci@ensia.fr
Daniel Froelich
Laboratoire MAPIE ENSAM Chambéry, France
daniel.froelich@ensam.eu
Abstract:
Chains for recycling the plastics used in the automotive industry are complex systems just emerging. In this paper we
propose to explain the reasons which have so far prevented these recycling chains from achieving a sufficiently regulated
state to make them reliable partners for automotive manufacturers. On the basis of this, and taking recycling polypropylene
as an example, we propose to use a dynamic flow model of this chain to identify the critical parameters on which achieving
this regulated state depends. The results are at two levels. They establish the major role played by changes in the price of
oil (an uncontrollable element but one where economic pressures are tending to increase its benefiting the development of
these recycling chains) and the necessity for recycling companies to have a flow of quality input sufficient to saturate their
production systems and achieve profitable sales. To achieve these results we intend to explore various solutions. Moreover,
our study has shown that the development of the chain is also suffering from the lack of cooperation between those involved
and the absence of a global vision of the system (which could have been the role of an official eco-organisation if France
had chosen to provide these recycling industries with a body of this type). In our project we have been able to experiment
using our modelling system to fill this gap. It proved to be an effective way of creating around it a multi-participant area in
which exchanges occurred allowing all the parties concerned to understand the aims and requirements of the other
participants and the impact of their own actions. This research has thus resulted in the creation of a multi-party working
group continuing to develop this tool.
1 Introduction
This paper summarises one of the two research projects that we have undertaken in the aim of contributing to the development of the automotive plastics recycling chain and the use of recycled plastics in vehicles. Concerning the use of recycled plastics, our work was carried out within and in partnership with the company Plastic Omnium. It involved developing a new standard for high mechanical performance material, creating a reference procedure and list for the material, producing databases encouraging the ecodesign of products and integrating material recycling skills into project design [1].
In this paper we present the other part of our work which was directed towards measures to be taken to produce the stocks of recycled plastic material needed to satisfy automotive specifications. This work therefore concerned the plastic recycling industries, the rules and limitations concerning their operation and the means required to ensure reliability of the quality and volume of their production at levels meeting the car manufacturers' specifications.
In the first section of this paper we shall set out the reasons why car manufacturers should have stocks of recycled plastic materials available and analyse the technical and organisational capacities of the recycling industries. Examination of this synthesis leads us to state the need to develop industries capable of increasing the throughput and quality of recycled materials. In the second part, we shall show that the complexity of the system studied, the diversity of points of views which have to be satisfied when it functions, and the diversity of indicators to be taken into account to assess its performance all requires the use of a dynamic flow model for analysing it. All also requires the use of such model for having a method aiding decision-making that helps state possible directions for improvement for the various parties concerned. We shall then set out the method of construction and validation of the model produced for the polypropylene recycling chain. The experimental protocol is the subject of the third part in which we explain the use we have made of experimental programmes to define an optimum model for the recycling chain. Analysis of the results obtained occurs in the fourth section where we demonstrate that it is possible for the recycling industry to become financially self-sufficient subject to two important major conditions: the increase in the price of oil and the arrival of additional sources of good quality used PP at the recycling companies. Finally, we conclude by returning to the initial objectives of this study, the responses obtained and the points remaining to be examined for a complete answer.
2 Present practice in France for recycling plastics and using recycled plastics in vehicles
The obligations set out by the ELV directive1 (2000/53/EC [2]) concern both taking preventive action regarding and treating end-of-life products. This position complies with the objective of the European Union which is to encourage industrial companies to manage the materials for their products in closed loops (i.e. reusing recycled material in the application or at least in the original industrial sector). Thus this text requires that:
- vehicles should be 80% recyclable/reusable and 85% recoverable by 2006 (values which must reach 85 and 95% respectively in 2015). The directive requires the effective recycling and recovery levels to be achieved (undertaken by the existing economic operators) and not just theoretical levels. According to the French decree [3], setting up the system composed of economic operators capable of achieving these rates is the responsibility of the car manufacturers (they are particularly required to participate financially in the event of the shredder alone making a loss).
- the proportion of recycled material used should increase.
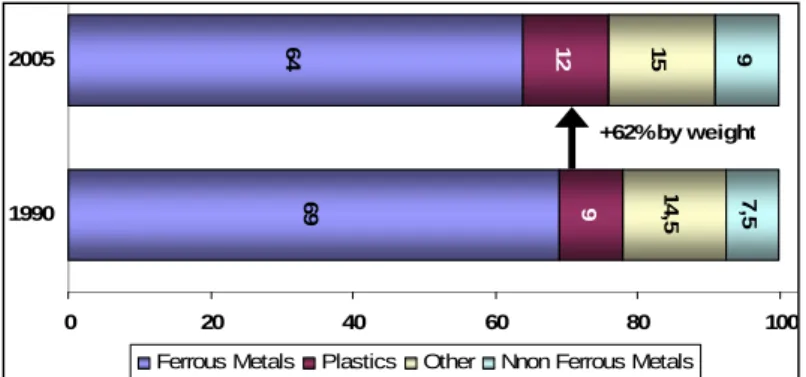
On the throughput of ELVs treated each year in France (i.e. 75% of the annual 1.8 to 1.9 million ELVs), the present effective rate of recycling is about 75%. This value is achieved for present ELVs (i.e. on average 13 years old) containing a high proportion of metal (
Figure 1
). On the other hand, for more recently manufactured vehicles, bearing in mind theproportion of plastic materials (PM) in their construction and of the present way in which the French recycling industry works, the rates would only reach 70% of recycling under these technical economic conditions. The wide range of businesses involved and the lack of traceability in French recycling industries means that in actual fact it is very difficult to assess this effective rate. However, studies have shown that the 25% of material not currently recycled and largely destined for landfill is shredding residue with a high PM content [4, 5]. Indeed, very little plastic material from vehicles is currently retreated in France [6, 7]. Figure 2 shows the main vehicle component retreatment industries which exist in France [8, 9].
Figure 1: Difference between ELV and new vehicle material composition
Plastics represent about 9% of the weight of French vehicles in the case of present ELVs [9] (a figure which can reach up to 16% in vehicles on sale now) and only 4.7% of this weight [10]} seems to be treated in France i.e. on average 0.33% of the weight of vehicles over the whole industry. These rates are incompatible with the overall rate of recycling required. Nevertheless, trial campaigns have shown that if the technical conditions required are in place, 3% of PM in current ELVs can be recycled, a proportion corresponding to the PP part, the most widely used material in vehicles. In new vehicles, this PP proportion can reach 6% [11]. By reconsidering the choice of PM so that only materials compatible with recycling are
used in vehicles (the wide variety of resins present today in shredding granules makes working out limits for sorting residues far too complex), by changing to a single material and improving the technical and economic conditions of the operators and recycling industries, a significant proportion of recycled PM becomes accessible [12, 13]. But this 3% value is still insufficient for achieving the 2015 objectives. Moreover, as recycling metal is already optimised, achieving the directive's objectives must occur by increasing the proportion of PM recycling. The effective recycling of vehicle plastic is therefore a major problem in France (and also in other countries of the European Community even though we are only considering France in this paper).
Figure 2: Main automotive components’ recycling chains (adapted from [8, 9]) Legend : MR=Material Recycling,
SR=Shredder Residue, ER= Energy Recovery, MR= Material Recovery, FM= Ferrous Metals, NFM= Non Ferrous Metals, PP= Polypropylene, PE=Polyethylene, ABS Acrylonitrile butadiene styrene
2.2: The absence of demand in the recycled plastics markets
We have shown in the previous section that in order to achieve the obligatory recycling levels, we must be able to retreat plastics, but that this implies having appropriate technical installations, which is still not the case in France (at least not on the scale required). To encourage recycling industries to develop it is essential to create economically robust outlets for these recycled materials. Indeed, surveys of recycling companies have shown that, for the most part, vehicle plastics specialists still make few demands [6, 14]. Moreover, for the moment, car manufacturers have no particular requirements in terms of integrating recycled PM in their specifications with the exception of Renault which has clearly displayed its willingness to use 50kg of recycled PP in its vehicles before 2015 [15, 16]. Yet increasing the quantity of recycled PM would meet the requirements of the second point of the directive concerning the gradual increase in the proportion of recycled materials in vehicles. Developing new markets presupposes therefore, that automotive suppliers anticipate the demand from the car manufacturers and decide on the recycling channels likely to provide these materials appropriate in both quantity and quality. However, use by automotive automotive suppliers is still limited to applications with low mechanical performance. Several reasons explain this lack of use of recycled plastic in high added value components [1]:
- The poor image of this material compared with virgin material. A product designed in recycled PM is still perceived as a poor quality product. This point is strengthened by the fact that current recycled PMs are essentially produced from a mixture of inputs, the sources of which are often unknown. There is de facto a real problem of traceability, input and uncontrolled quality. The performance of these materials is also generally poor on account of the lack of control over the characteristics of the input.
- Recycled plastic will not open up a new market but must take over a share from virgin material. New materials are produced by a perfectly controlled industrialised process. The industrial structures which manufacture and market these materials provide guarantees and insist on practices very different from those used in recycling.
- The lack of confidence (considering the emerging situation of recycling industries) in the ability of recycling operators to produce materials meeting the specifications of the automotive industry in terms of quality, volume and price: the absence of quantity and regularity in the supply of recycled starting materials. This lack of confidence is increased by a lack of information about the real abilities of operators as regards their technical capacities and financial security.
- The need for materials of quality higher, in terms of performance and consistency of performance, than that of recycled plastic materials currently available. Only if there is a secure supply of these materials will automotive suppliers take the risk of integrating them in designing for plastic vehicle parts, other than for parts under the bonnet and wheel housing which have lower technical requirements. This change is essential to increase on the weight of recycled plastics today used in vehicles (in the order of 20kg per vehicles)
It can therefore be seen that to reach the regulatory thresholds laid down by the ELV directive and a natural equilibrium of the industries concerned, it is essential to increase both the effective recycling of plastics used in vehicles and to increase the proportion of plastics already recycled in these vehicles. Currently it can only be said that this loop has not occurred naturally.
2.3 French industries recovering plastic automotive material
The end-of-life treatment of a vehicle involves a large number of businesses. Figure summarises the activities of these businesses in France.
Figure 3: ELV management
It highlights the two systems for treating ELVs, which are: - dismantling components
In the case of plastic household waste, non-complex products, a single method of treatment is used, namely shredding, while for large WEEE2 and vehicles, complex products, the two systems run in tandem. In fact, there is no regulation – stated for example by the manufacture of the product - which imposes dismantling a component (except in the context of antipollution obligations) or leaving it on the carcass at the time of shredding. Depending on the resources, interests and collection networks available to a given dismantler, he applies the solution which suits him best [17]. If, for example he sells second-hand parts it may be advantageous for him to dismantle more to obtain parts with high resale potential; he would certainly not do this dismantling if he did not resell second-hand parts. Dismantled plastics items, particularly large ones, are important in that they form an appreciable source of pure material (for single material parts) even if this plastic material has lost its mechanical characteristics through ageing [1, 18]. Recycled materials from such a source are therefore controllable in terms of reliability of performance and physical behaviour (retraction, viscosity etc. of materials on injection) over time. On the other hand, none of these treatment routes is currently economically viable for French dismantlers: they cannot obtain sufficient financial reward from the recycling companies for the time taken for dismantling these components. For this reason only a few parts (batteries, a few bumpers) coming from dismantlers reach the recycling companies. The cost of dismantling is therefore charged on second-hand components resold. The absence of a financial incentive and a collecting organisation means that this material does not reach recycling companies.
The other treatment route for plastics involves sorting the residues from shredding. In theory shredding has many advantages since it may be thought that products of different origins could be mixed and shredded together (the dimensions and mechanical characteristics of the hammers of the shredder being what decides whether mixtures of products are compatible). The industrial reality is otherwise, because while shredding poses no major technical difficulty, managing to sort the residue resulting from it is very difficult. In France only one operator claims to be capable of extracting plastics from shredded residues on an industrial scale (Polyolefins, Polystyrenics). Indeed, the greater the diversity of plastics contained in these residues the greater the cost and the lower the efficiency of the sorting techniques.
Consequently, the costs and quality of the materials recycled by these processes have not allowed the use of recycled plastics to really develop in the equipment manufacturing industry for structural parts.
With these restrictions, at present the quality of recycled materials provided by the recycling companies is limited. Firstly, their intake contains almost no vehicle plastic, and secondly, the diversity and quality of their intake and the lack of knowledge of the operators in the formulation3 necessary to bring the material up to standard, means that the output for the moment does not meet the specifications required for materials for manufacturing high technical performance components.
2 WEEE: Waste electrical and electronic equipment
3
An essential step of recycling is formulation, which returns to the material the characteristics required by the specifications on output. The PMs at the end-of-life are old materials with altered properties and it is therefore necessary to
2.4 Summary
There is a real need to encourage development of the flow of recycled vehicle plastics that have technical and economic characteristics sufficiently viable to allow automotive suppliers to design and manufacture structural vehicle parts with demanding mechanical requirements in recycled material. In addition, to arrive at such a result the size of the products and the tooling necessary must be dedicated to applications in recycled materials. Moreover, we have shown that it is possible to reduce the risks associated with variability in the quality of recycled materials by developing compounds of mixed virgin and recycled materials [1] (Figure 4). However this solution does not totally remove the problem of quality, is not
necessarily well accepted by vehicle designers and does not at all affect the problem of the availability of stocks of recycled materials. Supplies must be guaranteed both in quality and quantity. The ability of the French recycling industry to meet these needs is therefore the determining factor and it is currently inadequate. Moreover, the use of recycled materials makes no environmental sense unless it involves materials recycled locally. Also while the low labour costs of certain countries may make industrialists consider the opportunity of obtaining stocks abroad, such a solution would be environmental heresy.
Figure 4: PP recycling and recycled PP use in automotive high performance parts [1]
Encouraging the development of French PM recycling industries therefore appears today to be the decisive factor in promoting a real ecodesign policy for plastic components, particularly of vehicles.
This term development is used here in its straightforward meaning. There are French businesses involved in the process of recycling but
- their activities are not coordinated around specific materials providing stable volumes of output,
- the levels of maturity of these structures (management of traceability, monitoring the quality of throughput, mastery of the skills of resin formulation etc.) are not consistent with the level of quality required to be included on the list of industrial sector suppliers, such as the automotive sector.
In the free market, the law of supply and demand is the regulating principle which leads to emergent systems disappearing or becoming stable and gaining technical and organisational maturity. The case of recycling industries is different in the sense that private businesses are contributing to the provision of a public service, namely, reducing the volume of waste
add additives depending on the properties to be improved to obtain a given quality of PM, even for applications without stress.
material, the energy bill and the consumption of a country's resources. It follows from this particular context that the stakeholders interested in developing these recycling industries are:
- Society who must have the means of appreciating the influence of aids it gives and constraints which it imposes on the various industries (including automotive car manufacturers),
- Car manufacturers, who must be able to establish the real capacities of their new vehicles to satisfy the regulatory requirements, [19]
- Automotive suppliers, who need to know when they can design tooling, with acceptable risks, for mixed compounds, integrate the use of recycled material in their design projects and offer them to car manufacturers who have not asked for them,
- The dismantlers, recycling companies and shredders, who need to identify the actual opportunities of these markets to decide on investments which they could and should make.
The complexity of the situation envisaged is such that only a systemic approach has any sense if we are to be able to suggest action for making changes to it that is positive for all the parties concerned. On this basis, we put forward the hypothesis that using a dynamic model, taking into account the effects of interactions between businesses in the industries, should allow us to determine whether actions can be undertaken to encourage this development, and if so, by whom. We assumed that by modelling an existing recycling chain and measuring the good and bad aspects of its performance, the major causes which prevent this system from moving on from an emerging state to a stable state could be identified. This work and its results are described in the following sections.
3. Modelling to prescribe for the future
3.1 The objective of using a dynamic flow model of throughputs associated with the French recycling industries
A review of the literature that we carried out indicated that four forms of research are usually undertaken to encourage the use of recycled plastics in vehicle construction and associated industries:
- on the products: development of practices, tools, and indicators to allow changes in design [20-22] - on recycling processes [23, 24]
- on the organisational design of recycling industries, without taking into account what becomes of the recycled material and the present technical and economic conditions of those involved [25-27],
- on the technical and economic difficulties specific to one or more businesses in the chain, but not to the whole chain [17, 28]
Integrating recycled PM into design is not taken directly into account, nor is the recycling chain systemically visualised. The latter is essential for measuring the real impact of action taken by the different parties concerned.
However the particular feature of the recycling chains which interest us is that they are made up of independent businesses (dismantlers, shredders and recycling companies) and that while the activity of dismantlers is generally centred on a product type this is not the case for recycling companies. Indeed, a recycling company brings together input from various industrial sources and his activity is centred around the material and not the product. This change in point of view (between dismantler and recycling company) explains why in addition to obvious economic antagonism it is difficult for them to find a natural balance. In other countries this problem has been solved by the creation of eco organisations which manage the adjustments necessary between these businesses [29] (these activities are financially supported by car manufacturers or the state concerned). French car manufacturers did not wish to develop such an organisation and under no circumstances wished to be financially involved in the development of recycling industries.
By modelling the existing recycling chains by dynamic flow our aim was to:
- take into account the systemic dimension essential for analysing the technical and economic behaviour of these industries,
- identify the technical and economic parameters that have a decisive influence on stabilisation of these recycling chains.
3.2 The recycling chain modelled
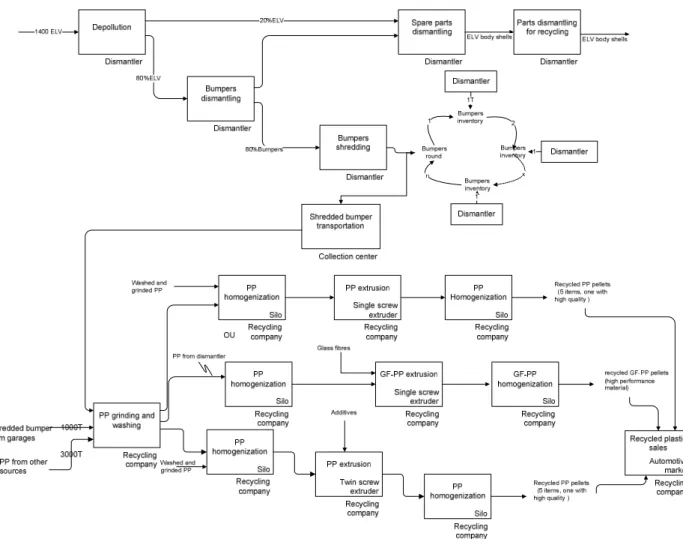
We worked on an industrial chain capable of producing recycled polypropylene (PP) (the most widely used material in vehicles) intended for the automotive industry. The recycling chain has been considered on the scale of a French region. One hypothesis considered is that if throughput of used plastic vehicle parts is homogeneous this should partially or totally resolve the problems of quantity and quality of recycled PM. We modelled an existing recycling chain and established both the consequences on the performance of this chain of providing a new type of input (bumpers) and the additional action to be taken by the different parties concerned to stabilise this aspect of recycling. Bumpers were chosen because of several characteristics specific to them:
- they are the largest plastic component on vehicles and dismantling them is relatively easy;
- some dismantlers already dismantle them to reach other parts to which they block access, but they do not send them for recycling as they do not know of the existence of other businesses further down the chain.
The activities that we have taken into account in this recycling chain are (Figure 5): - Collection of end-of-life vehicles (ELV) and accident damaged vehicles (ADV).
- Dismantler's activities:
- activities directly connected with the demolition (forming part of the recycling chain being studied): depollution of vehicles, dismantling and sale of second-hand spare parts, dismantling of bumpers, sale of carcasses to scrap metal dealers;
- sideline activities indirectly linked to recovery activities: repair and sale of second-hand vehicles and insurance vehicles.
- Shredding and collection of bumpers from dismantlers: shredding performed by dismantlers taking part in the collection of bumpers.
- Recycling companys’ activities: grinding and washing of PP components, homogenizing the material, extrusion/granulation with formulation of the resin.
- Sale of the recycled material to automotive plastic suppliers.
Figure 5: Diagram of the modelled recycling chain: a regional PP recycling chain
It should be noted that at the present time the recycling chain is only a theoretical idea. Indeed, businesses exist in the field: collectors, dismantlers, recycling companies etc. But no stable official link exists between these firms to justify the term recycling chain. The companies know one another – above all within a region - and the flow of material exchanged is most
often in the form of occasional purchases. Trading occupies an important position given the lack of material. Plastic waste materials are sold to the highest bidder and even in numerous situations, exported. This obliges certain recycling companies to import material to obtain throughput, leading to an economically ridiculous and environmentally aberrant situation. To define the characteristics of businesses in our model we selected French businesses with technical and legal capability consistent with the nature of the throughput of material to be treated [30]. Definition of the technical capability mainly concerned the recycling companies and ensured that they had the installations and knowledge necessary to treat PP. Legal capability essentially concerned the dismantlers: we only included those who are ICPE classified4 and Qualicert approved by the manager-distributors who in part manage the collection of ELV. These criteria of choice were used to establish the technical, economic and qualitative characteristics of businesses and of the initial flows in our model [30]. We perfected our model and validated its soundness by comparing its performances with the average values that we collected. In the following paragraph we will return to our definitions of the performance of businesses and the use that we made of them. The model created is so dimensioned to satisfy the needs of waste PP retreatment flows in a French region. All flows are scaled to this.
Construction of the model
To create this model and test our development scenarios we used the program Witness®5.
The stages of treatment carried out by each business are defined by both technical and economic characteristics (
Figure
6
).Figure 6: Synthesis of the flow measured for each model actor
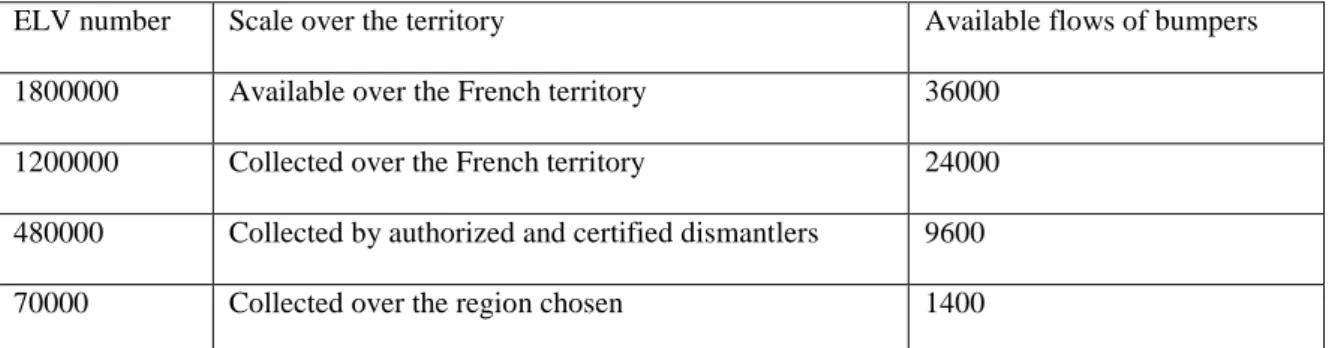
The vehicle dismantler chosen deals with 1400 end-of-life vehicles (ELV) per year before any optimization, i.e. 11 tonnes of bumpers available per year (80% of bumpers are dismantled). The bumpers’ input will represent for the recycling company a flow of high and controlled quality material. In our model, we make the hypothesis that each 1 tonne batches of shredded PP produced by the dismantler is part of a round to 20 dismantlers in order to fill a container of 20 tonnes per round.
The distribution of the flow of ELV over the territory and the capacity of the recycling companies’ treatment installations have shown that around 40 dismantlers are needed to supply the recycling company chosen with bumpers in order to produce a high mechanical performance material (cf. Table 1 and Table 5).
Table 1: Sizing of the available flows of bumpers under specific conditions (data 2004)
The costs of collection by themselves have been taken into account in the sale price of the material between the two businesses. We have chosen to index the sale price of the recycled PP on the price of virgin material and consequently on the cost of oil (this is not yet a current practice for recycling companies).
In the recycling process, the material from bumpers is not mixed with others flows of PP from the recycling of material from other industries because it is used for producing one of seven recycled material items. This item is new and has more stringent characteristics. We have previously tested the technical and economic feasibility of this item [1] and showed that this recycled material could be used at a proportion of 20% (Figure 4) in a mixture with virgin material without the performance of vehicle components being affected, confirming on an industrial scale results obtained in the laboratory.
3.3 Analysing the performance of the recycling chain
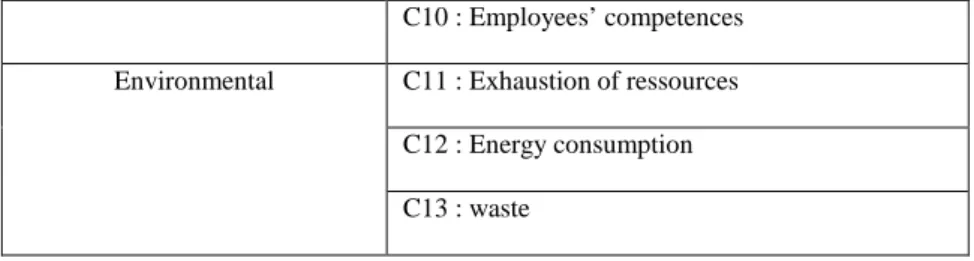
From the review of the literature on the performance of production chain, we considered four axes for evaluating the performance of an organisation [31, 32]. Moreover, by means of both the literature and investigations carried out in the field, we associated a list of determining criteria with each performance considered (Table 2). Performance as regards organisation and in relation to the environmental leads to a qualitative appreciation which could not be modelled here. We used these criteria to assess the organisational maturity of the businesses that we interviewed.
Table 2: Assessment criteria selected to evaluate the performance of recycling chain.
Table 3: Performance assessment: definition of the assessment objectives for each stakeholder and of the performance indicators associated.
Performance is therefore multi-dimensional, multi-criteria and also multi-business which makes its assessment complex. In addition the nature and levels of performance targeted vary depending on the interests of each party concerned. Consequently, we selected the nature and levels of performance to be evaluated depending on the respective interests and expectations of each of the parties concerned (Table 3). The systemic approach of the model created with Witness® helped us evaluate various performances while taking into account respect for and achievement of the interests of each business involved.
In our experiments, a performance level was defined through a hierarchy of defined performance indicators and assessment criteria which were translated into model's parameters (
Figure 7
). We therefore measured the levels of performance of the recycling chain by comparing their values with those desired by the parties concerned (Table 3) which, for the recycling chain modelled, gives the expectations of each business and the criteria considered for finding out the response of the chain to these expectations, the different levels and indicator values that enable the real instantiation values of the criteria. It must be noted that behind the expectations of the parties concerned there appear the reasons motivating these parties to identify the actions which should encourage development of the recycling chain.Figure 7: Indicators and model parameters used to evaluate technical and economic performance of our model scenarios. The definition of indicators and model parameters are presented in Appendix A.
Among the criteria and indicators recorded, the viability criterion, i.e. the overall margin of the recycling chain and of each of the businesses, appeared as a recurring and dominating indicator for each of parties concerned and represents an overall measurement (grouped together other criteria) of the stability of these systems. Thus, the margin is linked to many other
indicators both technical and organisational. It is known as a first level indicator and its analysis occurs by measuring intermediate indicators known as second and third level indicators.
In other words, a positive financial result for the various businesses is a necessary condition for the emergence of this recycling chain. Moreover, measuring the growth of the overall profit margin of the recycling chain makes it possible to assess the influence of the characteristics of businesses and their environment which may influence the soundness of this recycling chain.
The respective profit margins of the recycling chain's businesses and of the industry overall are variables which
we have sought to maximise in our model. For the recycling chain modelled, the margins measured are those of vehicle
dismantling, PP recycling, of the two businesses and finally of the overall chain solely related to recycling PP.
4. Conducting the experiment
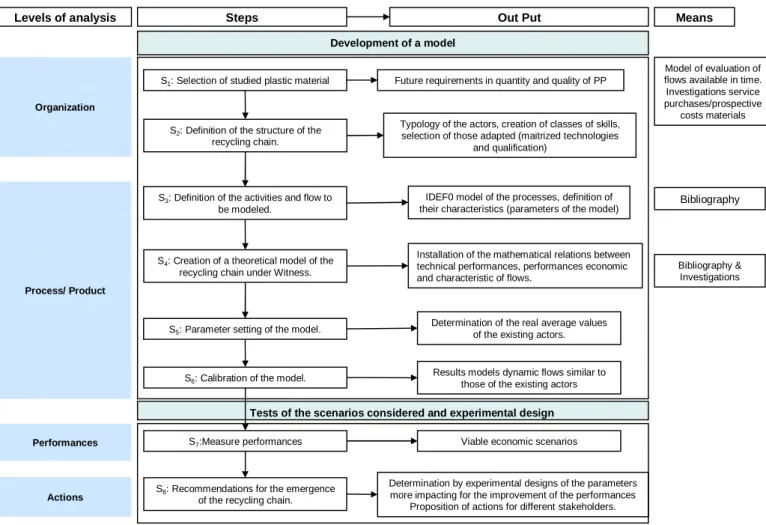
In the first instance we set the parameters of our model by characterising the processors and flows according to the mean values of existing businesses identified as the most favourable to development of the recycling chain in question [30]. Calibration of the model created was possible by comparing the technical and economic indicator values obtained with the model with those of the actual businesses. As the model was fixed, we smoothed out the technical dysfunctions related to non-optimal operation of the production equipment used by these companies (excessive maintenance costs, productivity losses, bottlenecks etc.). In the field, analysis brought to light a flow of bumpers dismantled by dismantlers then put back on the carcasses instead of being sent to the recycling companies. We therefore created a link between these businesses to increase flows of known quality intended for recycling thus allowing the production of a new quality item (hypotheses for the recycling chain modelled). The indicator values of the initial system before maximisation of the margin are those of the recycling chain shown in Figure 5. It was on these model parameters that we used the experimental protocol to establish the actions and the responsibilities for actions which should lead to stabilisation of the recycling chain (Figure 8).
Figure 8: Stages of the model experiment
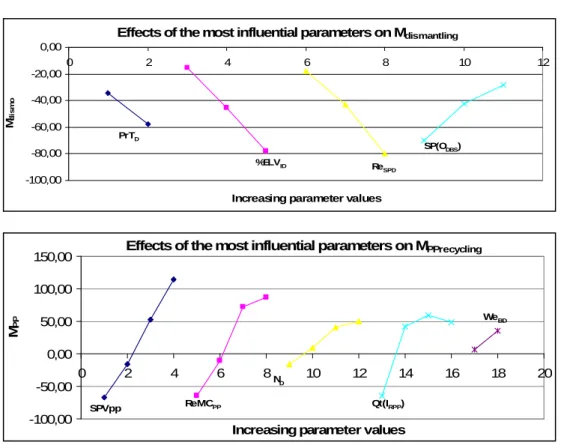
The experimental programmes were conducted using the variation parameters summarised in Table 4. They resulted in identifying four parameters for the dismantler and five parameters for the recycling company (Figure 9) as having the most influence on the expected performances of the recycling chain. Some have a positive and others a negative effect. On the other hand, the results of the experimental programmes give us the values to be achieved for each of them to maximise the
overall margin indicator of the recycling chain (Table 5
Table
). We have therefore looked for solutions or actions so that the recommended values for the parameters could be achieved in reality.Table 4: Variation parameters for margin maximization
Figure 9: Experimental design results : effects of the most influential parameters on actors’ margins
Table 5: Indicators’ and model parameters’ values after experimental design
5. Analysis of results and proposals for action
The main results obtained for the various indicators and the values of the associated parameters are resumed in Table 5. First of all the experiment has shown that it is possible for the recycling chain and each of its component businesses to achieve financial equilibrium with a positive profit margin. Indeed the main result to keep in mind is that a positive margin can be obtained for a given combination of 2nd and 3rd level indicator values. This supposes to modify the right parameters and affect the right values to them. Results robustness can be discussed on two points:
- the result values
- the parameters values sensibility
The results given in Table 5 must be considered more as qualitative values (that we call trend) than as quantitative ones. For example, for the recycling company, we will give as a result only that they can reach a largely positive margin supposing some specific changes, and not the figure. Then as margin varies linearly with the parameters (Figure 9), we can use the model to predict the potential margin even if the real parameters values are slightly different from the parameters values we proposed. The model behaviour is not chaotic. The extreme values of the parameters represent the limit values that we can affect to them. They were chosen according to their pertinence and possibility to be reached by the actors. We can consider that the proposed model is robust.
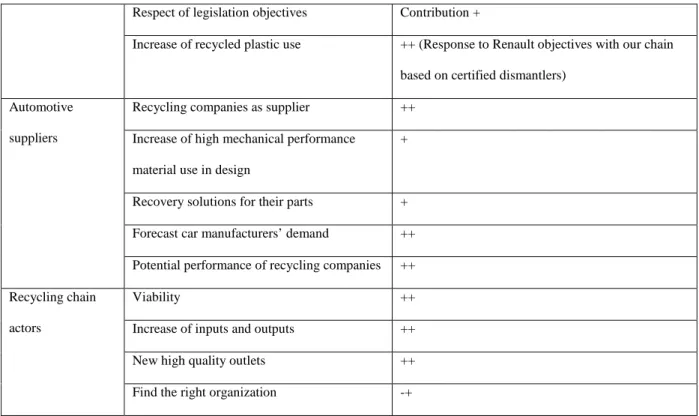
Moreover, Table 5 and Table 6 summarise the responses that the optimised model provides for the expectations of each of the parties concerned. This equilibrium of the recycling chain is possible without external financial involvement whether from governments or the automotive industry in return for precise action requiring heavy investment by businesses involved. This result is obtained for technically optimising production lines (the volume treated by the recycling company corresponding to his maximum yield). Obtaining these results with the present industry and modifying the parameters in the desired direction will result in the right business taking action at the right moment. Table 7 proposes action taken by one business and by the whole chain, those possibly responsible for this action among the parties concerned and the consequences of these actions on the parameters which must change.
Table 6 :Contribution of the proposed recycled chain to fulfil stakeholders’ objectives
Table 7: Actions proposal for stakeholders
The proposals summarised in Table 6 show that equilibrium of the recycling chain is possible in return for action, particularly reorganising the chain and by each of the parties concerned investing in it. It must be noted however that in the optimised model that we created this equilibrium could only be achieved by considering two primordial conditions:
- an increase in the price of virgin material of 20% relative to its price in 2004 (constant euros) - supplying the recycling company with 1400 tonnes of good quality PP waste.
The natural rise in the cost of oil (+ 15% between 2004 and 2006) suggests that this limit should not be an obstacle for very much longer. But this increase doesn’t necessarily conduce to an equivalent increase of recycled material price, this one is not directly linked to oil price as for virgin material one. However this criterion should be considered with caution. First of all, this increase will also cause an increase in the price of the waste cancelling out, in certain cases, the gain on leaving the recycling chain. In addition, a very large increase would cause upsets in current manufacturing systems, and the long-term lack of resources would make the use of recycled material inevitable, which would change the impact of price in the model. It represents an essential criterion for change in the first instance but of itself it is not sufficient.
An increase in the resale price of recycled material could also be imagined which does not depend solely on oil. It could result from modification of market demands and the acceptance of buying recycled materials at higher prices while still remaining lower than those of virgin material. This would induce greater confidence in the efficiency of recycling.
As far as the increase in volume of flows of good quality waste PP is concerned, the model has allowed us to work out the dimensions needed for a recycling chain for vehicle PP on a regional scale. Optimising the recycling company's results implies that he must process at least 6000 tonnes of PP per year including 50% in the new quality conditions (1400T from bumpers). Our study has shown furthermore that to cover recycling company needs in high quality material, bumpers flow from dismantlers is not sufficient in the case of our chain. Moreover shredder residue sorting could’nt at present supply enough quantity of high quality material for structural parts.
Consequently external sources of supply must be envisaged and he must be able to use flows from WEEE (at least that part of WEEE that are long life and complex). Indeed, even if the flow of material from vehicles could be increased by adding
other parts as front-end-modules to the bumpers, the total quantity of this input would still be insufficient to saturate the recycling companys' installations.
Having resolved these two aspects, various actions should be envisaged:
- increasing the cooperation between businesses to identify new flows of material, - making their relationships contractual to sustain these flows of material in the long term, - the industrialization and/or grouping together of dismantler,
- modification of activities (adding reformulation skills to those that recycling companys already have, working on integrating recycled materials into design project procedures),
- positioning recycled materials on high added value markets
- encouraging opening the automotive market to recycling companies to allow their development and thus get them onto the list of suppliers.
We have tried to define how sound the actions that we propose are by putting into effect those which are possible. Increasing contact between businesses and cooperation between them has been attempted by setting up one bumper recycling chain: the bumpers dismantled by the dismantlers and not recycled are shredded in-situ using a mobile shredder shared between various dismantlers and collection is by a manager-distributor. The shredded bumpers collected are transferred to a recycling company in the region6. This flow of quality material effectively increases the recycling company's volumes and also allows him to ensure with this quality the production of a high standard product intended for vehicles (validation of the initial hypotheses).
Use of this new product was proposed to POAE’s7 equipment manufacturing project teams. To encourage its use by designers, the product design process was modified particularly by creating new material specification sheets setting out the properties of this material. The properties in use of the material (pouring properties, retraction etc.) have been established and included in the materials databases. New ecodesign on-line help tools have been developed [33]. Setting up new high quality outlets requires the structural parts market to be opened up and recycled material to be integrated into design just like virgin material. An approach to integration has been developed in the project teams highlighting use of the recycling chain modelling tool as a source of information on the state of the chain and facilitating the choice of buyers, and consequently the production of a recycled materials list [1].
This experiment has demonstrated the possibility and necessity of closing the loop by integrating the recycling chain into the automotive supplier's design process.
6 Press article “Plastic Recycling: une filière en demarrage, Autorecyclage, n°65. 7 POAE : Plastic Omnium Automotive Exterior
6. Conclusion
The objective of this study was twofold as we wished to both:
- evaluate the possibility that the plastic recycling industry would one day be in a position to provide a sufficient flow of material in terms of quality and quantity to automotive suppliers so that the criteria of the ELV directive could be met,
- define the action to be taken and the responsibilities of each party concerned relative to these actions to arrive at this equilibrium, if it appeared to be possible.
Table 5 and Table 6 summarize the responses that the optimised recycling chain that we constructed would provide to the
expectations of the parties concerned. Overall, the chain as constructed in the model meets the quality and cost requirements of the flows of material. It meets the automotive suppliers' objectives in terms of recyclability but is not sufficient to meet demand from car manufacturers. Currently it is not possible to combine these flows with those from sorting shredded residues as the quality of the latter is not high enough for the quality standards that we propose here. On the other hand, flows of shredded residues are already being used in low quality items and in part for vehicles. Several solutions for positive development (i.e. providing the quantities of material for recycling which are essential) are available to the recycling industry:
• improving sorting techniques, developing them in the laboratory level to increase both the quantities recovered and their quality;
• only one business exists today for sorting shredded residues: therefore this number or its capacity should be increased;
• developing and increasing the quantity of material recovered by dismantling by setting up an industrial network on a national scale;
• calling on new flows of material such as those from the WEEE recycling chain. This became a reality on 15 November 2006.
The modelling tool created also provides information needed to help decision making by the various parties involved:
- It provides technical and economic performance information on a given recycling chain. - It puts forward specifications for the development and setting up of recycling chains.
- It provides flow characteristics for the businesses concerned to obtain equilibrium in the recycling chain and of the businesses involved.
- It provides the users of recycled material with the properties of material obtained by the recycling companies and their viability.
- It may also represent a first step towards capitalising on recycling industry data for officially approving vehicles.
Obviously the results must be considered as approximate values, the object of creating the model being to provide orders of magnitude and indicate trends. However, the trends which it allowed us to elucidate and apply in the validation tests, carried out in an industrial setting, are encouraging. Moreover, we have been able to verify that systemic analysis is essential, as the results obtained by maximising all the margins and the separate margins of the businesses are different, showing the interaction between businesses and their sometimes divergent interests, hence the necessity to consider all the businesses involved at the same time. The recycling chain must therefore be considered in its entirety to produce development which provides compromises acceptable to all those concerned. We have also been able to verify the relevance of this approach as the presentation of our results to the different parties involved resulted in the formation of a working group bringing them together with the object of sharing data which should allow the relevance and scope of the model developed for the PP chain to be extended to other materials.
6. Aknowledgments
We would like to thank Frederic Viot, recycling and ecodesign expert of POAE, for his contribution and support in the model development but also for his work and his propositions in the implementation of recycled material use in POAE’s design process. This research was financially supported by the European Project SAFFIR carried out by POAE.
7- Appendix A: Definition of model indicators and parameters
Notation Definition
MA The profit margin associated with a given activity, actor or
chain (A for short)
TRM The recycling rate associated with a given material, part or
product (M for short)
PCA The total production cost associated with a given activity,
Qt(IAM) The input quantity associated with a given activity, actor or chain (A for short) and with a given material, part or product (M for short)
Qt(OAM) The output quantity associated with a given activity, actor
or chain (A for short) and with a given material, part or product (M for short)
PrPPM The process performance associated with a given process (P
for short) and with a given material, part or product (M for short)
Ql(OAM) The output quality associated with a given activity, actor or
chain (A for short) and associated with a given material, part or product (M for short).
SP(OAM) The selling price associated with a given activity, actor or a
chain (A for short) and with a given material, part or product (M for short)
PuP(IAM) The purchase price associated with a given activity, actor or
a chain (A for short) and with a given material, part or product (M for short)
MPM The maintenance associated with a given process (P for
short) and with a given material, part or product (A for short)
SPM The scrap associated with a given process (P for short) and
with a given material, part or product ( M for short)
NEPA The number of employees associated with a process (P for
short) and with an activity, actor or chain (A for short)
WTPA The work time associated with a process (P for short) and
with an activity, actor or chain (A for short)
PrTPM The process time associated with a given process (P for
short) and with a given material, part or product (M for short)
chain (A for short) and associated with a given material, part or product (M for short).
ReMC The recycled material choice associated with a given
material corresponds to the quality distribution of recycled materials produced by recycling companies
SPV The selling price associated with a given virgin material
8. References
1. Maudet, C., et al. "A method for recycled plastic integration in the automotive industry." in 13th CIRP: International
Conference on Life cycle Engineering, Leuven (2006), Belgium.
2. European Union, "Directive of the European Parliament and of the Council on end-of-life vehicles." Official Journal
of the European Communities, (2000) L 269/342.
3. Ministère de l'écologie et du développement durable, "Décret n° 2003-727 du 1er août 2003 relatif à la construction
des véhicules et à l'élimination des véhicules hors d'usage." Journal officiel, n°179 du 5 Août 2003.
4. François, O. "Mass-Balance in post-shredding technology: results of a trial based on the shredding of 201 ELVs-A
joint work of Galloo, PSA and Renault." in International Automotive Recycling Congress, Geneva (2003), Switzerland.
5. GHK, Bio Intelligence Service, A study to examine the benefits of the End of Life Vehicles Directive and the costs
and benefits of a revision of the 2015 targets for recycling, re-use and recovery under the ELV Directive. In the framework of
the contract to provide economic analysis in the context of environmental policies and of sustainable development, Final
Report to DG Environment , 2006, 190p.
6. ADEME, "Enquête 2002 sur la filière du recyclage des plastiques en France." Report, (2004), 118p.
7. ADEME, "Bilan du recyclage 1993-2003." Report, (2005), p. 116.
8. Del Vecchio, J.M. and D. Froelich. "La valorisation des VHU par un démontage avancé et optimisé." in Colloque
filières et recyclage, Paris (2004), France.
9. Schultmann F., Zumkeller M. and Rentz O.Modeling reverse logistic tasks within closed-loop supply chains: An
example from the automotive industry, European journal of operational research, 2006, 171/3, p.1033-1050.
10. Consultic marketing and industrieberatung GmbH, "Plastic waste in European Key Countries: Report of results."
PlasticsEurope: Association of Plastics Manufacturers,(2005), 139 p.
11. François, O. "Techniques de valorisation des VHU par le tri post-broyage." in Colloque filières et recyclage, (2004).
12. Bellmann, K. and A. Khare, "European response to issues in recycling car plastics." Technovation, 19(12), (2004) p.
721-734.
13. Le Blanc H.M.,Fleuren H.A. and Krikke H.R., Redesign of a recycling system for LPG-tanks, OR spectrum, 2004,
26, p.283-304
15. Lassartes, R. "Processus et résultats de Renault." in Colloque Filières et Recyclage. (2004) Paris.
16. Rossi, M., et al., "Moving towards sustainable plastics: a report card on the six leading automakers." Report of
Ecology Center, (2004) 56p.
17. ADEME, Economic study on the management of End-of-life Vehicles, 2003, p.165.
18. Jenseit, W., et al., "Recovery options for plastics parts from End-of-Life Vehicles: an Eco-Efficiency Assessment."
Report, Öko-Institut for APME (2004).
19. European Union, "Directive 2005/64/CE Type-approval of motor vehicles with regard to their reusability, recyclability
and recoverability and amending Council Directive 70/156/EEC" Official Journal of the European Communities, (2005) L
310/10.
20. Gungor, A. and S.M. Gupta, "Issues in environmentally conscious manufacturing and product recovery: a survey."
Computers and Industrial Engineering, Vol 36/4, (1999), p 811-853.
21. Mathieux, F.,Froelich, D., & Moszkowicz, P., "ReSICLED: a new recovery-conscious design method for complex
products based on a multicriteria assessment of the recoverability." Journal of Cleaner Production, (2006).
22. Tonnelier, P., Millet, D., Richir, S., LeCoq, M., "Is it possible to evaluate the recovery potential earlier in the design
process proposal of a qualitative evaluation tool. ", Journal of Engineering Design, vol. 15, n°5, 2003.
23. Maudet C., A synthesis of plastics waste quantity and plastic recovery technologies: an application to
polypropylene reinforced by glass fiber, SAFFIR, 2003, Projet Eureka, p.58.
24. Van Schaik, A., "Theory of recycling systems: Applied to car recycling." pHd study, Delft University of technology:
Delft, (2004) 237p.
25. Fleischmann, M., et al., "A characterisation of logistics networks for product recovery." Omega, 28(6 SU -)(2000) :
p. 653-666.
26. Garcia, R., "Product chain management to facilitate design for recycling of post consumer plastics: case studies of
polyurethane and acrylic use in vehicles.", International Institute for Industrial Environmental Economics (IIIEE): Lund
University, (2000) p. 108.
27. Krikke, H., J. Bloemhof-Ruwaard, and L.N. Van Wassenhove, "Design of closed loop supply chains: a production
and return network for refrigerators, in Reasearch in management." E. Report, Erasmus Research Institute og Management:
Erasmus Universiteit Rotterdam (2001) p. 33.
28. Ferrao, P. and J. Amaral, "Assessing the economics of auto recycling activities in relation to European Union
Directive on end-of-life vehicles." Technological forecasting and social change, 73(3), (2006) p. 277-289.
29. ADEME, "Panorama européen des éco-organismes ou stuctures assumant la responsabilité des producteurs pour
la gestion des produits en fin de vie." Report, (2003) 150 p.
30. Maudet, C., Bertoluci, G. and D. Froelich, "Choice of an adapted end-of-life scenario by recovery chain modelling."
in 17ème Congrès Mondial IMACS: Calcul Scientifique, Mathématiques Appliquées et Simulation, (2005) Paris, France.
31. Clivillé V., Berrah L., Methodological guidelines for performance measurement systems in a supply chain context,
32. Tahon, C., "Evaluation des performances des systèmes de production. IC2 productique." ed. Lavoisier, (2003).
33. Toupé, P.Y., "Intégration du démantèlement des fonctions automotives à la conception." in Mastere "Eco-concetion
et management environnemental." Student report ENSAM Chambery,(2004), 70 p.
6 9 6 4 9 1 2 1 4 ,5 1 5 7 ,5 9 0 20 40 60 80 100 1990 2005
Ferrous Metals Plastics Other Nnon Ferrous Metals
+62% by weight
Figure 1: Difference between ELV and new vehicle material composition
Product chain Part chain Material chain
Dismantling Depollution Reuse Dismantling Depollution Reuse MR Metals FM, NFM Batteries Catalytic converters Glass Tyres ER, MR FM, NFM MR PP PP Lead PP, PE, ABS Glass Filler Energy Shredding, Sorting SR landfill Sorting ELV ELV MR MR MR PP, PE, ABS MR ELV Bumpers Metal parts MR FM, NFM
Virgin material supplier
Automotive industry
Consumer
Last owner Manager-Distributors
Depollution Dismantling Shredding Sorting SR treatment Sorting Recycling
Dismantler Shredder Recycling company
ELV
Shredding Recycling
Shredder Recycling company
Other industries Recycled plastic ER, MR, Reuse Components, fluids Plastic parts (bumpers) MR, landfill FM, NFM, SR ER, landfill Residue ER, landfill Residue Production Use End-of-life
Figure 3: ELV management
80 % 80 % 20 % 20 % Injection Injection Extrusion Extrusion
-Technical Front End
Recycled PP End-of-life bumpers 100% recycled GF-PP Virgin FF-PP Glass fibre from
end-of-life thermosets
Figure 5: Diagram of the modelled recycling chain: a regional PP recycling chain -Effectiveness -Treatment capacity -Process time -Scrap rate -Selling price -Purchase price -Production cost -Product -Quality -Quantity -Downstream source -Upstream source Process characteristics Economic flows Material flows -Effectiveness -Treatment capacity -Process time -Scrap rate -Selling price -Purchase price -Production cost -Product -Quality -Quantity -Downstream source -Upstream source Process characteristics Economic flows Material flows
Dismantler Shredder Recycling company QtAM, QlAM
PCD PA SP(OSM) PuP(ISM) SP(ODM) PuP(ISM) SP(O RM) PuP(I RM) PCS PCR
Average process chain
Qt(OSM), Ql(OSM) Qt(IRM), Ql(IRM) Qt(ODM), Ql(ODM) Qt(ISM), Ql(ISM) Qt(IDM), Ql(IDM) Qt(ORM), Ql(ORM) MS MR Economic chain MD
))
(
,
,
(
M
A=
f
Qt
AMPC
ASP
O
AMC4:MA C6:PCA C5:SP(OAM) C1:Qt(IAM), Qt(OAM) PrPPM, WTPAPrTPM C2:PrPPM C2: Ql(OAM) Ql(IAM), NEA, PrPPM, PrTPM Ql(IAM), ReMC SPV, Ql(IAM), ReMC MPM, SPM, NEA C3: TRm Qt(OAM) 1st level indicator
2nd level indicator 3rd level indicator
Model parameters
Figure 7: Indicators and model parameters used to evaluate technical and economic performance of our model scenarios. The definition of indicators and model parameters are presented in Appendix A.
ELV number Scale over the territory Available flows of bumpers
1800000 Available over the French territory 36000
1200000 Collected over the French territory 24000
480000 Collected by authorized and certified dismantlers 9600
70000 Collected over the region chosen 1400
Table 1: Sizing of the available flows of bumpers under specific conditions (data 2004)
Performance Criteria
Technical C1 : Treatment capacity
C2 : Effectiveness
C3 : Respect of legislation objectives
Economic C4 :Viability/stability of one actor or one chain C5 : Adequacy with market demands
C6 : Profitability C7 : Financial support
Organizational C8 : Collaboration between actors C9 : Actors’ professionalization
C10 : Employees’ competences
Environmental C11 : Exhaustion of ressources
C12 : Energy consumption C13 : waste
Table 2: Assessment criteria selected to evaluate the performance of recycling chain.
Stakeholders Objectives Performance Criteria Indicator Value
Society Government 1- Viability and perennity of recycling chains 2- Information on chain performance 3- Respect of legislation objectives Societal Economic Technical Organizational Environmental
C4 Profit margin of the
chain Equilibrium or >0 C1 Recycled material volume produced Adequacy with a given market
C2 Quality New trade outlets
C5 Price Adequacy with a
given market
C3 Recycling rate 85%
Car manufacturers 1- Viability of ELV recovery chain : no financial support 2- Choice of end-of-life scenarios to implement 3- Information on performance for decision making in design 3- Respect of legislation objectives 4- Increase of recycled plastic use
Technical Economic
C4/C7 Profit margin of the
chain Equilibrium or >0 C1 Recycled material volume produced 32500T of PP (Renault 50kg of PP for 2015) C3 Recycling rate 85%
C2 Quality new high quality
outlets
C5 Price < virgin material
price Automotive suppliers 1- Recycling companies as supplier 2- Recovery Economic Technical Organizational
C4/C6 Profit margin of the
recycling company Equilibrium or >0 C1 Recycled material volume produced 10000T of PP (15% of purchases)
solutions for their parts 3- Respect of legislation objectives 3-Increase of high mechanical performance material use in design 4- Forecast car manufacturers’ demand 5- Potential performance of recycling companies
C3 Part recycling rate Maximum
C2 Quality Adequacy with
structural part specifications C5 Price 15% < virgin material price Recycling chain actors 1- Viability 2- Increase of inputs and outputs 3- New high quality outlets
4-Find the right organization Economic Technical Organizational C4 Profit margin of dismantling and PP recycling Equilibrium or >0
C6 Production cost minimize
C1 Recycled material volume produced Adequacy with upstream and downstream specifications
C2 Quality new high quality
outlets
C5 Price Adequacy with the
market (for example the automotive one)
Table 3: Performance assessment: definition of the assessment objectives for each stakeholder and of the performance indicators associated.
Tests of the scenarios considered and experimental design Development of a model
S1: Selection of studied plastic material
S2: Definition of the structure of the
recycling chain.
S3: Definition of the activities and flow to
be modeled.
Future requirements in quantity and quality of PP
Typology of the actors, creation of classes of skills, selection of those adapted (maitrized technologies
and qualification)
IDEF0 model of the processes, definition of their characteristics (parameters of the model)
S4: Creation of a theoretical model of the
recycling chain under Witness.
S5: Parameter setting of the model.
Determination of the real average values of the existing actors.
S6: Calibration of the model.
Results models dynamic flows similar to those of the existing actors
S7:Measure performances Viable economic scenarios
S8: Recommendations for the emergence
of the recycling chain.
Determination by experimental designs of the parameters more impacting for the improvement of the performances
Proposition of actions for different stakeholders.
Steps Out Put
Organization
Process/ Product
Performances
Actions
Levels of analysis Means
Model of evaluation of flows available in time. Investigations service purchases/prospective costs materials Bibliography Bibliography & Investigations Installation of the mathematical relations between
technical performances, performances economic and characteristic of flows.
Figure 8: Stages of the model experiment
Evolution parameters linked to the
context
Notation Definition Variation
%ELVID Rate of ELV from insurance companies associated
with dismantlers
WeELVD ELV average weight associated with dismantlers
ReSPD Revenue associated with spare parts and with
dismantlers
WeBD Dismantled bumpers weight associated with
dismantlers
ND Number of dismantlers who dismantle bumpers
SP(ODUB) Selling price associated with unshredded bumpers
and with dismantlers and recycling companies
PrTD Process time associated withe the dismantling of
ELV from insurance companies
SP(ODBS) Selling price associated with ELV body shells and
with dismantlers Variation
parameters
ReMCPP The recycled PP choice corresponds to the quality
recycling companies
SPVpp The selling price associated with virgin PP and with
a given market
Qt(IRPP) The input quantity associated with PP and with
the recycling company
Table 4: Variation parameters for margin maximization
Effects of the most influential parameters on Mdismantling
-100,00 -80,00 -60,00 -40,00 -20,00 0,00 0 2 4 6 8 10 12
Increasing parameter values
Md is m o l PrTD %ELVID ReSPD SP(ODBS)
Effects of the most influential parameters on MPPrecycling
-100,00 -50,00 0,00 50,00 100,00 150,00 0 2 4 6 8 10 12 14 16 18 20
Increasing parameter values MP P SPVpp ReMCPP ND Qt(IRPP) WeBD
Figure 9: Experimental design results: effects of the most influential parameters on actors’ margins
Variables Notation Initial values Maximized values
1st level indicator Mdismantling (€/ELV) -56 27 [19;35]
Mdismantlerr (€/ELV) 100 113 [79;147]
MPPrecycling (€/T) -369 180 [126;234]
MRecyComp (€/T) -71,2 186 [130;242]
TRPP (%) +1% +1,6%
2nd level indicator PCdismantling (€/T) 409 275
3rd level indicator Qt(IRecyCompPP) (T) 3756 6866 Qt(ORecyCompPP) (T) 3400 5825 Qt(IdismantlerELV) 1398 2462 Qt(OdismantlerBumper) (T) 11 1850 PrPrecyclingPP (T/h) 0.9 1,5 PrPdismantlingELV (ELV/h) 0.8 1,5
Ql(ORecyCompPP) 70% of low quality 50% of high quality
SP(OrecyclingPP) (€/T) 889 1330 Parameters ReSPD (€) 0 0 %ELVID 80 40 PrTD (h) Uniform(1,6) uniform(1,4) WeELVD 1 1,2 SPVpp (€/T) 0 20%
Qt(IRecyCompPP) Initial Initial*4
ND 1 100 SP(ODismantlerUB) SP(IRecyCompShredBump) (€/T) SP(ODismantlerUB)=40 SP(IRecyCompShredBump)=238 SP(ODismantlerUB)=160 SP(IRecyCompShredBump)=371 WeBD (T) 0,01 0,02 SP(ODBS) (€/T) 40 100
ReMCPP (% high quality) 5% 50%
Table 5: Indicators’ and model parameters’ values after experimental design
Stakeholders Objectives Values
Society Government
Viability and perennity of recycling chains ++
Information on chain performance ++
Respect of legislation objectives Contribution +
Car manufacturers Viability of ELV recovery chain : no financial support
++
Choice of end-of-life scenarios to implement -+ Information on performance for decision
making in design
Respect of legislation objectives Contribution +
Increase of recycled plastic use ++ (Response to Renault objectives with our chain based on certified dismantlers)
Automotive suppliers
Recycling companies as supplier ++
Increase of high mechanical performance material use in design
+
Recovery solutions for their parts +
Forecast car manufacturers’ demand ++
Potential performance of recycling companies ++ Recycling chain
actors
Viability ++
Increase of inputs and outputs ++
New high quality outlets ++
Find the right organization -+
Table 6 :Contribution of the proposed recycled chain to fulfil stakeholders’ objectives
Stakeholders Actions Consequences
Recycling company specifications
Automotive industry Society
Recycled plastic price increase linked to virgin material price increase
SPVpp
Automotive industry Recycling company
Production of high quality recycled material= new outlets
ReMCPP
Automotive industry Recycling company Dismantler
Treatment of new sources (new parts, new material)
Qt(IRecyCompBump)
ND
Recycling company Recycling chain actors
Sources number increase ND
Qt(IRecyCompPP)
Recycling company Dismantler
Society
Low price material SP(OPP)
Dismantler specifications
Dismantler
Automotive industry
New recyling activity (bumper dismantling) or dismantling industrialization
![Figure 4: PP recycling and recycled PP use in automotive high performance parts [1]](https://thumb-eu.123doks.com/thumbv2/123doknet/7278797.207213/24.892.282.696.419.638/figure-pp-recycling-recycled-automotive-high-performance-parts.webp)