1
Advances in ORC expander design
Vincent Lemort and Sylvain Quoilin
Laboratoire de Thermodynamique, Université de Liège,
Belgium
INTERNATIONAL SYMPOSIUM ON ADVANCED WASTE HEAT VALORISATION
TECHNOLOGIES
2
IntroducWon
Early years of posi3ve displacement machines
The posi)ve displacement machine is not a new idea…
o 1588: vane-‐type water pump by Ramelli
o 1636: gear water pump in/by Pappenheim
o 1765: James Wa`s steam engine
o 1799: Murdoch steam engine, should
deliver ½ HP but too many leakages
o …
« There is much fric3on in this kind of engine, much
leakage, and but a small power realised in
propor3on to the size of the machine… » (Bourne,
1858)
Source: Museum of retrotechnology
Wood 3p seals
Steam supply
Steam
exhasut
1799: Murdoch steam engine
Today: gear pump
3
IntroducWon
o Today, regain of interest for small and medium scale expanders
Ø
RefrigeraWon (expansion valve replacement)
Ø
StaWonary power producWon (steam cycles, ORC)
Ø
Heat recovery on engines
o Purpose of this presentaWon:
ü
Describe technical constraints inherent to the design of posiWve displacement
machines (piston, screw and scroll)
ü
Present some modeling techniques
ü
Discuss about the selecWon of expansion machines
ü
Stress some relevant R&D trends related to posiWve displacement machines in order
to improve the energy performance of both the expander and the ORC system
4
Technical constraints
Losses in posi3ve displacement expanders
o Supply/discharge pressure losses, under-‐over expansion, leakages, heat transfer,
(clearance volume), mechanical losses
The Japan Society of Mechanical Engineers
NII-Electronic Library Service
Scroll
(Yanagisawa et al., 2001)
Screw
(Kaneko and Hirayama, 1985)
Piston
5
Technical constraints
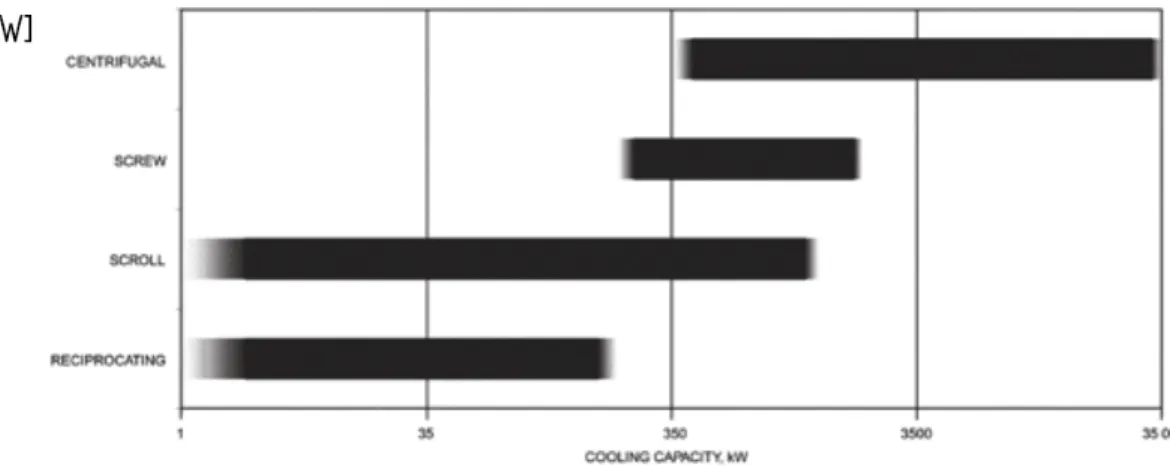
Capacity
The Japan Society of Mechanical Engineers
NII-Electronic Library Service
6
Technical constraints
Capacity
4
Figure 2 – Principle diagram for a bottoming or waste heat recovery cycle. Waste heat from the exhaust
of an internal combustion engine is used to generate additional mechanical power via an external
combustion engine (i.e. via a heat recovery steam generator and a steam engine system). The total power of
this subsystem exceeds the power generated by the ICE.
2.2 Expander types
To convert heat to mechanical work some type of expander has to be utilized. Different
kinds of expanders are suitable concerning efficiency and mechanical aspects, depending
on the application, i.e. power range. Generally there is a characteristic optimum
peripheral velocity (tip speed) u (or mean piston velocity for reciprocating machines), for
every type of positive displacement machine, determined by their inherent leakage and
throttling losses [7]. This optimal tip speed is fairly independent of the machine size and
virtually constant for a uniform specific type of machine. Also for turbo (dynamic)
machines there is a fairly size independent optimum tip speed, in this case primarily
determined by vane geometry (the “specific speed” parameter for turbo machines) [4].
Thus, from the kinematic relation
u D n, the optimal shaft speed n becomes
dependent of the machine size (rotor diameter) D (Figure 3).
Figure 3 – Optimal shaft speed and volume flow relations for positive displacement and turbo machines.
Power scale valid for air compression duty (after [4]). As seen, the closest match on shaft speed in
applications such as the automotive application corresponds to the optimal shaft speed of piston machines.
o A category of machine is characterized by
an opWmal Wp speed (m/s) fairly
independent of its size (Persson, 1990).
o Turbines operate at larger Wp speed than
displacement machines.
Approximate range of chiller cooling capacity range by compressor type (ASHRAE, 2008)
7
Technical constraints
Capacity
Piston expanders
o Currently used for small-‐scale CHP and waste heat
recovery on ICE (niche market tech.)
o Axial expanders: compact, low vibraWons (MAC)
o Displacement: approx 1.25 to 75 l/s
Source: Amovis, 2012
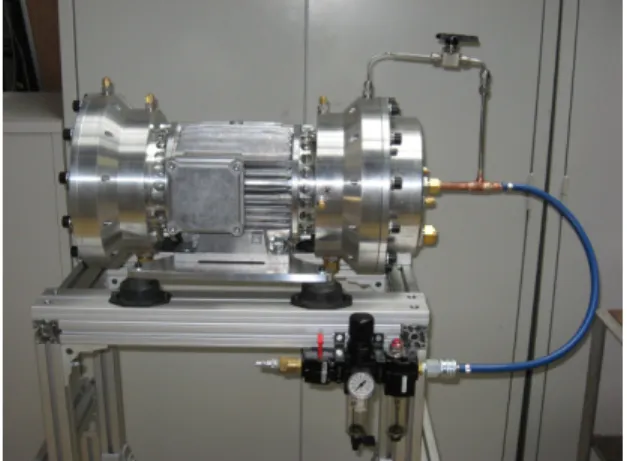
Screw expanders
o From 20 kWe to 1 MWe (In comp: 200W-‐2/3 MWe)
o Displacement: approx 25 to 1100 l/s
o Few records on micro-‐screw expanders (volumetric
perf.!)
o Mainly twin-‐screw (except BEP, Wang et al., 2011)
o Only rotaWng elements: high rota)onal speeds
(21,000 rpm recorded)
Pumps, Compressors and Process Components 2012 121
Compressors
Screw expander
Due to the liquid to be expected inside the expansion machine, screw expan-ders the functional principle and de-scribing parameters of which will be presented in the following, are parti-cularly suitable for these applications. With the help of basic design variants, the properties of these fluid energy machines are demonstrated and the systematic and targeted procedure for their design will be described.
Functioning and parameters
Screw expanders are displacement machines without clearance volume, the working chambers of which are formed by the tooth gaps of two he-lically toothed gears, the rotors. The volume of a working chamber depen-ding on the rotation angle is exempla-rily demonstrated in Fig. 1. If a tooth of the female rotor on the high-pres-sure side (HP-side) unscrews from the tooth space of the male rotor, a wor-king chamber arises. With progressing rotation of the rotor, the volume of this working chamber increases up to a maximum before it is reduced again by a repeated tooth engagement or by the low-pressure side at the front edge, and the working chamber fi-nally disappears. The rotors are tight-ly enclosed by a casing which provides the working chambers with external sealing and sealing towards the front edge. The casing houses the inlet and outlet ports, the limitations of which
are called control edges. The outlet port in the front edge casing of the low-pressure side enables the working fluid to be discharged usually from the maximum chamber volume Vmax up to the disappearance of the wor-king chamber. In the range in which the chamber is formed the inlet port represents a connection to the high-pressure side of the screw expander. This connection is maintained up to a selectable chamber volume VEx,th (Fig.1). The ratio
is called internal volume ratio vi and is one of the essential parameters of a screw machine.
The ideal comparison process for a screw expander consists of an isobaric chamber filling with the inlet pressure pE and the inlet density E (high-pressure side) up to VEx,th, an isentro-pic expansion up to the discharge pressure pA (low-pressure side) and an isobaric discharge (Fig. 2) [2]. The isentropic work Ws this process deli-vers per working cycle together with the actually performed inner work per working cycle
forms the compression work ratio Wi/Ws.
The volumetric efficiency L
with
describes the ratio of system mass flow mA to theoretical delivery mass flow mth, with the product of male ro-tor speed nMR and male rotor number of teeth zMR being the working cycle frequency. Another important para-meter of fluid energy machines is the inner isentropic efficiency is with
In this case, the isentropic power Ps corresponds to the product of specific isentropic work ws and system mass flow mA
and Pi of the indicated or internal power of the screw expander. In con-nection with the mechanical efficien-cy m
the effective output power Pe and the effective isentropic efficiency es re-sults in
Fig. 1: Volume curve as well as inlet and discharge areas of a screw-type expander over the rotational angle of the male rotor (asymmetric SRM profile;
vi = 8; zMR/zFR = 4/6; MR = 200°; L/D = 1.4)
Fig. 2: Indicator diagram of a screw expander optimized with regard to the output power and ideal comparison process (not represented from Vmax) (asymmetric SRM
profile; vi= 8 ; zMR/zFR = 4/6; MR = 200°; L/D = 1.4) . . . Source: Brümmer, 2012 εv,cp÷1− cste N.D Source: BEP
8
Technical constraints
Capacity
Scroll expanders
o From mini-‐scroll to very large machines
o Currently, the trend in the compressor industry is to increase
the size (f.i. Emerson ZP725K with 158 kW cooling capacity)
o Large scroll compressors compete with small screw machines
o Mul) scroll ORCs have not been invesWgated yet (except
Enenech): modulaWon, PL performance
o Speed:
§
Mobile A/C: up to 10,000 rpm
§
Permanent magnet generators: variable speed + higher
efficiency
Contact: Achim Frommann, Media Communication and Relations - [email protected] Emerson Climate Technologies GmbH, Pascalstr. 65, 52076 Aachen, Germany
T: +49 (0) 2408 929 0 F: +49 (0) 2408 929 570 www.emersonclimate.eu
2012_0327_PREL_ZP725_en Page 1 of 2
press release
R410A Copeland Scroll™ for systems up to 1 MW
MILAN, ITALY, March 27, 2012 – For large HVAC systems Emerson Climate
Technologies designed the new Copeland Scroll™ ZP725K compressor for the refrigerant R410A. With a capacity of 158kW* the new Copeland Scroll™ ZP725K opens the door to a widespread use of this refrigerant for air-cooled multi-scroll chillers with a capacity up to 1 MW and up to 1.25 MW if water-cooled. This extra large scroll can easily be combined with other scroll compressors that are identical or lower in size or capacity to offer several possible combinations. This flexibility and reduced complexity is ideal for manufacturers who produce systems with different capacities and enables them to keep only a few compressors in stock. All the assembly designs are Copeland qualified and key in increasing the system seasonal efficiency due to the wide range of capacity modulation – up to the possibility of 12 steps with uneven trio assemblies. Publications from the Eurovent directory demonstrate that systems with scroll technologies and R410A have an overall better seasonal performance compared to similar systems using different refrigerants and compression technologies. Moreover, Emerson’s new CoreSense™ Communications provides the enhanced protection and diagnostic required and expected by this demanding range of applications in HVAC systems. Via RS485 Modbus the system controller is able to gather compressor’s status and working conditions and can adapt or avoid altogether system downtime.
New extra-large 60hp Copeland Scroll™ compressor beside the smallest commercial scroll (7.5hp) *EN12900 rating conditions
9
Technical constraints
Built-‐in volume ra3o
The Japan Society of Mechanical Engineers
NII-Electronic Library Service
Over and under
expansion losses
10
Technical constraints
Built-‐in volume ra3o
Scroll
o From 1.5 to 3.5 (HVAC&R), 4.0 (air compressors)
o Results from cost and performance consideraWons:
•
Performance: number of pairs of sealing
points limited to 2 or 3, fricWon
•
Cost: prohibiWve scroll length, compactness
Source: Manzagol et al., 2002
x [m] y [m ] -0.08 -0.06 -0.04 -0.02 0 0.02 0.04 0.06 0.08 0.1 -0.07 -0.06 -0.05 -0.04 -0.03 -0.02 -0.01 0 0.01 0.02 0.03 0.04 0.05 0.06 0.07 0.08 0.09 involute tip Source: Lemort, 2009
Piston expanders
o Could be large (f.i. internal combusWon engines)
o Limited by the specific work of the machine (compactness).
o In pracWce, between 6-‐14
Screw
o Up to 5.0 in pracWce. 8.0 is recorded
(Brümmer, 2012)
o Moderate volume raWo expanders show be`er performance
o Stronger impact of leakage in expander mode.
Analysis of screw expander performance 129
I00 9O 70 6o 0 5 0 - 40 0 • rv,2 (Smil) ] & r v -2.5 (Stair) / (Ref,14) • r~ -3.5 (Smi(] o r,-5 (Stall) o r, -5.3 (lOmR) -- (Ref.15,16) "% I ) i I I I I 5 6 9 12 15 Ie 21 24 Pressure mtio %)
Fig. 9. Overall isentropic efficiency of expanders. t I
27 3O
expansion ratio. Equation (10) is found experimentally to be linear from the data of Mycom and Steidel, as shown in Fig. 10. The linear relationship reinforced the initial assumption made, i.e. the expansion follows a constant index path. In addition, it is observed that the gradient of the blowdown pressure ratio increases with decreasing volumetric ratio of the expanders. From Fig. 10, if a data point falls below 1.0, it means that the blowback process has occurred. Only two sets of the experimental data exhibit this phenomenon, i.e. rv = 2.5 of Mycom data and the Steidel data. Rearranging equation (10) gives
ln(r-E~ = - n ln(rJ. (11)
\ r p /
Thus, the average value of the expansion index of the working fluid can be obtained, as shown in Fig. I I. The average expansion index, n, from all the experimental data is found to be about 1.074, a value which is quite close to the isentropic index of 1.13. Table 4 gives a detailed listing of the indices for different expanders. It is noted that there is a slight increase in the value of the expansion index as the volumetric ratio increases. Another point to note is that the difference between the expansion indices and the isentropic index, 7, indicates the presence of thermodynamic irreversibility. =z oo A I I l I I 3 6 9 12 15 D & rv-2 (Mycom-Smit) • r v -2.5(Myo0m-Smit) • rv ,3.5 (Mycom- 5mit ) D r v , 5 (Myc=m-Smit) • ~, , 5 3 I M y ~ - l O m i l . ) 18 21 24 27 Pressure rotio (r.)
Fig. I0. Variation of blowdown rp~ with operating rp. I
3O
11
Technical constraints
Built-‐in volume ra3o
o Increase volume raWo?
Ø
Two-‐stage expansion:
o Experience from Kane et al.(2009): r
v,in: 4.2x3.0,
high speed permanent magnet generator (6000
rpm), 5 kWe (steam, 250°C, 25/1 bar)
o OpWmal intermediate pressure (Quoilin, 2011)
Rapport HTScroll 19
-Rapport final – 29 octobre 2009
5. Tests de design et de fonctionnement mécanique
5.1 Tests de pression et d’étanchéité
Un ensemble composé d’un étage HP et du générateur, comportant tous les points critiques d’assemblage, a été testé d’abord avec une charge de réfrigérant à 8 bars et ensuite complété avec une charge d’azote à 22 bars. Les joints et points d’assemblages externes ont été testés avec un détecteur de fuite. Aucune fuite importante n’a été trouvée et aucun dommage n’a été observé.
5.2 Tests de fonctionnement mécanique à l’air comprimé
Des tests à air comprimé ont été préparés pour vérifier le fonctionnement mécanique de la machine et en particulier le comportement au démarrage. Un système de filtre à air, de vanne de détente et de lubrificateur d’air sont montés sur le circuit de vapeur, en amont de la turbine. Comme le montre la photo du montage à la figure 16, une vanne d’isolation est mise en place sur la liaison externe de pression entre l’admission et la chambre de pression derrière le palier axial. La lubrification des paliers est effectuée sporadiquement par une injection d’huile au moyen d’une pipette ou d’une seringue. La pression maximale du circuit d’air est de 8 barg. Le démarrage de la turbine s’est effectué simplement en augmentant la pression à l’entrée de la turbine. 5.2.1 Tests fonctionnels à air comprimé pour le module HP
Pour la turbine mono-étagée HP comme illustrée sur la photo ci-dessous, une pression d’entrée de 4-5 barg est nécessaire pour la faire démarrer.
Figure 5-1 : Turbine HT Scroll montée avec un étage HP et connexion pour tests à air comprimé
Une mesure de la vitesse de rotation est effectuée mécaniquement en appliquant un appareil compte-tour sur l’arbre, de l’autre côté du module de détente par rapport au
Source: Kane et al., 2009
2 herme3c scrolls in series:
Net power: 3 kWe, efficiency
ORC: 10-‐12%, Tev=141C and
Tcd=35C
12
Technical constraints
Built-‐in volume ra3o
Comparison of a variable (leX) and a
constant (right) wall thickness
geometries with the same volume
ra3o (r
v= 5)
Isentropic efficiency as a func3on
of the compactness factor
Ø
Variable wall thickness scrolls: allows to generate more compact geometries.
Hence, higher volume raWo can be achieved in pracWce (MIT/ULg)
13
Technical constraints
Supply pressure losses
The Japan Society of Mechanical Engineers
14
Technical constraints
Pressure losses
Piston expanders
Inlet valves:
o Source of pressure losses
o different families of inlet valves: Sliding valves, Rota3ng valves,
Poppet valves
Source: Amovis, 2006
Outlet valves:
o F.i., use of exhaust ports (vs valves) allows for
•
thermal “coherence” (cross flow vs uniflow)
•
Recover leakages through piston rings
o Use of exhaust ports will lead to larger compression work (fluid is
recompressed earlier) and lower fluid mass flow.
15
Technical constraints
Supply pressure losses
Scroll expanders
Suc3on port blockage
Subdivision of suc3on
chamber (end of suc3on)
(Yanagisawa et al., 2001)
0 1 2 3 4 5 6 7 3.5 4 4.5 5 5.5 6 6.5 7 7.5x 10 -5 θ [rad] A su ,su c [ m 2 ] 0 0.5 1 1.5 x 10⁻⁴ 1 1.5 2 2.5 3 3.5 4 4.5 5 5.5 6x 10 5 V [m3] P [Pa ] ← beginning of expansion Psu Pex
16
Technical constraints
Supply pressure losses
Screw expanders
Gdansk University of Teehnology
Dortmund University of Teehnology
and between the working charnbers on the low and high prcssure sides of the machine respectively. The rotor geometry
determines the length and form of the gaps [3].
Volume curve and in/er area
The volume curve represents the volurnetric progression of the working chamber depending on the rotation angle of the male
rotor. In the zero position of the male rotor the volume of the working eh amber under examination is also zero (Fig.2). The
volume curve characteristically shows a continuous slope up to the point where full profile intermeshing has taken pi ace,
followed by a linear progression, anel a eliminishing rise up to the point where rnaxirnum charnber volume is reacheel.
The inlet area, which depends on the rotation angle. is the
eross-section area which is available for the working fluid to
flow through during the charging phase. This area is formed by the apertures in the housing and thc rotor teeth, which circulate
past these gaps, covering and uncovering parts of them. The
inlet area can be represented as a function of the male rotor
rotation angle. analogous to the volume curve. Depending on
the profile, the devclopment 01'the inlet area frequently begins
at a rotation angle differing from the zero position of the male rotor. The reason for this is a tooth gap area opening at the front
face, which runs ahead 01' the actual working chamber, and is
connected to the low pressure side [2]. The inlet area
progression ends with arrival at the control edges, at the
rotational angle which inelicates the theoretical start of
expansion. 500
(::
I
80000...
l
70000 •• 60000 E.g
50000 >.---:
vo: urne CUfVe./
·
<, /
·
·
f\
·
·
/
·
1--1
\ : Inlet area/
.•.. :
.
\V
/
LP, /'··
f
:,
/
control edge :/
:~HP'·
·
I·
contral edge :L/
·
·
:
450r
400 350'"
300 E E 250 ~~
200 (';J 10 150 ~Working cycle of a screw motor
In principle, a working cycle incIudes all processes in the working area, beginning at a particular therrnodynamic state and
ending at the next oecurrence of the same state. The working cycle of a screw motor consists of three characteristic phases:
charging of the working chamber. expansion phase, anel discharge of the working fluid. During thc charging phase, the POl1 on the high pressure side is
charged with the working fluid at high temperature and pressure,
so that the medium flows into the tooth gap behind it through the
inlet area. As the rotor continues to turn. the chamber volume
grows. The charging phase ends when the working charnber no
longer has any connection with the inlet aperture on the high
pressure siele (Fig. 3). As the area of the in let port is small at the
beginning of the cycle, resulting in a high choking effect,
maximum chamber pressure is not achieved immediately, but is
reached as the rotor moves on. This difference eluring the
charging phase between the initial pressure and the maxirnum
pressure in the chamber is characteristic for the charging phase.
This difference is the result of pressure loss causeel by choking
as the fluid flows in, and gap losses from the working chamber.
A further aspect of the real-Iife charging process is that Fig.3:
expansion begins before the contro I edge on the high pressure
side has been reached. The pressure gradient at the end of the
charging process is already comparable with that during the first
expansion phase beginning at. when the control edges have been reached. The reason for the early start of expansion is
essentially a combination of continuously rising chamber volurne combined with reducing area at the inlet pOI1. The point at
which expansion actually starts is inherent in the system, and also occurs in an ideal scenario where choke effects and gap
losses are ignored.
:;; 40000 .<J E 30000
'"
.c u Vth.e~ '0000 100 50 100000 o o 50 '00 150 200 250 300 350 400 450 500o rotanon angle ['1 • onAt the start 01' the expansion phase. the operaring behaviour of the screw motor is mainly influenced by gap flows, In oreler to
assess the effect of gap flows on the energy conversion rating of the motor, a distinction has to be rnade between lass flows out
of the working chamber under exami nation and flows into the chamber through other gap interconnections. Compared with
isentropic expansion, the actual pressure progression during initial expansion rises more steeply in the theoretical
representation. The reason for this is that the fluid losses from the chamber are proportionally higher than the gains. As rotation
continues, real and isentropic charnber pressures converge, until, in the seconcl phase 01' expansion, pressures during the real
process exceecl those for the isentropic expansion process. The more gradual pressure progression duri ng the real process is a
conscquence of flows into the working chamber from those following it. This fluiel eloes not tlow directly into the low-pressure
side 01' the motor, but helps to sorne extent to fill the expancling chamber uncler consideration, applying power to the rotor
Fig.2: Inlet area and volume curve as a function of the male
rotor rotation angle on a typical steam-powered screw
motor
o~~~~~~~~---+---+---~
o 20000 40000 60000
chamber volume [mm'l --- ••.
80000
Charnber pressure progression
chamber volume with • real and
• isentropic expansion phases
depeneling
Source: Brümmer, 2011 and 2012
1478, Page 2
International Compressor Engineering Conference at Purdue, July 16-19, 2012
working chambers. When the rotors in a displacement machine rotate, typical cyclical changes in the volume of the working chambers occur. Several operating cycles take place sequentially, during which the working chambers on the high pressure side are continually enlarged during the charging phase, while those on the low pressure side reduce in size as they are emptied. Via areas in the housing, connections between the working chambers and the inlet and outlet ports are created, according to the rotation angle of the rotors. The chambers are normally enclosed except for the rotor clearances. The rims of these apertures, those which close off the charging phase and open for the discharge phase, are referred to as control edges. The rotation angle positions of the control edges determine the internal volume changes in the working chambers.
In displacement machines, there is always an important functional separation of moving and stationary parts. The relative movement between the rotors and the internal surfaces of the housing inevitably results in gaps, which prevent mechanical friction between the rotors, and also between the rotors and the housing. There are various ways in which the gaps influence the operational efficiency and security of the machine. They are responsible for connections between the individual working areas, and between the working chambers on the low and high pressure sides of the machine respectively (Zellermann, 1996). The rotor geometry determines the length and form of the gaps.
2.1 Loss Mechanism
The description of loss mechanisms during the working cycle of a screw motor is carried out on a typical machine, selected with reference to the indicator diagram in Fig.1.
0 1 2 3 4 5 6 7 8 0 20000 40000 60000 80000 100000 Kammervolumen VK [mm3] D ruc k pK [ ba r]
Figure 1: Chamber pressure progression dependent on chamber volume with real and isentropic charging /
expansion phase. (Hütker and Brümmer, 2010)
As the inlet opening has a small area at the start of the working cycle, thus resulting in a high choking effect, maximum chamber pressure is not established instantaneously, but builds up gradually as the rotor turns. The pressure difference between the inlet pressure pi and the chamber pressure pc is characteristic for the charging phase.
This pressure difference results from choking losses during inflow, on the one hand, and from gap mass flows, on the other hand. A further characteristic of the real charging procedure is the start of expansion before the high pressure side control edge is reached. The pressure gradient at chamber volume Vex already resembles that of the
first expansion phase as the control edge is reached from Vex,th on. The reason for the early start of real expansion is
mainly the combination of continually rising chamber volume and reduction in the area of the inlet opening towards the end of the charging phase. This early start is an inherent part of the system and it also occurs in an ideal simulation, ignoring choking and gap loss factors which result from flow obstruction in the inlet cross-section.
HP control edge LP control edge Vex,th cha mb er pres sure [1 0 5 Pa ] chamber volume [mm³] isentropic expansion real expansion
Supply port cross
sec3onal area shrinks to
zero and volume
chamber is increasing
Supply port cross
sec3onal area and
volume start from zero
(choked flow)
17
Technical constraints
Leakages
DeformaWon of
P-‐V diagram
18
Technical consideraWons
Leakages and lubrica3on
Screw
o Oil used for lubricaWon and clearance gap sealing
o Synchronized machines can be oil-‐free
Ø
Unsynchronized
ü
Approx. 90% of the sold screw
compressors (Brümmer, 2012)
ü
Oil injected for rotors and bearing
lubricaWon (+sealing)
ü
Be`er energy performance
ü
Simpler, lighter, smaller size
Ø
Synchronized:
ü
Higher )p speed: 60-‐120 m/s against
20-‐40 m/s for lubricated machines
(Brümmer, 2012)
ü
No oil (gears are greased lubricated)
Pumps, Compressors and Process Components 2012 125
Compressors
Screw expander
Regarding the system parameters, it is evident that, for the reasons ini-tially mentioned, a superheating of the working fluid Ethanol is disad-vantageous. Furthermore, an increa-sed inlet pressure (here 40 bar) in con-nection with an increased internal
ever the maximum chamber pressure is considerably below the applied in-let pressure. The compression work ra-tio as well as the volumetric efficien-cy is correspondingly low. At the same time, the dimensions of the machine are increasing in relation to the inlet pressure so that the internal power reaches its maximum. With regard to other geometrical parameters it is to be noticed that a relatively small wrap angle of e. g. = 200° is advan-tageous and the combination of teeth numbers at male and female rotor as well as the L/D-ratio play a rather mi-nor role concerning the maximum possible internal power [4].
The effective output power of this screw expander calculated in design phase II is shown in Figure 4 over the system mass flow for different MR speeds. Here, a reduced system mass flow at fixed speed can only be rea-lized via reduced inlet pressure. Accor-dingly, the output power falls linearly with the mass flow. Due to the fixed internal volume ratios, overexpansion inside the screw expander occurs with decreasing inlet pressure. Apart from friction losses, the compres sion work required to compensate overexpan-sion offsets the effective area in the in-dicator diagram in case of diminishing volume ratio (here vi = 8) turns out to
be an advantage. Due to the large in-ternal volume ratio, the inlet area of the screw expander is small (Fig. 1). In order to never theless realize a suf-ficient chamber filling, a supercriti-cal influx is advantageous. Then
how-Fig. 3: Exemplary presentation of the design variant SK1D
Fig. 4: Effective output power over system mass flow for different MR speeds (inlet pressures)
19
Technical consideraWons
Leakages and lubrica3on
Scroll
o Refrigerant compressors (hermeWc or open-‐
drive) are lubricated
o Few records on refrigerant oil-‐free machines.
𝜀 =
𝑊̇
𝑀̇(ℎ − ℎ
,)
(2)
It should be noted that the traditional definition of the isentropic effectiveness cannot be used
in this case because this definition is valid for adiabatic processes only. In the case of
volumetric expanders, even insulated devices exchange a non-negligible amount of heat with
their environment (Lemort, 2011). The relation between both definitions can be obtained by
combining eq. (3) with the first law of thermodynamics:
𝜀 =
̇ .( ̇ , )=
̇ .( ) ̇ ̇ .( , )=
,−
̇ ̇ .( , )(3)
Eq. (3) shows that both definitions only agree if the ambient heat losses Q̇
are negligible.
As indicated in
Figure 4Figure 4
, the efficiency curve presents a maximum which is due to the
fixed built-in volumetric ratio of the expander.
Figure 3 : over/under expansion losses
Figure 6 : shaft power vs. pressure ratio
4.2 Empirical expression of the expander performance
To obtain a generic non-dimensional performance curve of the expander, a fitted expression
of the effectiveness can be defined using carefully selected input variables. If ambient heat
losses are neglected, scroll expanders can indeed be modeled by their isentropic effectiveness
and filling factor as defined in Eq. (2) and (4).
𝜑 =
𝑀̇𝑣
𝑉̇
The three selected working conditions are the inlet pressure 𝑝 , the rotational speed 𝑁 and
the pressure ratio over the expander
𝑟 since they turned out to be the main representative
variables of the working conditions. The analytical form of the empirical expression was
0 0.5 1 1.5 2 2.5 2 3 4 5 6 7 8 Sh a ft p o w e r [k W ] Pressure ratio 2000 rpm (12 bar) 2500 rpm (12 bar) 3000 rpm (12 bar) 3500 rpm (12 bar) 2500 rpm (9 bar) 3000 rpm (9bar) 3500 rpm (9 bar)
20
Technical consideraWons
Leakages and ubrica3on
o Air compressors (open drive, kinemaWcally rigid) can
be oil-‐free. Use of a )p seal: limited operaWng life.
o When retrofi`ed as expanders: (-‐) Wghtness,
volumetric performance
o SoluWon proposed by Air Squared: 10 kWe, 155 cc/
rev, rvin: 5.25, magneWc coupling, dry/lubricated
50 55 60 65 70 75 80 2,5 3,5 4,5 5,5 6,5 7,5 Ex pa nd er is en tr op ic e ffi ce nc y [%] Pressure ra)o [-‐] 2000 rpm (12 bar) 2500 rpm (12 bar) 3000 rpm (12 bar) 3500 rpm (12 bar)
Open-‐drive oil-‐free machine (R245fa)
Source: Declaye et al., 201221
Technical consideraWons
Leakages and design
1371, Page 4
International Compressor Engineering Conference at Purdue, July 16-19, 2012
Two further constraints are needed on the scroll geometry in order to fix the rest of the scroll geometry. Either ϕo0
or ϕi0 is a free variable, the other being fixed by the scroll wrap thickness for a given base circle radius. Increasing
the value of ϕi0 just rotates the scroll wrap, so for simplicity, ϕi0 is set to zero. The value of ϕos is set to 0.3 radians.
Therefore, with the additional constraints imposed here, there remains just one free variable, which can either be taken to be the scroll wrap height hs or the base circle radius rb, and here the base circle radius was taken as the free
variable with the height adjusted to meet the displacement constraint. A method is presented in the next section to optimize the selection of the base circle radius.
With these constraints, it is possible to obtain an analytic solution for the relevant scroll wrap parameters. The outer involute initial angle is then given by
0 /
o ts rb
(6)
and after some algebra and simplification, the height of the scroll wrap is given by
2 0 0 2 ( )(2 3 ) disp s b ratio o os o V h r V (7)
and the ending angle of the scroll is given by
0 2 0 3 2 4 ( ) disp o ie s b o V h r (8)
where both the fixed and orbiting scrolls have the same ending angle. If another set of constraints is desired, it is possible to use a non-linear solver to obtain the scroll wrap geometry.
For the same volume ratio, scroll wrap thickness and displacement, the larger rb is, the smaller hs must be to
maintain the same displacement, volume ratio and scroll wrap thickness. This yields a family of solutions from a very narrow cylinder to a “pancake” scroll design. Selected members of this family are shown in Figure 5. All scroll wraps are plotted at the same scale.
Figure 5: Family of scroll wraps for a volume ratio of 2.7, displacement of 104.8 cm3, and wrap thickness of 4.66 mm
3. DERIVATION OF OPTIMAL BASE CIRCLE RADIUS
As shown in the previous section, for a given volume ratio, displacement, and scroll wrap thickness, a family of different scroll wraps can be obtained. The range of scroll wraps, from a narrow cylinder to a pancake scroll, offer different performance due to the variation in the leakage rates. It is therefore useful to develop a simple model for the leakage terms in order get a first guess for the optimal scroll wrap geometry from a leakage standpoint. In the
!
1371, Page 6
International Compressor Engineering Conference at Purdue, July 16-19, 2012
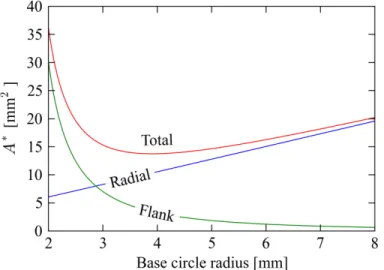
and the results for the effective leakage areas as a function of base circle radius for a volume ratio of 2.7 and displacement of 104.8 cm3 are shown in Figure 6. The effective radial leakage increases quasi-linearly with the base circle radius, while the effective flank leakage decreases with the base circle radius. Under these constraints the sum of the two terms yields a minimum effective leakage area at a base circle radius of 3.91 mm.
* * *
total radial flank
A A A (16)
Figure 6: Effective flank and radial leakage areas for compressor with volume ratio of 2.7, displacement of 104.8 cm3, scroll thickness of 4.66 mm
A numerical minimization routine can be employed to determine the optimal base circle radius that minimizes Atotal
*
over a range of displacement and volume ratios for a fixed scroll wrap width of 4.66 mm. Both flank and radial leakage gap widths are set to 12 µm. The results of this analysis are shown in Figure 7. The optimal base circle radii obtained from the detailed compressor modeling for the Liquid-Flooded Ericsson Cycle and the Liquid-Flooded CO2
analyses (Bell, 2011) are also overlaid in order to demonstrate the effectiveness of this method for calculating an approximate optimal base circle radius. While both of these sets of optimal geometry are based on a liquid-flooded compressor, it is interesting to note that their optimal base circle radii follow closely with the model presented here. The Python code required to carry out the optimization is listed as the appendix.
It is straightforward to generate a similar plot for a different scroll wrap thickness. These results show that for a given displacement, as the volume ratio increases, the optimal base circle radius decreases. Furthermore, for a given volume ratio, as the displacement is increased, the optimal base circle radius increases. This chart can be generally employed in the design of scroll wraps, whether for flooded or dry compression applications. The inclusion of geometrically-dependent mechanical losses and scroll wrap manufacturing cost would result in different optimal scroll wrap geometry.
Source: Bell, et al. 2012
22
Technical consideraWons
Two phase gas-‐liquid
Screw
o Largest expansion machine handling 2-‐phase
flows: up to 85% in mass of liquid (Öhman,
2012).
o Use of ammonia has been reported recently
(Öhman, 2012): Waste heat recovery ORC in
a pulp mill, 750 kWe
Source: Smith 2009
o Wet steam cycle as an
alternaWve to ORC for heat
recovery in the range of
300-‐400°C (Smith et al.,
2009)
4.1. Practical aspects
Several practical issues have been overcome during the test period, a significant such was the notoriously difficult task of measuring the waste water flow correctly. (As the variation is significant an accurate flow measurement is required in order to evaluate power plant efficiency. Unfortunately that task failed several times delaying the collection of proper data.)
The ORC power plant is installed according to the Swedish Refrigeration Industry Code rigorously addressing the validation of safety[5]. As the MUNKSJÖ plant at Aspa already had experience from handling ammonia this did not cause any delays to the project. Fouling and similar issues in heat exchangers were expected but has not been experienced up to the time of writing this paper.
4.2. Functional aspects
The power plant is fully automatic except for restart after fault alarm. In this situation the plant is started remotely by the plant central operations.
Synchronisation between the generator and the grid net is automatic. Starting time is 0.5e2 min to synchronisation, seeFig. 5, and further 1e2 min to full load.
NPO (Net Power Output) defined as measured at the walls of the ORC unit, has exceeded predictions mainly due to the lack of heat exchanger fouling.
During the commercial operation availability has been good although the measured period was short. An analysis of the avail-ability will be made after 12 months commercial operation.
4.3. WHR efficiencies
Electric output ratio, or first law thermal efficiency, is of limited value in determining LTPC-efficiency with finite heat source and heat sink. The size of the ORC has a larger impact on thermal efficiency than the quality of the process or its components, as indicated in[3].
Table 2
Cooling water temperature at plant.
Jan Feb Mar Apr may Jun Jul Aug Sept Oct Nov Dec
3 2 6 8 13 16 21 21 14 8 5 4
Table 3
Technical data for the ORC power plant in Aspa.
Power 950 kVA/50 Hz Length 11 m
Voltage 500 V Height 4 m
Generation Synchronous Width 3.5 m
Media NH3 Heat source Waste water
Weight 27.000 kg Heat sink Lake water
Fig. 1. Waste heat recovery at the MUNKSJÖ pulp mill at Aspa.
H. Öhman / Energy xxx (2012) 1e6 3
Please cite this article in press as: Öhman H, Implementation and evaluation of a low temperature waste heat recovery power cycle using NH3in an Organic Rankine Cycle, Energy (2012), doi:10.1016/j.energy.2012.02.074
Source: Öhman, 2012
o Dortmund Univ. (Prof. Brümmer)
is invesWgaWng liquid injecWon as
a way to increase volumetric
performance
23
Technical consideraWons
Two phase gas-‐liquid
Scroll
o No valves, no clearance volume => Flooding expansion is
possible
o Flooding experienced on automoWve compressors fed
with a mixture of oil and nitrogen (Bell et al., 2012).
0 0.2 0.4 0.6 0.8 1 1 1.5 2 2.5 3 xl [-] V ol u m et ri c E ffi ci en cy [-] Increasing ∆p Expander (N=875) Expander (N=1167) Expander (N=1750) Compressor
Figure 7: Experimental volumetric efficiency of scroll machines
0 0.2 0.4 0.6 0.8 1 0.3 0.4 0.5 0.6 0.7 0.8 0.9 1 xl [-] O ve ral l Is en tr op ic E ffi ci en cy [-] Compressor Expander (N=1750) Expander (N=1167) Expander (N=875)
Figure 8: Experimental overall isentropic efficiency of scroll machines
The fundamental goal of liquid flooding is to approach
isothermal compression and expansion processes. As
shown in Figure 10, the ratio of the high to low tempera-ture for the compressor and the expander both approach 1.0 as the oil mass fraction increases, that is the process becomes more and more isothermal. In the compressor, the high temperature is the outlet temperature, and in the expander, the high temperature is the inlet temperature.
0 0.2 0.4 0.6 0.8 1 0.6 0.65 0.7 0.75 0.8 0.85 0.9 0.95 1 xl [-] In te rn al Is en tr op ic E ffi ci en cy [-] Compressor Expander (N=1750) Expander (N=1167) Expander (N=875)
Figure 9: Experimental internal isentropic efficiency of scroll ma-chines
The difference in slope for the scatter plots for both com-pressor and expander is due to the difference in pressure ratios experienced by the two machines. Since the test rig is quite large with significant piping and a large number of fittings, the pressure drop between the compressor and expander is quite large. As a result, the imposed pres-sure ratio on the compressor will always be higher than that imposed on the expander. In the limit of no pressure drops in the system, the two curves should come signifi-cantly nearer. There will still be some difference in slope due to differences in scroll machine efficiency, manifesting itself as a difference in the outlet temperature.
4. Model Validation
After developing a detailed component model for both the compressor and the expander with flooding, it is nec-essary to validate the model against experimental data as well as tune several parameters difficult to estimate
directly. The scroll machine models operate as in the
schematic shown in Figure 11, where all the parame-ters listed as model input parameparame-ters must be estimated, tuned, or correlated based on physical input parameters. 4.1. Compressor Model Validation and Model Tuning
Tuning of the compressor model is carried out in a two-step process. First the mass flow rate is tuned based on leakage and pressure drop parameters, and then the shaft power is tuned based on mechanical loss and external heat transfer parameters.
6
Expander fed with a mixture of nitrogen
and oil (up to 80% in mass of oil)
Ericsson cycle cooler (quasi-‐isothermal
compression and expansion)
24
Technical consideraWons
Two phase gas-‐liquid
Flooded ORC cycles:
Research at Purdue UniversiWes on scroll
expanders (Brandon Woodland from Groll’s
and Braun’s team)
ü
Increase in expander power
ü
Increase in refrigerant temperature at
expander outlet
ü
Ability to adjust the built-‐in volume raWo
of the expander « seen » by the
refrigerant
ü
Existence of an opWmal mass raWo of oil
0 1 2 3 4 5 6 7 8 0 2.5 5 7.5 10 12.5 15
Mass ratio of oil to refrigerant [kgoil / kgrefrigerant ]
R e la ti v e n e t w o rk i m p ro v e m e n t [% ] Isopentane Isopentane R245fa R245fa R134a R134a Ammonia Ammonia Water Water Evaporating temperature : 90°C
Figure V.2 shows a schematic of the ORC cycle with regenerator and flooded expansion. The flooded expansion is carried out with oil. An oil loop is therefore added to the basic ORC. It is composed of a pump, a heater and an oil separator. The oil is pumped to the same pressure as the high pressure line on the refrigerant side. It is then heated to the same temperature as the superheated refrigerant after the evaporator. Oil and refrigerant are then mixed before entering the expander. After the expansion process, they are separated in the oil separator. The oil is pumped back to the oil heater, whereas the refrigerant, st
temperature, goes through the regenerator to preheat the refrigerant exiting the pump and reduce the heat transfer rate at the evaporator.
Figure V.2: Schematic of the ORC cycle with regenerator
V.2 First approach
-This initial exploration of flooded expansion
Solver, S.A. Klein). The compressor lubricating oil zerol medium and different working fluids are considered.
V.2.1 Oil properties
The zerol-60 is an alkyl-benzene lubricant oil for compressors. Unfortunately, its properties are not currently available in EES
a function of temperature as follows
shows a schematic of the ORC cycle with regenerator and flooded expansion. The ed out with oil. An oil loop is therefore added to the basic ORC. It is composed of a pump, a heater and an oil separator. The oil is pumped to the same pressure as the high pressure line on the refrigerant side. It is then heated to the same temperature s the superheated refrigerant after the evaporator. Oil and refrigerant are then mixed before entering the expander. After the expansion process, they are separated in the oil separator. The oil is pumped back to the oil heater, whereas the refrigerant, st
temperature, goes through the regenerator to preheat the refrigerant exiting the pump and reduce the heat transfer rate at the evaporator.
: Schematic of the ORC cycle with regenerator and flooded expansion
- Fixed expander isentropic efficiency
exploration of flooded expansion was carried out in EES (Engineering Equation The compressor lubricating oil zerol-60 is investigated as the
medium and different working fluids are considered.
Oil properties
benzene lubricant oil for compressors. Unfortunately, its properties
EES. However, its specific heat and density can be expr
a function of temperature as follows [11]:
= +
78 shows a schematic of the ORC cycle with regenerator and flooded expansion. The ed out with oil. An oil loop is therefore added to the basic ORC. It is composed of a pump, a heater and an oil separator. The oil is pumped to the same pressure as the high pressure line on the refrigerant side. It is then heated to the same temperature s the superheated refrigerant after the evaporator. Oil and refrigerant are then mixed before entering the expander. After the expansion process, they are separated in the oil separator. The oil is pumped back to the oil heater, whereas the refrigerant, still at high temperature, goes through the regenerator to preheat the refrigerant exiting the pump and
and flooded expansion
Fixed expander isentropic efficiency
(Engineering Equation 60 is investigated as the flooding
benzene lubricant oil for compressors. Unfortunately, its properties . However, its specific heat and density can be expressed as
(V-2)
25
Technical constraints
Inlet temperature
Piston
o High temperature allowed
o Could be used with high pressure/t° steam
Scroll
o HermeWc compressors: discharge temperature limited to
145°C-‐160°C
o Temperature limited by thermal expansion and oil degradaWon
Ø
PotenWal advantage of Wp seal vs compliant
(clearance allows for
dilataWon)
o Currently a lot of development for high temperature heat pumps
Ø
f.i. Altereco project
o Records in literature:
Ø
Air expander: 165°C (Kane et al., 2009)
Ø
Steam expander: 215°C (Lemort et al., 2006)
! (Source: Inaba et al., 1986)
26
Content of the presentaWon
1. IntroducWon
2. Technical constraints
3. Modeling and Simula)on
4. SelecWon
27
Modeling and simulaWon
3 levels of models:
Ø
Empirical or “black-‐box” models:
§
Very low computaWonal Wme
§
Very robust
§
No extrapolaWon beyond calibraWon range
Ø
Semi-‐empirical or “grey-‐box” models
§
Low computaWonal Wme
§
Robust
§
Physical meaning of parameters
§
ParWal extrapolaWon
Ø
Determinis)c or “white-‐box” models
§
Large computaWonal Wme
§
Exact physical meaning of parameters
Dynamic simula3on
of ORCs
Steady-‐state
simula3on of ORCs
(design of ORC)
28
Modeling and simulaWon
Semi-‐empirical
sh
W
• S=ct V=ct S=ct ΔPsu ΔP ex suh
m
• exh
m
• leak m• inm
• su su,1 2 3 ex,3 ex,2 ex ambQ
• 6 System layout 5 4 suQ
• su,2 lossW
• 0 •m
V=ct 1 exQ
• ex,1 shW
• S=ct V=ct S=ct ΔPsu ΔP ex suh
m
• exh
m
• leak m• inm
• su su,1 2 3 ex,3 ex,2 ex ambQ
• 6 System layout 5 4 suQ
• su,2 lossW
• 0 •m
V=ct 1 exQ
• ex,1Scroll/screw expander
Limited number of parameters (9) with physical
29
Modeling and simulaWon
Semi-‐empirical
Open-‐drive oil-‐free scroll expander
0.016 0.018 0.02 0.022 0.024 0.026 0.028 0.03 0.032 0.034 0.036 0.038 0.04 0.03 0.035 0.04 0.045 0.05 0.055 0.06 0.065 0.07 0.075 0.08 0.085 vr,su,exp [m3/kg] Mr [ k g /s ] 2296 rpm 1771 rpm 1771 rpm 2660 rpm 2660 rpm 2% error bars measured measured calculated calculated n M AUamb [W/K] AUsu [W/K] AUex [W/K] [kg/s] Aleak [mm2] rv,in [-] Vs [cm3] dsu [mm] Tloss [N-m] 6.4 21.2 34.2 0.12 4.6 4.05 36.54 5.91 0.47
also, it can be observed that the agreement is good. The maximum deviation between the model predictions and the measurements is 5%.
Fig. 10 compares the evolutions of the exhaust temperature (measured and predicted by the model) with the mean measured temperature of the fluid between the expander supply and exhaust.
The model predicts the exhaust temperature within 3 K. How-ever, the model seems to slightly overestimate the exhaust tem-perature for high expander mean temtem-peratures and to slightly underestimate it for the lower mean temperatures.
This figure also shows the evolution of the predicted exhaust temperature if the model did not account for ambient losses. The deviation between the predicted exhaust temperature and the measured one increases with the mean temperature. This confirms that the model should account for the ambient losses to better pre-dict the exhaust temperature.
5. Model analysis
The validated model of the expander is used to quantify the dif-ferent losses and to indicate how the design of the expander might be altered to achieve better performances.
Fig. 11shows the evolution of the overall isentropic effective-ness with the pressure ratio imposed to the expander. Operating conditions, related to one of the measured performance points, correspond to a supply pressure of 10.03 bar, an exhaust pressure of 2.01 bar, a supply temperature of 142!C and a rotational speed of 2296 rpm. The measured overall isentropic effectiveness for this operating point is also indicated inFig. 11(with error bars associ-ated with measurement uncertainties).
The evolution at the top of the figure is predicted by a model that only accounts for under- and over-expansion losses. The effec-tiveness goes through 1.0 at a pressure ratio equal to the internal pressure ratio (Pad= Pex). For smaller and larger pressure ratios,
the fluid is over-expanded and under-expanded respectively. Experimental results showed that the maximum achieved pressure ratio was around 5.5. If much larger pressure ratios were imposed, a machine with a larger built-in volume ratio than 4.05 would yield better performances.
The overall isentropic effectiveness decreases when accounting for the heat transfers in the modeling because of the supply cooling down of the fluid. This decrease could slightly be tempered by bet-ter insulating the expander (in the limiting case, AUamb=0 W/K).
Introducing the mechanical losses and the supply pressure drop in the modeling largely reduces the isentropic effectiveness. Fur-ther work should investigate the possibility of reducing mechani-cal losses by using better adapted tip seals. As already mentioned by Yanagisawa et al. [5], the supply pressure drop is an inherent characteristic of the scroll machine. A detailed modeling of the ex-pander should answer the question of how to reduce this pressure drop by modifying the expander geometry.
The internal leakage is responsible for the major part of the per-formance loss. Under the assumption that the tip seals work cor-rectly (they seal the radial gap between the tip of each scroll and the plate of the opposite scroll), the identified leakage area (Table 3) may be explained by a large flank clearance between the two scrolls. This large clearance is characteristic of scroll machines operating with a kinematically rigid configuration, where a flank gap is maintained.
6. Conclusions
An experimental study was carried out on a prototype of a scroll expander integrated into an Organic Rankine Cycle. The evolution of the expander performance, expressed in terms of global isentro-pic effectiveness and filling factor, with the operating conditions
70 80 90 100 110 120 130 140 150 50 60 70 80 90 100 110 120 130 140 150 (Tsu + Tex,meas )/2 [C] Tex [ C ] Tex,meas Tex,meas Tex,calc Tex,calc 3K error bars Tex,calcwith Qamb=0
Tex,calcwith Qamb=0
Fig. 10. Evolution of the exhaust temperature (measured and predicted by the model) with the mean fluid temperature between the expander supply and exhaust.
3 4 5 6 7 8 9 10 0.55 0.6 0.65 0.7 0.75 0.8 0.85 0.9 0.95 1 1.05 Psu / Pex [-] εs [ -]
+ built-in volume ratio
+ heat transfers (AUamb=0 W/K)
+ heat transfers (AUamb=0 W/K)
+ mechanical losses + mechanical losses + pressure drop + pressure drop + leakage + leakage
+ heat transfers (AUamb=6.4 W/K)
+ heat transfers (AUamb=6.4 W/K)
measured performance
Fig. 11. Evolution of the calculated overall isentropic effectiveness with the imposed pressure ratio.
V. Lemort et al. / Applied Thermal Engineering 29 (2009) 3094–3102 3101
Predic3on of the mass flow rate
Impact of pressure losses, fric3on,
leakages
30
Modeling and simulaWon
Semi-‐empirical
sh
W
• S=ct V=ct S=ct ΔPsu ΔP ex suh
m
• exh
m
• leak m• inm
• su su,1 2 3 ex,3 ex,2 ex ambQ
• 6 System layout 5 4 suQ
• su,2 lossW
• 0 •m
V=ct 1 exQ
• ex,1 shW
• S=ct V=ct S=ct ΔPsu ΔP ex suh
m
• exh
m
• leak m• inm
• su su,1 2 3 ex,3 ex,2 ex ambQ
• 6 System layout 5 4 suQ
• su,2 lossW
• 0 •m
V=ct 1 exQ
• ex,1 P re ssur,ba r Volume,m3 2 4 3 Vs Psu,2 Pex,2 P3 5 6 V0 P6 ΔPsu Pex Psu ΔPex 1 VSfa VSfp P re ssur,ba r Volume,m3 2 4 3 Vs Psu,2 Pex,2 P3 5 6 V0 P6 ΔPsu Pex Psu ΔPex 1 VSfa VSfpPiston expander
Re-‐compression of gas at the end
31
Modeling and simulaWon
Semi-‐empirical
Axial piston expander
Predic3on of the shaX power
Isentropic effec3veness vs
32