Woody plant cover estimation in drylands from Earth Observation based
seasonal metrics
Martin Brandt
a,⁎
, Pierre Hiernaux
b, Torbern Tagesson
a, Aleixandre Verger
c, Kjeld Rasmussen
a,
Abdoul Aziz Diouf
d, Cheikh Mbow
e, Eric Mougin
b, Rasmus Fensholt
aa
Department of Geosciences and Natural Resource Management, University of Copenhagen, 1350 Copenhagen, Denmark
b
Geosciences Environnement Toulouse (GET), Observatoire Midi-Pyrénées, UMR 5563 (CNRS/UPS/IRD/CNES), 14 Avenue Edouard Belin, 31400 Toulouse, France
c
CREAF, Cerdanyola del Vallès, 08193, Catalonia, Spain
d
Centre de Suivi Ecologique, BP, 15532 Dakar-Fann, Senegal
eScience Domain 6, ICRAF (World Agroforestry Center), 00100, Nairobi, Kenya
a b s t r a c t
a r t i c l e i n f o
Article history: Received 17 April 2015
Received in revised form 28 September 2015 Accepted 31 October 2015 Available online xxxx Keywords: Woody cover Phenology Fapar Drylands Sahel Modis Vegetation Multilinear model
From in situ measured woody cover we develop a phenology driven model to estimate the canopy cover of woody species in the Sahelian drylands at 1 km scale. The model estimates the total canopy cover of all woody phanerophytes and the concept is based on the significant difference in phenophases of dryland trees, shrubs and bushes as compared to that of the herbaceous plants. Whereas annual herbaceous plants are only green during the rainy season and senescence occurs shortly afterflowering towards the last rains, most woody plants remain photosynthetically active over large parts of the year. We use Moderate Resolution Imaging Spectroradiometer (MODIS) and Satellite pour l'Observation de la Terre (SPOT)— VEGETATION (VGT) Fraction of Absorbed Photosynthetically Active Radiation (FAPAR) time series and test 10 metrics representing the annual FAPAR dynamics for their ability to reproduce in situ woody cover at 43 sites (163 observations between 1993 and 2013) in the Sahel. Both multi-yearfield data and satellite metrics are averaged to produce a steady map. Multiple regression models using the integral of FAPAR from the onset of the dry season to the onset of the rainy season, the start date of the growing season and the rate of decrease of the FAPAR curve achieve a cross val-idated r2/RMSE (in % woody cover) of 0.73/3.0 (MODIS) and 0.70/3.2 (VGT). The extrapolation to Sahel scale
shows agreement between VGT and MODIS at an almost nine times higher woody cover than in the global tree cover product MOD44B which only captures trees of a certain minimum size. The derived woody cover map of the Sahel is made publicly available and represents an improvement of existing products and a contribu-tion for future studies of drylands quantifying carbon stocks, climate change assessment, as well as parametriza-tion of vegetaparametriza-tion dynamic models.
© 2015 Elsevier Inc. All rights reserved.
1. Introduction
Trees, shrubs and bushes are an important element of savanna eco-systems and for livelihoods in dryland areas dependent on fuel–wood supply. During the past decades, several studies have seriously questioned prevailing narratives of a widespread and Sahel-wide de-crease in woody cover (Rasmussen, Fog, & Madsen, 2001; Rasmussen, Nielsen, Mbow, & Wardell, 2006; Spiekermann, Brandt, & Samimi, 2015), commending the relevance of large scale woody cover monitor-ing systems.
Most studies estimating tree canopy cover with remote sensing rely on high resolution imagery which allow direct mapping at a scale
recognizing trees of a certain size as objects (e.g. Herrmann, Wickhorst, & Marsh, 2013; Karlson, Reese, & Ostwald, 2014; Rasmussen et al., 2011; Sterling & Orr, 2014; San Emeterio & Mering, 2012). However, imageries with a spatial resolution of 1–5 m are cumbersome to process, expensive, susceptible to clouds, and do only provide a static situation for a limited spatial area. Moreover, consider-ing trees as objects, smaller isolated woody plant are missed and indi-vidual woody plants are hard to separate in dense thickets (Spiekermann et al., 2015). Global tree cover products at 30 m using Landsat (Sexton et al., 2013) and 250 m using Moderate Resolution Im-aging Spectroradiometer (MODIS) are trained with higher resolution imagery (Defries, Hansen, Townshend, Janetos, & Loveland, 2000; Hansen et al., 2003) and are available for assessing states of canopy cover and deforestation rates. However, the reliability of these products in semi-arid regions with open tree cover is contested (e.g.Gessner, Machwitz, Conrad, & Dech, 2013; Hansen, Townshend, DeFries, & Carroll, 2005; Herrmann et al., 2013) and limited evaluations against
⁎ Corresponding author at: Öster Voldgade 10, 1350 Copenhagen, Denmark. E-mail addresses:martin.brandt@mailbox.org(M. Brandt),
pierre.hiernaux@wanadoo.fr(P. Hiernaux),verger@creaf.uab.cat(A. Verger),
dioufee@gmail.com(A.A. Diouf),c.mbow@cgiar.org(C. Mbow).
http://dx.doi.org/10.1016/j.rse.2015.10.036
0034-4257/© 2015 Elsevier Inc. All rights reserved.
Contents lists available atScienceDirect
Remote Sensing of Environment
j o u r n a l h o m e p a g e :w w w . e l s e v i e r . c o m / l o c a t e / r s eground observations have been done for drylands in general and for the Sahel in particular.
The leafing of trees and shrubs in semi-arid areas like the Sahel is not temporally uniform. This suggests that large scale woody cover model-ing from moderate to coarse spatial resolution Earth Observation (EO) data can potentially be improved by including vegetation metrics cover-ing various stages of the growcover-ing season cycle, and not only images or variables representing snapshots in time. This is particularly important in the Sahelian zone, where the vegetation is characterized by a rapid phenological cycle driven by the short rainy season where most of the observations in the optical domain are missing or affected by noise due to cloud cover. The spatial resolution of MODIS (250–1000 m) and Satellite Pour l'Observation de la Terre, (SPOT) - Vegetation (VGT) (1000 m) is traditionally considered a limitation for vegetation moni-toring, however, major morphological units, widespread deforestation and regional climate dynamics are visible at this scale and represent the spatial characteristics of the Sahel area (Vintrou et al., 2014). Given the high temporal sampling frequency of MODIS and VGT, noise from cloud cover can be suppressed and various seasonal metrics relat-ed to phenology of the green vegetation mixrelat-ed in a pixel can be derivrelat-ed (Horion, Fensholt, & Ehammer, 2014). Recent studies show that the dominant woody species in the Sahel have a significant footprint in long-term trends of coarse satellite data time series (Brandt et al., 2015), but it remains unclear how woody cover affects the annual vegetation curve as measured by EO data.
We suggest an approach driven by vegetation phenology including in situ measured woody cover data across the Sahel and seasonal met-rics from time series of MODIS and SPOT-VGT. The method is an indirect estimation of the canopy cover of all woody phanerophytes including trees, shrubs and bushes (thus the expression woody cover is used), and is based on the significant difference in phenophases of woody plants as compared to that of the herbaceous plants (De Bie, Ketner, Paasse, & Geerling, 1998; Horion et al., 2014; Wagenseil & Samimi, 2007). In the Sahel, annual herbaceous plants are only green during the rainy season from June to October (depending on the latitudinal po-sition and of the vagaries of annual rain distribution) and senescence oc-curs afterflowering in September towards the last rain events of the season. The leafing of most trees and shrubs is longer (De Bie et al., 1998; Mbow, Chhin, Sambou, & Skole, 2013), with several evergreen species, and many woody species green-up ahead of the rains during the last month of the dry season, while annual herbaceous are depen-dent on thefirst rains to germinate (Horion et al., 2014; Hiernaux, Cissé, Diarra, & de Leeuw, 1994; Seghieri, Do, Devineau, Fournier, et al., 2012). The Fraction of Absorbed Photosynthetically Active Radia-tion (FAPAR) quantifies the fraction of the photosynthetic active radia-tion absorbed by green vegetaradia-tion (Baret et al., 2013; Myneni &
Williams, 1994). FAPAR seasonal metrics derived from EO data
highlighting the differences in phenology between annual herbaceous and woody plants are considered suitable indicators of photosynthetic activity of woody canopies.
Based on the observation that the phenology of woody vegetation in semi-arid areas is distinctive in the dry season, our objectives are (1) to find evidence for the relationship between satellite derived seasonal metrics of FAPAR and in situ measured woody cover, (2) to create a woody cover map for the 1999–2013 period for the Sahel belt, and (3) to compare the modeled and in situ measured woody cover with an existing global tree cover product.
2. Materials and methods 2.1. Conceptual approach
The concept of this study is to establish a multi-linear regression be-tween ground based woody cover measurements from Mali and Senegal and satellite derived seasonal metrics from VGT and MODIS time series (Fig. 1). Bothfield and satellite data are averaged over
their period of acquisition to produce a steady map. Based on the as-sumption that dry season greenness can be used to separate woody from herbaceous production 10 metrics representing the annual FAPAR dynamics are tested to model the total canopy cover of woody plants. The woody canopy cover measured at thefield sites is adjusted prior to correlation with satellite data relating to the degree of leaf-out typically occurring in the dry season months. This phenological correc-tion depends on the typical phenological behavior of the component woody species and is thus site specific. To predict the total woody cover at Sahel scale, the correction is based on an estimated mean phe-nology of all woody plants of the Sahel region.
2.2. Study area
The Sahel extends from the Atlantic Ocean in the west to the Red Sea in the east (approximately 6000 km). The bioclimate is considered trop-ical arid in the north and semi-arid in the south (Le Houérou, 1980; Sayre et al., 2013). The average annual precipitation varies between 150 mm and 700 mm from north to south. The delineation (Fig. 2) is de-rived from African Rainfall Climatology Version 2 (1982–2013) satellite based rainfall data (Jobard, Chopin, Berges, & Roca, 2011). The rainy sea-son is directly linked to the West African Monsoon with a length of 1–4 months, an annual peak in precipitation in August (Barbé & Lebel, 1997), and an increasing rate of annual rainfall along the north–south gradient with approximately 1–2 mm per km (Le Houérou, 1980). The Sahel is subdivided into three biogeographical zones matching the rain-fall zones (Fig. 2): the northern Sahel (Saharo–Sahelian), the central Sahel (Sahelian proper) and the southern Sahel (Sudano–Sahelian) where rainfed crops largely extend. The northern Sahel is characterized by the abundance of spiny trees Acacia (Mimosoidae), Balanites, Ziziphus and also of Capparidaceae. In central Sahel spiny Mimosoidae associate with broadleaf Combretaceae, while in southern Sahel woody plants
are more diverse with the association of Combretaceae with Fabaceae and Rubiaceae. Throughout, the herbaceous vegetation is dominated by annual herbaceous, mainly Gramineae with C4 photosynthesis type (Hiernaux & Le Houérou, 2006). No significant vegetation gradient is present from west to east and the elevation is generally low. Unique datasets of in situ observed woody cover are available for Senegal and the Gourma region, Mali and are distributed over three major rainfall zones (Fig. 2). The study sites cover different ecoregions with sandy and ferruginous soils prevailing. Although there are differences in land-use history between Senegal and Gourma, the two regions share the Sahel monsoonal climate,flora, edaphic traits (range of soil textures, organic and nutrient content) and the pastoral systems, justifying the use of all available ground data for a model being representative at the Sahel scale. The study sites are well described inDiouf et al. (2015);
Brandt et al. (2015);Mougin et al. (2009);Hiernaux et al. (2009)and
Dardel et al. (2014).
2.3. Phenological behavior of Sahelian herbaceous and woody vegetation The herbaceous layer is only short lasting green (less than a 4-month period) in the Sahel (de Vries & Djitèye, 1982; Mougin et al., 2014) caus-ing a strong peak in the seasonality of vegetation durcaus-ing the rainy sea-son. Senescence of the annual herbaceous vegetation shortly after flowering is determined by a biological clock, regardless of eventual late rains (photoperiodicity). The herbaceous vegetation may also die
because of lack of soil humidity following a long interruption in rainfall, without succeeding regrowth if later rain occurs. The standing mass of annual herbaceous vegetation is characterized by a very rapid in-creasing and dein-creasing rate, shown e.g. in a herbaceous growth sim-ulation model inTracol, Mougin, Hiernaux, and Jarlan (2006)or Leaf Area Index (LAI) measurements inMougin et al. (2014). The recur-rent vegetation wilt and die from early September to late October, and remains photosynthetically inactive until the new germination with the onset of the following rainy season. For woody vegetation, six different types of phenological behavior are characterized in
Hiernaux et al. (1994)(Fig. 3): (1) short deciduous with species shedding their leaves at the onset of the dry season (Commiphora africana, Euphorbia balsamifera, Acacia seyal), (2) at the end of the year (Combretum micranthum, Acacia senegal, Pterocarpus lucens) (3) semi-deciduous (e.g. Acacia raddiana, Guiera senegalensis), (4 + 5) two types of evergreens depending on the period of leaf re-newal, either at the onset of the wet season (Balanites aegyptiaca, Combretum glutinosum), or the onset of the dry season (Boscia senegalensis, Maerua crassifolia), and (6) a particular case for Faidherbia albida shedding leaves during the rainy season. For more details and species lists seeDe Bie et al. (1998);Seghieri et al. (2012)andHiernaux et al. (1994). Despite these differences and short deciduous species shedding their leaves early in the dry season, it is hypothesized that the signal from the photosynthetically active woody plants during the long lasting dry season impacts the shape
Fig. 2. Overview of the Sahel zone and location of the 43 ground monitoring sites covering Senegal (west) and the Gourma region in Mali. The Sahel delineation is based on annual average precipitation (African Rainfall Climatology Version 2 1983–2013).
Fig. 3. Seasonal distribution of woody leaf mass depending on the phenological type, modeled within the STEP primary production simulation model (Mougin, Lo Seen, Rambal, Gaston, & Hiernaux, 1995). The months of the wet season during which herbaceous grow are highlighted in a shaded box. Illustrations of typical herbaceous growing curves can be found inMougin et al. (2014).
of the FAPAR curve as derived from continuously recorded satellite data at a 1 km scale.
2.4. Ground based woody cover estimation
The study includes in situ measured woody cover (trees and shrubs regardless of size) data of 43 monitoring sites; 22 in Senegal and 21 in the Gourma region of Mali. Woody cover in Senegal was measured every two years in June, from 1998 to 2013, whereas the Gourma mea-surements consist of data recorded in 1993, 2002 and 2005 (Hiernaux et al., 2009). A method called circular plots census was applied for can-opy cover estimation both in Senegal and Mali (Hiernaux et al., 2009). The crown cover was surveyed using a systematic and replicable sam-pling method. Each monitoring site is a 1 × 1 km plot selected within a homogeneous area of 3 × 3 km and was inventoried through four cir-cular plots of up to one hectare by woody plant category (generally trees/shrubs/bushes), separated by a distance of 200 m along a transect line of 1 km. The size of the circular plots depends on the density of the woody population but includes a minimum of 10 individuals per plot. In each plot the species of all individuals of trees and shrubs were recorded and height and basal diameter of crowns were measured. These mea-sures were averaged per plot and per site providing means and standard deviations of tree and shrub canopy cover, and the contribution of each species to the overall cover. More details on the methods are provided inHiernaux et al. (2009).
2.5. Correcting the relation between in situ woody cover and dry season FAPAR
The signal measured by satellite FAPAR proposed to separate the woody signal from the herbaceous vegetation is not canopy cover but green density of the canopy cover during the dry season. This green density from October to June depends on the phenological behavior of woody species as shown inFig. 3. For example, sites dominated by short deciduous Acacia seyal have a low dry season FAPAR relative to the canopy cover, while a Faidherbia albida dominated stand has the opposite. Thus, the relationship between in situ measured cover and the dry season FAPAR metrics can be adjusted using the phenological behavior of the woody plants from October to June to derive a corrected woody cover. Leaf seasonality of the six types of phenological behavior has been modeled within the STEP (Sahelian Transpiration, Evapora-tion, and Productivity) primary production simulation model (Mougin et al., 1995; Tracol et al., 2006) using data derived from monthly moni-toring of sampled branchlets (1 cm diameter 3 per woody plants– edge, top and interior of the canopy– 6 plant per species and site) from Niono (1979–1983) and Gourma sites (1984–1993) (seeHiernaux et al., 1994) with additional data from the Gourma sites between 2005 and 2010. The monthly distribution of foliage mass expressed as a fraction of the maximum mass is shown inFig. 3and has been extracted for each of the six foliage phenologies to account for the variable foliage density of woody plant species during the dry season. For each of the 43 ground sites, all sampled species were attributed to one of the six phenological behavior classes and thereby given the mean foliage density from October to June (scFD). Then, at site scale, the foliage density of all can-opy cover (tFD) was calculated as the mean scFD of all woody species present at the site weighted by the relative contribution of the species (scWC) to total woody cover of the site (tWC).
As an example, a two species site with C. glutinosum at 20% from 24% total cover (tWC) and a dry season mean foliage density (sdFD) of 0.78 (being evergreen) associated to Sclerocarya birrea at 4% canopy cover and a scFD of 0.28 (being medium deciduous), has a site foliage density of canopy cover tFD = 0.78 (20/24) + 0.28 (4/24) = 0.70. The site's woody cover was then corrected (cWC) by multiplying the in situ cano-py cover with the site foliage density (tFD).
2.6. Satellite products
We used Geoland Version 1 (GEOV1) SPOT VGT and MODIS MOD15A2 FAPAR satellite datasets as a proxy to estimate the photosyn-thetic plant activity for the periods 1999–2013 (VGT) and 2000–2013 (MODIS) (Baret et al., 2013; Fensholt, Sandholt, & Rasmussen, 2004; Yang et al., 2006). We use two different datasets to test the proposed methodology for robustness and data related bias. Both GEOV1 and MODIS products are available at 1 km spatial resolution and were reprojected to a geographical projection system for this study.
The GEOV1 Copernicus global land products are derived from SPOT VGT data using a neural-network machine-learning algorithm (Verger, Baret & Weiss, 2008). Directionally normalized VGT reflectances (Roujean, Leroy, & Deschamps, 1992) from the top of the canopy in the red, near-infrared, and short-wave infrared bands derived from the CYCLOPES processing line (Baret et al., 2007) are used as inputs. The neural network was trained with MODIS and CYCLOPES FAPAR data which were fused by assigning more weight to the CYCLOPES prod-ucts for low FAPAR values and to the MODIS ones for high values (Weiss, Baret, Garrigues, Lacaze, & Bicheron, 2007). The temporal sampling of GEOV1 is 10 day with a 30-day compositing window. Further details for the training of the neural networks and the generation of the GEOV1 product are provided inBaret et al. (2013).
The MODIS FAPAR product relies on a biome dependent look-up table inversion of a radiative transfer model which ingests red and near infrared bidirectional reflectance factor values, their associated un-certainties, the view-illumination geometry, and biome type (within eight types based on the MOD12Q1 land cover map) (Myneni et al., 2002). The MODIS FAPAR product is generated by selecting the maxi-mum FAPAR value in an 8-day compositing period.
A global tree cover product based on MODIS (MOD44B) V501 is in-cluded for comparison purposes and is supposed to map canopy cover of trees greater than 5 m in height, thus not considering small trees, shrubs and bushes, which are included in our in situ data (Townshend et al., 2011; Hansen, DeFries, Townshend, Marufu, & Sohlberg, 2002). MOD44B V501 applies a decision tree using Landsat, Ikonos andfield data training sets and is based on previous work byHansen et al. (2003)andDefries et al. (2000). It is available at annual basis at a 250 m spatial resolution and we resampled it to 1 km using the nearest neighbor technique to match the spatial resolution of the FAPAR prod-ucts used. Then the average values over the period 2000–2013 were computed. For the sake of brevity, we do not provide a comparison with the Landsat tree cover continuousfield data (Sexton et al., 2013) because it was found to be closely related to MOD44B and it compares in a similar way to our estimates.
Polygons were drawn around the homogeneous area (approximate-ly 3 × 3 km) of the ground monitoring sites and all 1 km pixels encompassed by a polygon were averaged for each site. Sites without distinct seasonality (limited EO vegetation seasonality detection ability, next section) were excluded from the analysis, reducing the available Gourma sites from 25 to 21.
2.7. Extraction of satellite seasonal metrics
Seasonal metrics can be highly dynamic (Broich et al., 2014). In the interest of developing a robust and stable relationship between ground observations and satellite metrics, both ground and satellite data were averaged over the period of acquisition prior to extraction of the pixel values. The original temporal frequency for satellite time series was kept, resulting in 8 day (MODIS) and 10 day (VGT) average data.
Timesat was used to derive seasonal parameters from satellite time series (Jönsson & Eklundh, 2004). Timesat has been widely used in the Sahel area to detect seasonal dynamics related to the phenology of veg-etation and describing the shape of the annual vegveg-etation curve reflected in satellite data (e.g.Horion et al., 2014; Herrmann et al.,
summarized inTable 1and illustrated inFig. 4. The values between the end of the growing season (EOS) and the start of the next growing sea-son (SOS) were integrated to a dry seasea-son integral (DSINT) by subtracting the small integral (SINT) from the annual integral. Thus the DSINT also includes the rainy season values below the base level (BASE) (Fig. 4), considering that annual herbaceous spontaneous spe-cies are starting from zero green, while woody plants have already put leaves explaining the level of the BASE being above zero before the first rainfalls at the SOS. The onset of the rainy and dry season is estimat-ed from crossing a defined percentage threshold of the annual ampli-tude (AMP) value. Whereas the standard value of 20% has proven to deliver robust results for the SOS (Horion et al., 2014), the EOS is in flu-enced by several factors and needs to be selected with caution. In addi-tion to woody vegetaaddi-tion, the presence of crops can impact the early dry season signal, since some crops (e.g. millet) remain greener 2–4 weeks longer than the annual grasses. To better separate the core rainy season from influences, the threshold for the EOS was set to 80% of the ampli-tude (Fig. 4). As we expect to capture the contribution of woody plants with the DSINT variable, an integration period starting approximately mid-October is also preferable since some woody plant populations are dominated by short deciduous species (e.g. Acacia seyal) shedding their leaves in the early dry season (Fig. 3). To account for unreliable values extracted in areas of very low vegetation (as no distinct seasonal curve is present for such areas), the woody cover of all pixels with a mean maximum annual FAPARb0.05 and a stddev b0.02 was set to 0.5% (the total absence of shrubs is unlikely at 1 km scale). Wetlands and irrigated areas were masked by excluding areas of high FAPAR valuesN0.2 between late November and February, as only wetlands and irrigated croplands stay dark green during this time.
2.8. Signature of woody cover in the seasonal FAPAR curve
The variation over the year of FAPAR (mean 1999–2013) was com-pared for two sites of contrasting herbaceous/woody vegetation domi-nance within the same rainfall regime in Senegal (Fig. 4). The site C2L4 has a high annual herbaceous biomass (~900 kg dry matter/ha) but low annual woody plant leaf biomass production (~350 kg dry mat-ter/ha) whereas site C3L5 is characterized by high annual woody plant leaf biomass (~ 1850 kg dry matter/ha) and low annual herb biomass production (~500 kg dry matter/ha) (Brandt et al., 2015). Seasonal dy-namics of herbaceous vegetation are closely related to the pulse of rain-fall, and shortly after the herbaceous vegetation maximum (MAX) occurs, senescence starts (around late September). Thus, after the FAPAR values drop following the MAX, woody plants determine the shape of FAPAR curve until the following rainy season. This is illustrated by the high FAPAR values and slow descending rate in the early dry sea-son (October–December) in C3L5 (18% woody cover), as compared to the rapidly decreasing FAPAR in C2L4 (3% woody cover) (Fig. 4). More-over, despite a large difference in total green mass during the wet sea-son (1071 kg dry matter/ha difference), the maximum and amplitude
of FAPAR for the two sites are relatively similar. This shows that the woody plant foliage mass has a lower impact on the annual FAPAR sig-nature as compared to the herbaceous mass, and especially the rainy season months are clearly dominated by the herbaceous cover (see supplementary material for all 43 ground sites). The BASE level again is almost the same at both sites in spite the difference in woody cover, as the deciduous woody plants at C3L5 shed their leaves in the dry sea-son, whereas the evergreen woody vegetation at C2L4 keeps the green leaves throughout the year leading to a stable BASE level. The different phenological behaviors shown inFig. 3are reflected in the FAPAR curves ofFig. 4.
2.9. Variables selection for woody cover modeling
A multiple linear regression model was established between in situ measured observations (cWC) from Senegal and Mali, and seasonal metrics derived from VGT and MODIS FAPAR satellite data. To avoid overfitting and find the minimal adequate model, the number of variables shown inTable 1was reduced. Multicollinearity is known to bias parameters of variable selection and is commonly found for variables influenced by seasonality. The Variable Inflation Factor (VIF) was calculated and used to test all metrics included in the model for multicollinearity and for removal of highly correlated predictors. The re-maining metrics were used in a stepwise regression run in a backward direction, a technique which reduces the number of variables in each step (Chambers & Hastie, 1991). Here, the AIC (Akaike Information Criterion) was used to identify and remove metrics that decreased the overall model quality. The relative contributions of the predictors to the model's total explanatory power were estimated by the LMG (Lindeman, Merenda and Gold) method (a bootstrap measure based on 100 samples) as described inGrömping (2007). This method pro-vides the explaining power of each metric in the model as a share of 100%.
2.10. Woody cover model validation and evaluation
Models with a limited number of observations and a high number of predictors are sensitive to unreliable statistical parameter retrieval (Zandler, Brenning, & Samimi, 2015) and therefore 3 parameters were applied for model validation:
1. Adjusted r2, which is raw r2adjusted to the number of explaining
variables in a multiple regression. The adjusted r2is susceptible to
overfitting but widely used as a common and comparable variable for model validation.
2. A predictive r2is applied to assess the shrinkage of raw r2and the predicting ability of the model, dealing with the overfitting problem (Allen, 1974). The predictive r2is based on a cross validation called
PRESS (predicted residual sum of squares). Unlike the often used bootstrapping technique providing a measure of a model's uncer-tainty, PRESS provides a measure of the model's prediction ability by predicting a number of observations that were not used to estab-lish the model.
3. A cross validation is applied to assess a model's predictive error rate and the cross validated Root Mean Square Error (cvRMSE) in % woody cover. The data are randomly assigned to four equally sized subsamples (called folds), each using k random ground monitoring sites. Each fold is removed, while the remaining data is used to re-fit the regression model and to predict the deleted observations. The root of the mean squares of all folds gives the cvRMSE. 2.11. Extrapolation of woody cover to Sahel scale
Since the model was established with corrected woody cover (cWC) representing the dry season green mass adjusted to foliage phenology, the retrieval of the total woody cover at Sahel scale required the
Table 1
Earth observation seasonal metrics used in this study (seeFig. 4for illustrations). Variable Abbreviation Definition
Base value BASE Minimum value over the season Maximum value MAX Highest data value over the season Amplitude AMP Difference between MAX and BASE Small integral SINT Integral from SOS to EOS only values above BASE Start of season SOS Starting point of the growing season
(20% of amplitude)
End of season EOS Ending point of the growing season (80% of amplitude)
Length of season LOS Time between SOS and EOS Left derivative LDERIV Rate of increase before MAX Right derivative RDERIV Rate of decrease after MAX Dry season integral DSINT Annual integral— SINT
adjustment of the canopy cover derived from phenological metrics by the estimated mean foliage density of woody canopies during dry season across the whole Sahel. This mean foliage density was assessed by estimating the relative contribution of the six woody plant foliage phenotypes within each of the three bioclimatic zones and then weight-ed them by mean canopy cover within each zones (Fig. 6). It resulted of a mean foliage density value of 0.63. For extrapolation to Sahel scale, the predicted values were thus divided by 0.63 to inverse the correction and retrieve the total woody cover. Negative predictions were set to zero. 3. Results
3.1. Selecting satellite metrics related to woody cover
In spite of the differences in the original FAPAR datasets, the variables with the highest predictive capacity being selected in the multilinear models were the same from both VGT and MODIS phenolog-ical metrics. In afirst step, metrics causing a high VIF in both VGT and MODIS models were removed (length of the season LOS and SINT, see correlation matrix in supplementary material for details on interrela-tionships). The subsequent stepwise regression removedfirst the AMP and MAX metrics which are both primarily controlled by the herba-ceous growth. In thefinal round, the BASE, the increasing rate (LDERIV) and the EOS were removed. Although a relation to corrected woody cover exists for these metrics, other metrics show a higher importance for the overall prediction accuracy of the model and the remaining metrics in thefinal models were DSINT, SOS, and RDERIV with a VIF b2 and significance b0.01 for both VGT and MODIS FAPAR (Fig. 5). While RDERIV provides information on the period of decreasing in flu-ence of green herbaceous vegetation on the FAPAR curve, the SOS is as well related to the leafing of trees, as many woody species start their leafing before the onset of the rainy season (Fig. 3), triggered by air tem-perature and relative humidity. This is especially the case in the
southern Sahel, where woody plants develop leaves markedly ahead of thefirst rainfall events (in contrast to herbaceous vegetation depen-dent on an increase in soil moisture for massive germination) (Devineau, 1999), attributing thefirst increasing FAPAR signal after the dry season to woody plants. As only woody species remain green over parts of the dry season, the BASE could be considered as another important predictor (Horion et al., 2014), however, this variable did not improve the predictions of the models. DSINT represents the FAPAR integral from the onset of the dry season to the onset of the fol-lowing rainy season, which is a distinctive period for woody leafing and thus our most important and robust variable. DSINT is found to explain around 60% and 80% of the r2in the VGT and MODIS models respectively (Fig. 5c,d) (metrics are normalized to sum 100%).
3.2. Validation of the woody cover models and comparison with MOD44B tree cover
The error rates for both the VGT and MODIS models are very low (cvRMSE = 3.2 and 3.0% woody cover respectively) and the prediction ability of the models high (Fig. 5a,b) with a predictive r2 of 0.73
(MODIS) and 0.70 (VGT). Only onefield site of continuous measure-ments exists in the densely vegetated southern parts (woody cover of approximately 40%). As such this point stands out in the scatterplots (Fig. 5) and ideally should be complemented with additional measure-ments of dense woody cover for improved model confidence in areas of 30–40% woody cover. The MOD44B global tree cover product (not considering shrubs) shows a low agreement with the predicted and measured woody cover (Fig. 5f andTable 2). Even though a significant linear relationship between ground observations and MOD44B is pres-ent (r2= 0.51, p b 0.01), the percentage tree cover estimate by
MOD44B is generally much lower than the woody cover in situ data from Senegal and Mali with an underestimation of a factor of 8.8 (slope = 0.09, intercept =−0.4). This supports that the MOD44B
Fig. 4. Annual VGT FAPAR cycle of pixels with sparse and moderately dense woody cover. The two ground sites (named C2L4 and C3L5) have contrasting values regarding woody cover, herb biomass and woody leaf biomass. All values are averaged over 1999–2013. Biomass data are taken fromBrandt et al. (2015). For abbreviations, seeTable 1. Whereas SINT represents the herbaceous layer, DSINT is proposed to reflect the woody layer.
tree canopy cover product delivers only partial information on the total woody canopy cover.
3.3. Extrapolation and comparison between SPOT VGT and MODIS FAPAR The uncertainty of the estimated woody cover increases after ex-trapolation and division by the mean foliage density of the canopy cover during the dry season, however, at the same time, the slope
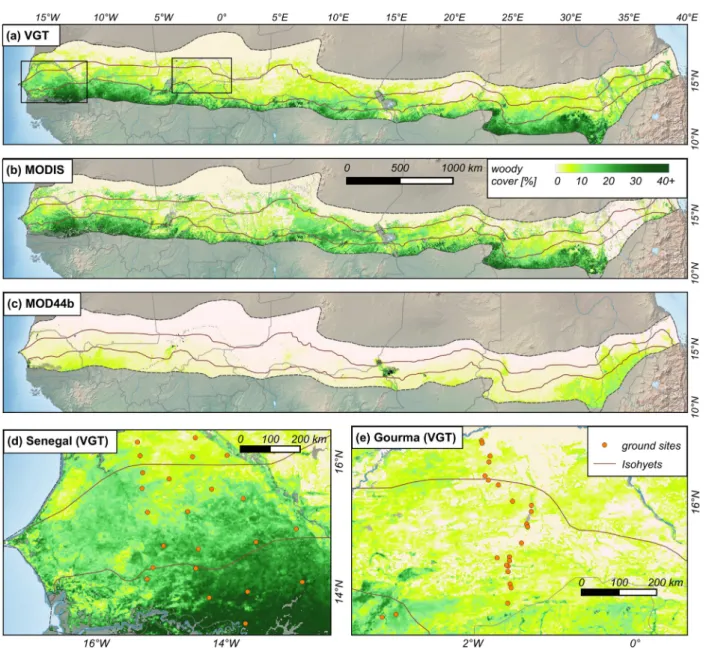
increases towards 1 (Fig. 5e). The extrapolated canopy cover of woody plants averages 7.3 ± 7.8% (VGT), 7.0 ± 8.3% (MODIS) over the whole Sahel belt. At the regional scale, the canopy cover decreases with mean annual rainfall (Table 2,Fig. 6a) as expected from threshold rela-tionship established globally (Sankaran et al., 2005). Mean woody cover in the three bioclimate sub-zones delineated by the isohyets 300 and 500 mm (Fig. 2) are clearly related to rainfall (Fig. 6a). Generally, both VGT and MODIS based FAPAR satellite datasets are able to predict the ground observations fairly accurate using the same set of metrics. MODIS FAPAR derived model has slightly better values (Fig. 5), but the FAPAR product includes several no-data pixels pre-classified as “barren land” over the entire time period. These are excluded when cal-culating the mean FAPAR in the polygons of the ground site areas, but set to 0.5% woody cover in thefinal extrapolated map. These barren land pixels not only appear in the northern Sahel masking desert areas, but also 4.1% of the southern parts (500–700 mm rainfall) with dense woody cover are erroneously pre-classified as barren land in the MOD15A2 dataset. These pixels have woody cover up to 40% in the VGT map and prevent a higher correlation between VGT and
Fig. 5. Accuracy assessment, prediction and metric importance (a) for SPOT VGT and (b) for MODIS. The predicted (multiple regression model) and cross-validation predicted values (using 4 subsamples to predict points not used to establish the model) are plotted against corrected in situ data. CvRMSE is given in % woody cover. (c) Relative importance of the variables used to predict corrected woody cover with 95% bootstrap confidence intervals for SPOT VGT and (d) for MODIS. LMG method is used (Grömping, 2007) and metrics are normalized to sum 100%. For abbreviations, seeTable 1. (e) Uncorrected in situ data is plotted against predicted data after adjusting to the mean foliage density (only VGT is shown). (f) Compares in situ woody cover with MOD44B tree cover.
Table 2
Pixel statistics at Sahel scale for the woody cover maps derived from VGT, MODIS FAPAR and MOD44B (as seen inFig. 7a–c) for three different rainfall zones shown inFig. 2. Mean and SD are given in woody cover %. Values refer to all pixels available for the three com-pared products.
VGT MODIS MOD44B Rainfall Mean SD Mean SD Mean SD 150–300 mm 2.2 2.9 2.6 4.5 0.8 11 300–500 mm 6.0 4.9 6.2 5.9 1.8 13 500–700 mm 15.4 7.9 13.8 9.7 3.2 11.7
MODIS woody cover (r2= 0.64) (Fig. 6b). Moreover,Fig. 6c shows a
sys-tematic gap between dry season VGT and MODIS FAPAR values, espe-cially in sparsely vegetated areas.
4. Discussion
4.1. Differences between woody/tree cover maps
A method based on seasonal metrics is able to estimate woody cover within 1 km pixels, relating the specific intra-annual shape of the FAPAR curve with ground measured canopy cover and phenological behavior. The FAPAR derived maps differ slightly between VGT and MODIS. The land cover dependent inversion in MODIS approach may introduce some bias in MODIS estimates which overestimate low FAPAR values over sparsely vegetated areas (McCallum et al., 2010; Fensholt et al., 2004; Martínez, Camacho, Verger, García-Haro, & Gilabert, 2013). This overestimation leads to a higher woody cover in parts of the northern fringe of the study area in comparison to VGT with values between 10 and 20% (Fig. 7b), which is unlikely in the 150–300 mm rainfall zone.
Our results significantly differ from the global tree cover product MOD44B, with an almost nine times higher canopy cover in our maps and ground observations. The same is true for the Landsat based map developed bySexton et al. (2013)(not shown for brevity). This supports existing studies (Herrmann et al., 2013; Gessner et al., 2013) which de-tect a generally very low tree cover in global products over the Sahel. It further demonstrates that, although the spatial pattern in the MOD44B product is similar and the relation linear to ground data, MOD44B de-livers only partial information on the total woody cover in semi-arid drylands, omitting small trees, shrubs and bushes. Our plant phenology and FAPAR metrics based approach constitutes an improvement by cap-turing all woody plants isolated or in thickets.
4.2. Characteristics of the FAPAR based Sahel maps
The regional distribution of the woody cover is explained by the rain-fall gradient. More locally, soil type and the pattern of rain water redistri-bution by run-off interfere with land-use to explain for contrasted woody cover. Compared to the dominant permeable sandy soils, upland rocky areas, iron pan outcrops and shallow soils are either bare (below the FAPAR threshold) or else tend to have higher woody cover than sur-rounding lands. Such bare rocky areas occur in the Tagant and the Dhar Nema in Mauritania, the erosion surfaces of the Gourma region (‘assalwa’,
Ag Mahmoud, 1992), over the Oulliminden plateau in Niger, while rocky hills such as the Affolé in Mauritania, the Mandingo, Bandiagara and Gandamia plateaus in Mali, Ader Doutchi in Niger and Mount Guedi in Chad have higher woody cover than surrounding plains. Perhaps steep slopes and shadows contribute to this local overestimation.
The web of valleys is almost systematically underlined by higher woody cover than surroundings. It is particularly obvious for the Baoulé and Bakoye rivers in Mali, the Goulbin and Komadougou in Niger and northern Nigeria, but also the Batha in Chad, and wadies from the Darfur in Sudan. In a few cases however, valleys duly appear with lower canopy cover: the Snake river in Mali, Bahr El Ghazal in Chad. Land use also explains for local patterns e.g. higher woody density in forest reserves having sharp boundaries with surrounding cropland as in Mbégué in Senegal, Tangaza in northern Nigeria, Baban Rafi in Niger. In spite of the tall trees of the agrarian parkland, woody cover is generally less at the vicinity of the villages than further away with larger extends of bushy fallows. This pattern centered on villages clearly applies to Baol in Senegal, Séno Gondo in Mali, Gobir and Mandaram in Niger and northern Kordofan in Sudan. Towns are often mapped as bare land, however, especially down town areas in bigger cities have enough tree along streets or in gardens to be classified with low woody cover.
Fig. 6. (a) Means of pixel values for woody cover by mean rainfall zones (Fig. 2) as derived from VGT, MODIS FAPAR, or from the MOD44B product. (b) VGT and MODIS woody cover over the Sahel (plot uses a sample of 3% of the cells) showing that pre-classified barren land in MODIS has woody cover up to 40% in VGT, preventing a higher correlation. (c) Temporal FAPAR profiles of 4 ground sites showing (1) that the impact of uncorrected woody cover/corrected woody cover (%) on the rainy season metrics is of minor importance and (2) the systematic gap between MODIS and VGT, with MODIS overestimating the dry season FAPAR especially in sparsely vegetated areas.
4.3. Uncertainties, sources of error and proposed improvements
Our extrapolated woody cover map is not claimed to be without errors and several points have to be considered: (1) despite masking the Sudanian area in the south, vegetation in the semi-arid southern parts of the Sahel behaves differently as compared to the vegetation in the dry northern parts. Although annuals are still dominating at the 700 mm rainfall border, perennials can be present and do normally not wilt before October–November. Moreover, the dry season phenolo-gy is defined from October to June, which is an approximation for the overall research area. The method is however robust, which can be ex-plained by the start and end of season dissymmetry with limited spread of the date of end of the rainy season along the gradient (late September to mid-October) and wider spread of the onset of the wet season (May to July), a period of the year with low density of leaves. (2) No ground data exists from cropping areas, which limits the accuracy of the model developed in these areas. Cropping areas have a slow FAPAR onset at the start of the rainy season and a delayed growth that may also overlap in October–November. (3) Most wetlands have been masked (e.g. the Niger delta, Senegal river, lake Chad), but smaller
areas remain and woody cover estimations inflooded wetlands are biased by herbaceous species staying green after the rainy season and regrow soon after. (4) Fire is a common ecosystem feature in the Sahel and especially southern areas are regularly burned. Fires usually occur during the dry season and re-sprouting of perennials in southern areas can impact the FAPAR baseline long after the last rainfall event. (5) The characteristics of the ground sites in Senegal and Mali used for the calibration of the models and the mean foliage density used for the extrapolation may not be representative of all the local characteris-tics and diversity of woody population landscapes in the Sahel. This can be seen in the increased uncertainty after adding the coefficient after extrapolation. The application of one mean foliage density value (0.63) for all types of phenology adds a degree of uncertainty. For example, an evergreen (e.g. C. glutinosum, B. aegyptiaca) dominated stand would have a foliage density of 0.78, whereas semi-deciduous sites (G. senegalensis) have 0.71, and medium semi-deciduous 0.28 (P. lucens). Completely short deciduous stands (A. seyal) would even have a foliage density of 0.08, however, at a 1 km scale this rarely occurs in the Sahel and most pixels have a mixed woody population.
Fig. 7. Extrapolated woody cover maps derived from VGT (a) and MODIS (b) FAPAR as well as the global tree cover product MOD44B (c). (d + e) show zooms to Senegal and Gourma (Mali) using VGT map (the squares in (a)). Masked wetlands are displayed gray.
Ground and satellite data are biased by sampling errors and process-ing uncertainties, respectively and the ground measurements are not continuous and free of gaps in the temporal domain, excluding an exact adaptation to the satellite data period. Thus, a temporal average over a longer period was chosen here to guarantee an unbiased relation-ship between in-situ and EO data. By setting afixed woody cover value of 0.5% in areas with a very low maximum and stddev of FAPAR, unreal-istic vegetation metric outputs were mostly excluded. This is a precau-tion measure since the methodology presented is not able to produce reliable results in these areas due to curve-fitting limitations and intrin-sic limitations to the use of EO data for vegetation monitoring in areas of very sparse vegetation cover. For a better prediction and to reduce mentioned issues, multiple metrics should be selected for different plant functional types. Further improvements can be made by including vegetation and land cover maps to derive different types of models and inversion coefficients using different metrics and calibrations, depend-ing on the dominatdepend-ing woody species and soil (Diouf et al., 2015). More-over, land use maps could adjust the model to differences in plant phenology between cropland, rangeland and forest areas.“Finally, to produce annual maps of woody cover changes over time, the method has to be robust against inter-annualfluctuations of satellite derived metrics (Broich et al., 2015) caused by rainfall dynamics, human distur-bances (cutting, clearing),fires and especially dynamics of leaf density hiding the real trend in woody population changes.”
5. Conclusion
An Earth Observation based model of woody cover in the Sahelian drylands was developed from seasonal vegetation metrics and 20 years of in situ measured woody cover at 43 sites. The concept of the model was developed from a priori knowledge of the significantly different phenophases of the persistent (woody cover) and recurrent (herbaceous) vegetation, with annual herbaceous vegetation being photosynthetically active only during the rainy season whereas most trees and shrubs remain active over large parts of the year. Our estima-tion of the total canopy cover of all woody phanerophytes shows an al-most nine times higher cover than an existing global tree cover product. This suggests that in a semi-arid dryland dominated by shrubs and small trees, a phenology based approach is a significant improvement and an important contribution for future studies quantifying carbon stocks, climate change assessment as well as parametrization of vegetation dynamic models. Although temporal changes and dynamics were not addressed within this study (in the interest of developing a robust and stable relationship between ground observations and satellite data), the knowledge on the established relationships is applied in an ongoing study monitoring woody dynamics in the Sahel area. The woody cover dataset is made publicly available (following the example ofBroich et al., 2015) for download (information on the data access can be found in the supplementary material).
Acknowledgments
The authors thank everyone involved in collecting the ground data in Senegal and Mali, especially the Centre de Suivi Ecologique (CSE), Dakar. The project (BICSA) leading to this application has received funding from the European Union's Horizon 2020 research and innova-tion program under the Marie Sklodowska-Curie grant agreement No [656564]. The study was further supported by the Danish Council for In-dependent Research (DFF) Sapere Aude program, and the European Earth Observation Programme Copernicus Global Land and GIOBIO (32-566) project. Aleixandre Verger is the recipient of a Juan de la Cierva postdoctoral fellowship from the Spanish Ministry of Science and Inno-vation. A.A. Diouf is supported by the AGRICAB project (Contract No. 282621), funded by the European Union under the seventh Framework Programme (FP7). Finally we thank Laurent Kergoat and the two anon-ymous reviewers for useful comments on the manuscript.
Appendix A. Supplementary data
Supplementary data to this article can be found online athttp://dx. doi.org/10.1016/j.rse.2015.10.036.
References
Ag Mahmoud, M. (1992).In R. Le Floc'h (Ed.), Le haut Gourma Central (2nd edn.). Montpellier: CEFE/CNRS (133 pp.).
Allen, D. M. (1974). The relationship between variable selection and data agumentation and a method for prediction. Technometrics, 16, 125–127.http://dx.doi.org/10.2307/ 1267500.
Barbé, L. L., & Lebel, T. (1997). Rainfall climatology of the HAPEX-Sahel region during the years 1950–1990. Journal of Hydrology, 188–189, 43–73.http://dx.doi.org/10.1016/ S0022-1694(96)03154-X(HAPEX-Sahel).
Baret, F., Weiss, M., Lacaze, R., Camacho, F., Makhmara, H., Pacholcyzk, P., & Smets, B. (2013). GEOV1: LAI and FAPAR essential climate variables and FCOVER global time series capitalizing over existing products. Part1: Principles of development and pro-duction. Remote Sensing of Environment, 137, 299–309.http://dx.doi.org/10.1016/j. rse.2012.12.027.
Brandt, M., Mbow, C., Diouf, A. A., Verger, A., Samimi, C., & Fensholt, R. (2015). Ground-and satellite-based evidence of the biophysical mechanisms behind the greening Sahel. Global Change Biology, 21, 1610–1620.http://dx.doi.org/10.1111/gcb.12807. Broich, M., Huete, A., Paget, M., Ma, X., Tulbure, M., Restrepo-Coupe, N., Evans, B., Beringer,
J., Devadas, R., Davies, K., et al. (2015).A spatially explicit land surface phenology data product for science, monitoring and natural resources management applications. Environmental Modeling and Software.
Broich, M., Huete, A., Tulbure, M. G., Ma, X., Xin, Q., Paget, M., ... Held, A. (2014). Land sur-face phenological response to decadal climate variability across Australia using satel-lite remote sensing. Biogeosciences, 11, 5181–5198. http://dx.doi.org/10.5194/bg-11-5181-2014.
Chambers, J. M., & Hastie, T. J. (Eds.). (1991).Statistical models in S. Boca Raton, Fla: Chapman and Hall/CRC.
Dardel, C., Kergoat, L., Hiernaux, P., Mougin, E., Grippa, M., & Tucker, C. J. (2014). Re-greening Sahel: 30 years of remote sensing data andfield observations (Mali, Niger). Remote Sensing of Environment, 140, 350–364.http://dx.doi.org/10.1016/j. rse.2013.09.011.
De Bie, S., Ketner, P., Paasse, M., & Geerling, C. (1998). Woody plant phenology in the West Africa savanna. Journal of Biogeography, 25, 883–900.http://dx.doi.org/10. 1046/j.1365-2699.1998.00229.x.
Defries, R. S., Hansen, M. C., Townshend, J. R. G., Janetos, A. C., & Loveland, T. R. (2000). A new global 1-km dataset of percentage tree cover derived from remote sensing. Global Change Biology, 6, 247–254.http://dx.doi.org/10.1046/j.1365-2486.2000. 00296.x.
Devineau, J. -L. (1999).Seasonal rhythms and phenological plasticity of savanna woody species in a fallow farming system (south-west Burkina Faso). Journal of Tropical Ecology, 15, 497–513.
Diouf, A. A., Brandt, M., Verger, A., Jarroudi, M. E., Djaby, B., Fensholt, R., ... Tychon, B. (2015). Fodder biomass monitoring in Sahelian rangelands using phenological met-rics from FAPAR time series. Remote Sensing, 7, 9122–9148.http://dx.doi.org/10. 3390/rs70709122.
Fensholt, R., Rasmussen, K., Kaspersen, P., Huber, S., Horion, S., & Swinnen, E. (2013). Assessing land degradation/recovery in the African Sahel from long-term Earth Observation based primary productivity and precipitation relationships. Remote Sensing, 5, 664–686.http://dx.doi.org/10.3390/rs5020664.
Fensholt, R., Sandholt, I., & Rasmussen, M. S. (2004). Evaluation of MODIS LAI, fAPAR and the relation between fAPAR and NDVI in a semi-arid environment using in situ mea-surements. Remote Sensing of Environment, 91, 490–507.http://dx.doi.org/10.1016/j. rse.2004.04.009.
Gessner, U., Machwitz, M., Conrad, C., & Dech, S. (2013). Remote Sensing of Environment, 129, 90–102.http://dx.doi.org/10.1016/j.rse.2012.10.026.
Grömping, U. (2007). Estimators of relative importance in linear regression based on var-iance decomposition. The American Statistician, 61, 139–147.http://dx.doi.org/10. 1198/000313007X188252.
Baret, F., Hagolle, O., Geiger, B., Bicheron, P., Miras, B., Huc, M., ... Leroy, M. (2007).LAI, fAPAR and fCover CYCLOPES global products derived from VEGETATION. Part 1: Principles of the algorithm. Remote Sensing of Environment, 110, 275–286.
Hansen, M. C., DeFries, R. S., Townshend, J. R. G., Carroll, M., Dimiceli, C., & Sohlberg, R. A. (2003). Global percent tree cover at a spatial resolution of 500 meters: First results of the MODIS vegetation continuousfields algorithm. Earth Interactions, 7, 1–15.http:// dx.doi.org/10.1175/1087-3562(2003)007b0001:GPTCAAN2.0.CO;2.
Hansen, M. C., DeFries, R. S., Townshend, J. R. G., Marufu, L., & Sohlberg, R. (2002). Devel-opment of a MODIS tree cover validation data set for Western Province, Zambia. Remote Sensing of Environment, 83, 320–335.
Hansen, M. C., Townshend, J. R. G., DeFries, R. S., & Carroll, M. (2005). Estimation of tree cover using MODIS data at global, continental and regional/local scales. International Journal of Remote Sensing, 26, 4359–4380.http://dx.doi.org/10.1080/ 01431160500113435.
Herrmann, S., Wickhorst, A., & Marsh, S. (2013). Estimation of tree cover in an agricultural parkland of Senegal using rule-based regression tree modeling. Remote Sensing, 5, 4900–4918.http://dx.doi.org/10.3390/rs5104900.
Hiernaux, P., & Le Houérou, H. N. (2006).Les parcours du Sahel. Sécheresse, 17(1–2), 51–71.
Hiernaux, P., Cissé, M. I., Diarra, L., & de Leeuw, P. N. (1994).Fluctuations saisonnières de la feuillaison des arbres et buissons sahéliens. Conséquences pour la quantification des ressources fourragères. Revue d'Élevage et de Médecine Vétérinaire des Pays Tropicaux, 47, 117–125.
Hiernaux, P., Diarra, L., Trichon, V., Mougin, E., Soumaguel, N., & Baup, F. (2009). Woody plant population dynamics in response to climate changes from 1984 to 2006 in Sahel (Gourma, Mali). Journal of Hydrology, 375, 103–113.http://dx.doi.org/10. 1016/j.jhydrol.2009.01.043.
Horion, S., Fensholt, R., Tagesson, T., & Ehammer, A. (2014). Using earth observation-based dry season NDVI trends for assessment of changes in tree cover in the Sahel. International Journal of Remote Sensing, 35, 2493–2515.http://dx.doi.org/10.1080/ 01431161.2014.883104.
Jobard, I., Chopin, F., Berges, J. C., & Roca, R. (2011). An intercomparison of 10-day satellite precipitation products during West African monsoon. International Journal of Remote Sensing, 32, 2353–2376.http://dx.doi.org/10.1080/01431161003698286.
Jönsson, P., & Eklundh, L. (2004).TIMESAT— a program for analyzing time-series of satellite sensor data. Computers & Geosciences, 30, 833–845.
Karlson, M., Reese, H., & Ostwald, M. (2014). Tree crown mapping in managed woodlands (parklands) of semi-arid West Africa using WorldView-2 imagery and geographic ob-ject based image analysis. Sensors, 14, 22643–22669.http://dx.doi.org/10.3390/ s141222643.
Le Houérou, H. N. (1980).The rangelands of the Sahel. Journal of Range Management, 33, 41–46.
Martínez, B., Camacho, F., Verger, A., García-Haro, F. J., & Gilabert, M. A. (2013). Inter-comparison and quality assessment of MERIS, MODIS and SEVIRI FAPAR products over the Iberian Peninsula. International Journal of Applied Earth Observation and Geoinformation, 21, 463–476.http://dx.doi.org/10.1016/j.jag.2012.06.010. Mbow, C., Chhin, S., Sambou, B., & Skole, D. (2013). Potential of dendrochronology to
assess annual rates of biomass productivity in savanna trees of West Africa. Dendrochronologia, 31, 41–51.http://dx.doi.org/10.1016/j.dendro.2012.06.001. McCallum, I., Wagner, W., Schmullius, C., Shvidenko, A., Obersteiner, M., Fritz, S., &
Nilsson, S. (2010). Comparison of four global FAPAR datasets over Northern Eurasia for the year 2000. Remote Sensing of Environment, 114, 941–949.http://dx.doi.org/ 10.1016/j.rse.2009.12.009.
Mougin, E., Demarez, V., Diawara, M., Hiernaux, P., Soumaguel, N., & Berg, A. (2014). Esti-mation of LAI, fAPAR and fCover of Sahel rangelands (gourma, Mali). Agricultural and Forest Meteorology, 198–199, 155–167.http://dx.doi.org/10.1016/j.agrformet.2014. 08.006.
Mougin, E., Hiernaux, P., Kergoat, L., Grippa, M., de Rosnay, P., Timouk, F., ... Mazzega, P. (2009). The AMMA-CATCH Gourma observatory site in Mali: Relating climatic varia-tions to changes in vegetation, surface hydrology,fluxes and natural resources. Journal of Hydrology, 375, 14–33.http://dx.doi.org/10.1016/j.jhydrol.2009.06.045. Mougin, E., Lo Seen, D., Rambal, S., Gaston, A., & Hiernaux, P. (1995). A regional Sahelian
grassland model to be coupled with multispectral satellite data. I: Model description and validation. Remote Sensing of Environment, 52, 181–193.http://dx.doi.org/10. 1016/0034-4257(94)00126-8.
Myneni, R. B., & Williams, D. L. (1994). On the relationship between FAPAR and NDVI. Remote Sensing of Environment, 49, 200–211. http://dx.doi.org/10.1016/0034-4257(94)90016-7.
Myneni, R. B., Hoffman, S., Knyazikhin, Y., Privette, J. L., Glassy, J., Tian, Y., ... Running, S. W. (2002).Global products of vegetation leaf area and absorbed PAR from year one of MODIS data. Remote Sensing of Environment, 83, 214–231.
Rasmussen, K., Fog, B., & Madsen, J. E. (2001). Desertification in reverse? Observations from northern Burkina Faso. Global Environmental Change, 11, 271–282.http://dx. doi.org/10.1016/S0959-3780(01)00005-X.
Rasmussen, K., Nielsen, T. T., Mbow, C., & Wardell, A. (2006).Land degradation in the Sahel: An apparent scientific contradiction. In M. Møllegaard (Ed.), Natural resource management in Sahel— lessons learnt, occasional paper : SEREIN, Sahel-Sudan Envi-ronmental Research Initiative. SEREIN, Sahel-Sudan EnviEnvi-ronmental Research Initiative. (pp. 37–43).
Rasmussen, M. O., Göttsche, F. -M., Diop, D., Mbow, C., Olesen, F. -S., Fensholt, R., & Sandholt, I. (2011). Tree survey and allometric models for tiger bush in northern
Senegal and comparison with tree parameters derived from high resolution satellite data. International Journal of Applied Earth Observation and Geoinformation, 13, 517–527.http://dx.doi.org/10.1016/j.jag.2011.01.007.
Roujean, J. L., Leroy, M., & Deschamps, P. Y. (1992).A bidirectional reflectance model of the Earth's surface for the correction of remote sensing data. Journal of Geophysical Research, 97, 20455–20468.
San Emeterio, J. L., & Mering, C. (2012).Climatic and human impacts on the ligneous cover in the Sahel from analysis of aerial photographs before and after the drought periods of the 70's and 80's, in: EGU general assembly conference abstracts. Presented at the EGU General Assembly Conference Abstracts (pp. 3052).
Sankaran, M., Hanan, N. P., Scholes, R. J., Ratnam, J., Augustine, D. J., Cade, B. S., ... Zambatis, N. (2005). Determinants of woody cover in African savannas. Nature, 438, 846–849.
http://dx.doi.org/10.1038/nature04070.
Sayre, R., Comer, P., Hak, J., Josse, C., Bow, J., Warner, H., ... Waruingi, L. (2013).A new map of standardized terrestrial ecosystems of Africa. Washington, DC: Association of American Geographers.
Seghieri, J., Do, F. C., Devineau, J. -L., Fournier, A., et al. (2012).Phenology and climate change (pp. 143–178). Intech Open Access Publisher.
Sexton, J. O., Song, X. -P., Feng, M., Noojipady, P., Anand, A., Huang, C., ... Townshend, J. R. (2013). Global, 30-m resolution continuousfields of tree cover: Landsat-based rescaling of MODIS vegetation continuousfields with lidar-based estimates of error. International Journal of Digital Earth, 6, 427–448. http://dx.doi.org/10.1080/ 17538947.2013.786146.
Spiekermann, R., Brandt, M., & Samimi, C. (2015). Woody vegetation and land cover changes in the Sahel of Mali (1967–2011). International Journal of Applied Earth Observation and Geoinformation, 34, 113–121.http://dx.doi.org/10.1016/j.jag.2014. 08.007.
Sterling, S. J., & Orr, B. (2014). Patterns of tree distribution within small communities of the Sudanian Savanna–Sahel. Land, 3, 1284–1292.http://dx.doi.org/10.3390/ land3041284.
Townshend, J. R. G., Carroll, M., Dimiceli, C., Sohlberg, R., Hansen, M., & DeFries, R. (2011).
Vegetation continuousfields MOD44B, 2001 percent tree cover, collection 5. College Park, Maryland: University of Maryland (2001).
Tracol, Y., Mougin, E., Hiernaux, P., & Jarlan, L. (2006). Testing a Sahelian grassland func-tioning model against herbage mass measurements. Ecological Modelling, 193, 437–446.http://dx.doi.org/10.1016/j.ecolmodel.2005.08.033.
Verger, A., Baret, F., & Weiss, M. (2008).Performances of neural networks for deriving LAI estimates from existing CYCLOPES and MODIS products. Remote Sensing of Environment, 112, 2789–2803.
Vintrou, E., Bégué, A., Baron, C., Saad, A., Lo Seen, D., & Traoré, S. B. (2014). A comparative study on satellite- and model-based crop phenology in West Africa. Remote Sensing, 6, 1367–1389.http://dx.doi.org/10.3390/rs6021367.
de Vries, F. W. T. P., & Djitèye, M. A. (1982).La productivité des pâturages sahéliens: une étude des sols, des végétations et de l'exploitation de cette ressource naturelle. Centre for Agricultural Publishing and Documentation.
Wagenseil, H., & Samimi, C. (2007).Woody vegetation cover in Namibian savannahs: a modelling approach based on remote sensing [Die Gehölzdichte in den Savannen Namibias: eine fernerkundungsgestützte Modellierung]. Erdkunde, 61, 325–334.
Weiss, M., Baret, F., Garrigues, S., Lacaze, R., & Bicheron, P. (2007).LAI, fAPAR and fCover CYCLOPES global products derived from VEGETATION. Part 2: Validation and compar-ison with MODIS Collection 4 products. Remote Sensing of Environment, 110, 317–331.
Yang, W., Huang, D., Tan, B., Stroeve, J. C., Shabanov, N. V., Knyazikhin, Y., ... Myneni, R. B. (2006). Analysis of leaf area index and fraction of PAR absorbed by vegetation prod-ucts from the terra MODIS sensor: 2000–2005. IEEE Transactions on Geoscience and Remote Sensing, 44, 1829–1842.http://dx.doi.org/10.1109/TGRS.2006.871214. Zandler, H., Brenning, A., & Samimi, C. (2015). Quantifying dwarf shrub biomass in an arid
environment: comparing empirical methods in a high dimensional setting. Remote Sensing of Environment, 158, 140–155.http://dx.doi.org/10.1016/j.rse.2014.11.007.