Translated Title: Reprint Status: Edition:
Author, Subsidiary: Author Role:
Place of Publication: Québec Publisher Name: INRS-Eau Date of Publication: 1987
Original Publication Date: 23 novembre 1987 Volume Identification:
Extent of Work: 54
Packaging Method: pages Series Editor:
Series Editor Role:
Series Title: INRS-Eau, Rapport de recherche Series Volume ID: 233 an
Location/URL:
ISBN: 2-89146-230-0
Notes: Rapport annuel 1987-1988
Abstract: ISBN double avec R000233 a ok avec J-D Bourgault
Rapport rédigé pour Environnement Canada, Conservation et Protection, région du Québec, Division de la protection de l'environnement
10.00$ Call Number: R000233 an Keywords: rapport/ ok/ dl
SummaO' by
Jean-Pierre VILLENEUVE
Olivier HANTON
Pierre LAFRANCE
Scientific report INRS no 233b
from:
Université du Québec Institut National de la Recherche Scientifique INRS-Eau, 2700 rue Einstein c.P. 7500, Sainte-Foy (Québec) G 1 V 4C7 Canada
November 23th
, 1987
for:
Contaminants Control Division Environmental Protection Branch
Conservation and Protection, Quebec region Environment Canada
1179, De Bleury, Montreal (Québec) H3B 3H9 Canada
2 GROVNDWATER VULNERABILI'IY TO CONTAMINATION ... 5
2.1 Definitions ... 5
2.2 Evaluation methods of groundwater vulnerability ... 7
3 PROCESSES OF RETENTION AND TRANSFORMATION OF CONTAMINANTS IN SOILS: THEIR IMPORTANCE IN THE EVALUATION OF GROVNDWATER VULNERABILI'IY ... Il 3.1 BIO-PHYSICO-CHEMICAL FACTORS CONTROLING THE FATE OF CONTAMINANTS IN SOILS ... Il 3.1.1 Retention and mobility of the contaminant ... 12
3.1.2 Transformation and persistence of a contaminant ... 13
3.1.3 Utilization of the processes of retention and transformation of contaminants in the evaluation of groundwater vulnerability ... 13
3.2 CONCLUSION ... 14
4 DEVELOPMENT OF AN EVALUATION MODEL OF GROUNDWATER VULNERABILI'IY ... 15
4.1 CHOICE OF AN EVALUATION METHOD OF GROUNDWATER VULNERABILITY... 15
4.2 COMPARISON OF TWO EVALUATION METHODS OF GROUNDWATER VULNERABILITY (after Banton and Villeneuve, 1987) ... 15
4.2.1 The DRASTIC method ... 16
4.2.2 The PRZM model... 16
4.2.3 Comparison ... 17
4.2.4 Results ... 17
4.3 MATHEMATICAL MODELS OF SIMUlATION ... 18
4.4 SENSITIVITY OF A MODEL TO ITS PARAMETERS (after Villeneuve et al., 1987) ... 19
4.4.1 Sensitivity analysis ... 20
Villeneuve, 1987) ... 21
4.5.1 Results ... 22
4.5.2 Interest of a convection model ... 23
5 VULPEST: A GROUNDWATER VULNERABILITY EVALUATION MODEL ... 25
5.1 THE VULPEST MODEL ... 25
5.1.1 The transport equation ... 25
5.1.2 The Monte-Carlo approach ... 27
5.1.3 The analytical solution ... 28
5.1.4 The results of the model ... 29
5.2 THE VULPEST SOFTWARE ... 29
5.2.1 The software ... 30
5.2.2 Definition of input data ... 30
5.2.3 The simulation module ... 30
5.2.4 The visualization of results ... 31
5.2.5 The management of files ... 32
6 APPLICATION OF THE VULPEST MODEL ON 'IWO SITES IN OUEBEC ... 33
6.1 INTRODUCTION ... 33
6.2 DESCRIPTION OF THE SITES OF APPLICATION ... 33
6.2.1 The Portneuf region ... 33
6.2.2 The agronomical station of Saint-Augustin ... 35
6.3 EVALUATION OF GROUNDWATER VULNERABILITY ... 39
6.3.1 Results from the VULPEST model ... 39
6.3.2 Interpretation of the results ... 39
6.3.3 The Portneufregion ... 41
6.3.4 The Saint-Augustin site ... 43
6.4 CONCLUSION ... 45
7 CONCLUSION ... 47
CHAPTERI
INTRODUCTION
Groundwater is undoubtedly a very important resource. In the United States, for instance, more than 90% of the public water supplies originate from groundwater; in rural areas, 97% of domestic needs are fulfilled by groundwater. During the last ten years in the United States, the increase in groundwater utilization has reached 30%, which is twice the increase observed in surface water consumption.
In Canada, 9.7% of the water used by municipalities cornes from subsurface sources. To this quantity must be added an equivalent volume of water coming from domestic wells and directly used by the population. In Québec, 20% of the population draw their drinking water from groundwater. Groundwater, which is abundant and still under used in Québec, must therefore be considered as a very valuable resource in terms of both its current and potential uses.
Because of its potability, groundwater is expected to be increasingly used. As people become more dependent on this resource, they become more conscious of the need to prote ct
it. Although contamination by man is not a recent phenomenon, it is only lately that people have become aware of the dangers and types of occurrence of contamination. Moreover, during recent de cade s, numerous potential contaminants have been produced and increasingly used by man. The utilization of these products has entailed so important contamination risks that in sorne regions, if the current use of groundwater is not already threatened, its potential use is seriously compromised.
A study realized in the United States in the early 1980's reveals the presence of numerous synthetic organic substances in groundwater (Westrick et al., 1982). The presence of at least one contaminant has been detected in 28.7% of the 181 inventoried municipalities. With regard to pesticides, cases of groundwater contamination have been reported, among others, in New York State (Long Island, aldicarb: Zaki et al., 1983), in Nebraska (Platte Valley,
atrazine:Wehtje et al., 1981), in Wisconsin (Central Sand Plain, aldicarb and atrazine: Harkin et al., 1984) and in California (Cohen, 1982). In the latter state, chemical contaminants of industrial and agricultural origin have been reported. The injection of pesticides under the soil surface to control nematodes has been recognized as a particularly important source of groundwater pollution. For instance, the nematicide 1,2-dibromo- 3-chloropropane (DBCP), which has been banned in California since 1977, had contaminated over 2 500 wells that supplied more than 700 000 people in potable water. More than 50 other types of pesticides have been traced in groundwater, and this, in more than half of California's 58 counties (Cohen, 1982).
In Canada, similar problems have been identified. For example, in the Abbotsford region of the Lower Fraser Valley (RC.), the 1,2-dichloropropane has been traced in 43% of the wells (Canada Environment, 1985). In the Okanagan agricultural valley (RC.) and in the area of Lake Osoyoos, traces (1-5 ppb) of at least 14 pesticides have been found (Pupp, 1985). Most of the time, these pesticides are organochlorides which have not been used for the last ten years. On Prince Edward Island, aldicarb, which is used for potato culture, has been found in 22% of the inspected farm wells (Canada Environment, 1985).
The province of Québec is not exempt from such contamination problems. Two possible sources of contamination can already be identified: the first one, the point source, is related to waste landfill sites, while the second one, called diffuse or non-point source, results from the spreading of fertilizer and pesticides. Sorne cases of contamination from point sources have been reported in Québec, one of the most important, being the case of Ville Mercier where the water table has been contaminated bythe diffusion of industrial chemicals from a waste disposaI site (Poulin, 1977). In regard of diffuse sources, Québec has used in 1978 about 2.5 millions of kilograms (active substance) of pesticides, Le., close to half a kilogram per inhabitant; this quantity represents 5% of aIl canadian uses. An inquiry realized by the Bureau d'Etude sur les Substances Toxiques (RE.S.T.) reveals that about 85% of the pesticides used in Québec have been applied by farmers, 13% by industries and governmental agencies, and 2% by individuals (St-Jean and Paré, 1980).
Specialists from the Ministère de l'Environnement du Québec have reported the presence of important quantities of pesticides in the groundwater that supplies the population
contamination has occurred even though the homologated products had been used in accordance with the techniques recommended by the manufacturer and_ the Ministère de l'Agriculture, des Pêcheries et de l'Alimentation du Québec.
During the last ten years, cases of groundwater pollution have thus considerably multiplied and worsened. Pupp (1985), in a report on groundwater contamination in Canada, indicates numerous cases of contamination encountered in the various provinces. Facing this problem and the difficult task of decontamination, managers have rapidly become aware of the importance of prevention in the struggle against this pollution. Indeed, the various governmental interventions and the efforts of sorne managers show the concem of communities to protect this very valuable resource.
It is thus within this general context of environmental protection and more particularly in order to safeguard potential resources of groundwater that the present project is defined. Given the urgent need to prevent the aggravation of the problem, and the proliferation of contaminated sites, it is of great importance to establish the potential of vulnerability of the territory as a function of its sensitivity to contamination. Vulnerability of groundwater to pollution is a very complex subject where numerous phenomena are interacting; moreover, aIl the physical, chemical, biological and even human laws that control these phenomena are still not very weIl understood.
Actually, groundwater is part of an open system that essentially consists of the groundwater itself, other types of water (which are parts of the water cycle), the porous medium that contains groundwater, and human interventions on the medium. The protection of groundwater quality and potential, by considering the interactions of the system with its environment, is actually of prioritary concem. Renee, it appears very interesting to base plans of groundwater protection upon pertinent information on the vulnerability of aquifers to pollution.
Within this context, a procedure of evaluation of vulnerability should provide an essential tool for those who are concerned with the planning of the territory, the choice of waste disposallandfill sites, and the delineation of protection areas, as weIl as for those who must supervise and control the quality of groundwater.
The first objective of this project consists in establishing an evaluation procedure for the potential of groundwater vulnerability to pollution by pesticides. The experience acquired in this field in France, in the United States, in Denmark, etc., must be used to establish the approach, the parameters and the various tools required for this evaluation. The result of the application of this procedure on a given region should be in the form of a map that locates vulnerable zones and indicates their level of vulnerability.
GROUNDWATER VULNERABILI1Y TO CONTAMINATION
2.1 DEFINITIONS
Contamination and pollution are linked to the presence of a compound within the system, hence causing an alteration of the quality of groundwater. Contamination becomes pollution when this alteration is prejudicial to the user, and a fortiori, represents a health risk.
The vulnerability of a groundwater system to contamination is a poorly defined but yet very complex concept, that can represent the sensitivity and susceptibility to contamination as weIl as the natural conditions controlling the penetration, the propagation and even the purification pro cesses in the medium.
It is of great interest to define the concept of vulnerability at three distinct levels. First, the vulnerability is defined as the capacity of a groundwater system for being contaminated, or as the inaptitude for being protected from contamination. This phenomenon is linked to the external dynamics of the system, and thus to the various conditions influencing the penetration of the contaminant into the system. At the second level, the concept of vulnerability, which takes into account the capacity of groundwater for propagating and conserving the contamination, is related to the internaI dynamics of the system. The third level considers the impact of the contaminant, especially those linked to detrimental effects, and hence calls for the concepts of norms, reference values, and aptitude or inaptitude for the foreseen use.
When defined at the first level, the concept of vulnerability does not allow any penetration of the contaminant into the system. However, when defined at the third level, it does allow the introduction of the contaminant into the system, but only if the concentration in this contaminant does not make the water unfit for future use.
It clearly appears that the first level of definition (of the environmental ecological management type) is the most strict, and that it is thereby the level that will ensure the conservation of the resource for aIl future uses. The second level is generally used for the zoning of protection areas around wells, which is a particular case of groundwater protection.
There are numerous sources and types of contamination that vary according to both their nature and location. Among the point sources of pollution, one can distinguish those of domestic (wastewater, household refuses), industrial and agricultural (organic substances linked to breeding, chemical fertilizers and pesticides) origins. The various sources of pollution (municipal, agricultural, industrial sources, from hydrocarbures, mining, polluted surface or precipitation water, septic tanks and wells, salted water intrusions) can be classified in terms of the nature of the pollutant (physical, chemical as inorganics or organics, trace element, bacteriological and/or radiological). A classification of the potential sources of contamination can also be used, according to the location of these sources (on the surface, underground above the water table, within the water table). Actual and potential sources of groundwater contamination are therefore numerous and diversified, and can be classified according to their location, the nature of the contaminant or the type of human activity that generates them.
There are many different factors affecting the potential of contamination of groundwater. In order to characterize the aggression and the defenses of the system, it is
essential to know the factors linked to the contamination. The various factors intervening and influencing the groundwater vulnerability to contamination are those linked to the phenomena of penetration and propagation in the aquifer, or differently, to the emission (sources and types of contamination), the transport (hydrogeology), the persistence and/or retention-degradation (contaminants, hydrochemistry) and the utilization of the resource (catchment areas, consumption). The factors intervening in these phenomena, and their influence on vulnerability, depend on the definition levels of vulnerability.
The objective of a study on the vulnerability of a groundwater system to contamination is thus to provide the potential and the risk level of contamination, but also the level of the possible consequences of a contamination, as weIl as the preventive and corrective measures to establish following a contamination. The objectives and goals in view are thus numerous and diversified.
Even though evaluation methods need to be precise and reliable, they must also be simple, fast, easy to use and affordable, even if they are only used in preliminary studies. Such studies may be required for the country planning, the pre-selection of sites, and the installation of a water catchment at a minimum risk location.
In order to obtained a complete evaluation of the risk, for a given problem, it is necessary to characterize this risk by:
- its identification
- its quantification ... (notion of probability) - its evaluation ... (notion of impact)
- the acceptance and/or aversion for it (control) - the regulations and directives (legal/police).
Among the various approaches or procedures, the most ancient and most frequently used is the expertise, which is a study performed by a specialist or a committee of specialists, such as hydrogeologists. The expert evaluation is a more or less subjective approach, the results of which (validity-reliability) are largely due to professional experience, as weIl in the field of groundwater vulnerability as in the knowledge of the studied area. In an expert evaluation, numerous factors are directly or indirectly used. In order to palliate the possible omission of an important or determinant factor, one can utilize a decision matrix which proposes a procedure for the analysis of the problem, through the various waste parameters, the environmental factors, and the contaminant-medium interactions, this procedure leading to a decision. In this regard, tbis method does not provide an evaluation, but only an expertise procedure.
Indexation methods offer a standardized procedure for the evaluation of the potential of groundwater contamination. Sorne of them also attempt to provide a more or less automatic technique for a standardized representation of the various levels of contamination.
ln a very different approach, but with the same perspective, mathematical models of simulation of the transport of contaminants can be used. Such models can be c1assified in various ways. One possible classification is the following:
- descriptive models - physical models - analogical models - mathematical models - empirical or conceptual - deterministic or stochastic - static or dynamic
Their main interest consists of the possibility, in a given case, to foresee the fate of a contamination as weIl as the various scenarios to prevent or limit this contamination.
The results can appear under different forms, according to the different methods of evaluation. The results of an expert evaluation are usually an acceptance or a refusaI, along with specific recommendations. By definition, an indexation method provides an index for a given site, in a given case. This index can be the level of vulnerability of groundwater, divided into classes, an absolute or relative evaluation value of the potential of contamination, or even a synthetic definition of the site for a given contamination case, by means of standardized codes.
The mapping of the vulnerability is based upon the delimitation of zones to which is attributed a value from 1 to 3, representing the level of the groundwater vulnerability. The delimitation is based upon the characteristics of the land above the groundwater, the characteristics of the aquifer, and the use of water. Mapping, as can be observed, is a very common form of representation for the results of the different evaluation methods, whether these are expertise or indexation systems.
represent groundwater concentrations of a contaminant. These results can be presented as tables, curves, profiles, maps, etc.
It can be necessary to differentiate the uses of the evaluation methods from the uses of the evaluation results. The information provided by the method, or contained in the results and/ or their final representation, must be c1ear and easy to be used by both specialists and non-specialists.
For an adequate use of the methods and their results, it may be necessary to provide sorne advice or recommendations, or even restrictions, to inform potential users that these methods and results are only tools, and that their validity will have to be confirmed by an expert evaluation. One problem of validity is that of the investigation scale. One must also keep in mind that the final results do not usually retain the information necessary for their obtaining
CHAPTER3
PROCESSES OF RETENTION AND TRANSFORMATION
OF CONTAMINANTS IN SOILS: THEIR IMPORTANCE IN THE EVALUATION OF GROUNDWATER VULNERABILITY
Groundwater vulnerability to contamination is a concept related to the level or threshold above which the presence of a contaminant or its contact with the various elements of the medium is considered unacceptable. This level can be: 1) the potential of contamination of a water table from any localized (point) or diffuse source of pollution; 2) the propagation of the contaminant within the water of an aquifer, or; 3) the potential of risk and impact due to groundwater contamination.
The presence and the effect of a contaminant at any of the stated levels are linked to its concentration and to its reactivity or toxicity in the medium. Any physical, chemical or biological phenomenon or mechanism susceptible to diminish the mobility, the concentration or the toxicity of a contaminant in soils, will possibly be considered as an attenuation factor of this contaminant in regard with its potential for groundwater contamination or its users. A brief review of the bio-physico-chemical factors that control the fate of contaminants in soils, and of the use of these factors within the actual procedures of evaluation is presented in the following sections.
3.1 BIO-PHYSICO-CHEMICAL FACTORS CONTROLING THE FATE OF CONTAMINANTS IN SOILS
The amount of time needed for a contaminant to pass through the unsaturated zone of soi! (vertical flow towards the water table) is determined by its mobility, i.e., by the simultaneous effect of the various conditions influencing its movement and its attenuation in
the medium. The main bio-physico-chemical attenuation factors are linked to the reactivity and properties of both the chemicals and the soils; their effects on the migration of contaminants towards the water table largely determine the potentiality of the latter to be reached. These factors are described below.
The pro cesses of retention, transformation and dissipation of contaminants on the surface or in the subsurface of soils can be classified into two main categories:
1) the processes considered as being "in equilibrium": ionization and oxido-reduction of chemicals, complexation and ionic exchange with the surface constituents of soils, adsorption on soils.
2) the pro cesses controled by kinetics, Le., that present a slow kinetics relative to water velo city: photolysis, volatilization, chemical hydrolysis (abiotic), microbiological biodegradation and assimilation by plants.
3.1.1 Retention and mobility of the contaminant
The retention of a contaminant in soils, or its retardation relative to the water velocity in the unsaturated zone, is mainly caused by the adsorption phenomena. It has been experimentally shown that, in the presence of a low concentration of contaminant (the usual case for a diffuse contamination, such as contamination due to the spreading of pesticide), the quantity of adsorbed solute is generally proportional to the concentration of this solute in the liquid phase:
S =K C d (3.1)
Su ch a linear adsorption allows the definition of the partition coefficient Kd' which quantifies the magnitude of the soil-water partition of the compound. The use of Kd implies the assumption of an entirely reversible and instantaneous adsorption-desorption equilibrium. The Kd value largely determines the mobility of a contaminant in the unsaturated zone of soils: the average velocity of a contamination front decreases linearly with an increase of the Kd value.
3.1.2 Transformation and persistence of a contaminant
The physical dissipation of a contaminant (volatilization) as well as its chemical (photolysis and hydrolysis) and microbiological (biodegradation) transformations in soils determine its persistence within the medium. The processes of transformation of contaminants in the environment are usually considered as reactions of pseudo-order 1. Such a simplification
of the order of reactions allows the definition of a half-life (t1/ 2) which is independent of the
initial concentration of contaminant within the medium. Renee, for the total degradation of the compound (sum of irreversible transformations), one has:
d [Cl dt
= k [c]n ; In2
k
k = decay rate (day-l)
3.1.3 Utilization of the processes of retention and transformation of contaminants in the evaluation of lUOundwater vulnerability
Up to now, the aspects of of retention, dissipation and irreversible transformations of contaminants in soils have not often been considered within a procedure of preliminary evaluation of groundwater vulnerability. These attenuation factors are usually taken into account in a qualitative manner, along with other factors (namely, hydrogeological factors) that are responsible for the groundwater vulnerability.
The importance of the attenuation factors of the contaminant increases, a priori, with the depth of the water table and with a decrease in the permeability (or in the grain-size of the soil constituents) of the unsaturated zone. Also, the importance of these factors is generally believed to increase along with content in clay and organic substances of the unsaturated zone. The attenuation factors are thus indirectly taken into account in most of the evaluation methods of groundwater vulnerability.
In regard to cartographie representations of vulnerability, the attenuation factors are often simultaneously considered with the permeability or the clay content of the unsaturated zone. Also, in the indexation methods, the weight (the multiplicative value which is assigned to
each factor of vulnerability and subjectively determined according to the relative importance of the factor) attributed to sorne pedological or hydrogeologieal factors is higher in order to take into account the importance of the attenuation factors that are associated to them (e.g.: permeability-adsorption).
The parameters that are susceptible to quantify the attenuation factors are therefore used within the indexation methods or the cartographie representations of vulnerability, as a more or less precise indication of the possible fate of these contaminants within the soil-groundwater system.
3.2 CONCLUSION
An evaluation method of groundwater vulnerability must mainly take into account, among other conditions of the medium, the persistence (constant of degradation) and the
mobility (or retardation factor determined by the partition coefficient Kd) of the contaminant in
the soil saturated and unsaturated zones. Used as a predictive indication or a preliminary estimation, a c1assical evaluation method of vulnerability (indexation, ... ) will thus not necessitate a complete description of the attenuation factors and their relations with the other
conditions of the system. It is mainly the representativeness and the level of utilization of these
attenuation factors, linked to the importance attributed to the risk and impact factors of a contamination, that determine the utility or the predictive quality of an evaluation of groundwater vulnerability.
CHAPTER4
DEVEWPMENT OF AN EVALUATION MODEL OF GROUNDWATER VULNERABILITY
4.1 CHOICE OF AN EVALUATION METHOD OF GROUNDWATER VULNERABILITY
The choice of an evaluation method of groundwater vulnerability to contamination mainly depends on both the objective and the concept associated to vulnerability. In this regard, we propose a choice based on, first, what we expect from an evaluation method and, second, the advantages and disadvantages of the different types of approaches.
Among the various methods available, the only ones that can possibly answer our preoccupations and fulfill our objectives are mathematical simulation models of the transport of contaminants. Indeed, these are the only tools that take into account the physical processes controling the transport and the persistence of contaminants. They provide, with a precision that naturally depends on the model itself, results (concentration, cumulated mas s, dis charge, time, ... ) that can be confronted with actual in situ measures. These results can be interpreted without ambiguity, by comparison with reference values and norms. In this regard, these are reliable methods that provide reproducible results. Moreover, in sorne cases, these tools can be used or designed to be used by non-specialists who will not have to provide any subjective interpretation of the results, meaning that the validity of the results will be that of the model itself.
4.2 COMPARISON OF TWO EVALUATION METHODS OF GROUNDWATER VULNERABILITY (after Banton and Villeneuve, 1987)
To reinforce this choice, we did perform a comparative study of two effective evaluation tools currently used in the USA Among the indexation-type methods, we chose the DRASTIC rating system which is the most recent and widely used method according to our literature
review. In the case of models that take into account major bio-physico-chemical processes, we opted for the PRZM model, its performance being acknowledged in recent literature. Rence, given these two methods, we evaluated the vulnerability of different sites in order to compare the results and the ability of each type of approach to take into account the parameters and various processes that intervene in the evaluation of vulnerability.
4.2.1 The DRASTIC method
The DRASTIC rating system (Aller et al., 1985), which was developed according to the Delphi consensus principle, is based upon the classification-indexation of sorne parameters. These parameters, which form the DRASTIC acronym, are the depth to water, the net recharge, the aquifer media, the soil media, the topography, the impact of the vadose zone and the conductivity of the aquifer. Each one of these factors can be indexed according to a class rating system. The weighted sum of the resulting indexes corresponds to the DRASTIC index. A second specifie set of weights (index ponderation) has been especially determined for the application of DRASTIC in an agricultural context. The authors of the DRASTIC method have detailed its conditions of application in terms of the interpretation of the vulnerability indexes. This interpretation is made through the comparison of the indexes of various sites located within same region. In this regard, the evaluation of a site is relative to that of another site and cannot be interpreted in an absolute manner.
4.2.2 The PRZM model
The PRZM simulation model of pesticide transport in soils (Carsel et al., 1984) is a deterministic mathematical model. It takes into account the various processes controlling transport: infiltration, percolation, uptake by plants, adsorption, degradation. These phenomena are characterized by a set of physical or empirical laws represented by their mathematieal equations. The numerical solution is carried out within each soil horizon defined by the user. As output, the model provides concentrations or masses of pesticide respectively expressed in fluxes or in cumulated quantities leaving a defined depth. The PRZM model, which was developed for agricultural use, has been successfully applied several times (Lorber and Offutt, 1985).
4.2.3 Comparison
The comparison between DRASTIC results and leaching concentrations obtained from
PRZM is based upon a set of 1000 sites and for various climates and pesticides. As we used the
DRASTIC method, we respected the condition that required aIl sites to belong to the same climatic region. On the other hand, we considered the possibility of an important variation in the physical characteristics of the sites. The characteristics and parameters of these sites were randomly selected (Monte Carlo drawings) from given probability distributions.
Both methods having been developed in the United States, we applied them for six different climates representing the overaIl climatic variability.
Three pesticides were used for the PRZM simulations. These pesticides were aldicarb, carbofuran and atrazine, aIl chosen for their different characteristics.
Simulations were performed over ten years of rainfall data, during which ten different cultures could be grown, chosen among seven. For each simulation, a unique application of pesticide was made between the emergence and maturation dates of the first year growth.
4.2.4 Results
We first observed that the purpose of an additive indexation method is to weight and average a collection of data (information), providing a Gaussian distribution of the indexes when the method is applied repeatedly. Then, the interpretation of the index value in itself appeared to be difficult, if not impossible. It is only as a relative value that it takes its significance, Le., with respect to another index value. This other value does not have an absolute position with respect to the potential of vulnerability; hence, the information provided through a single index is neither sufficient nor pertinent for the evaluation of the vulnerability of a site. On the other hand, it was possible by the means of the PRZM model, to evaluate the quantity of contaminant that had reached the water table and hence, to measure the level of aggression towards it. For instance, while the PRZM model has shown that, for a pesticide such
as atrazine, only 3% of the sites were threatened by contamination, DRASTIC has not indexed aIl these sites as most vulnerable. We thus reckon that only a method based on the modeling of processes should be used for the evaluation of vulnerability since it aIlows the quantification of the level of aggression for the studied site.
4.3 MATHEMATICAL MODELS OF SIMULATION
Defined as simplified representations of real systems, simulation models can be descriptive, physical, analogical or mathematical. Owing to the advent of computers, mathematical models have become more widely used. Most of them involve numerous calculations, hence leading to high CPU times and necessitating a large memory capacity.
Mathematical models are not aIl conceived according to the same approach. Contrary to the conceptual models based on the physical processes that control the movement of water and solutes in the soil, empirical models use rather simple relations established after actual observations and measures. Most of them are "black-box" models, meaning that there exists an input-output relation for these systems, but there is no possible description of the internaI phenomena generating this relation. Sorne of these models can provide satisfactory results, such as those representing simple phenomena with few intervening elements. In general, these models are of limited use, Le., for cases that do not require more complex models.
The advantage of conceptual models is that they are based upon the understanding of the processes and their representation as physicallaws. When these processes are numerous, models become more complex. It is then often necessary to adopt simplifying hypotheses that aIlows the neglect of the effect of one phenomenon with respect to another. Conceptual models can be c1assified in several ways: according to their reproduction of reality, the processes taken into account, the resolution mode of their equations, etc ... Rence, one can differentiate static models from dynamic ones, this distinction being based, for instance, upon the permanent or transitory state of water flow. Similarly, deterministic models use dis crete values for their parameters, while stochastic models make use of probability distributions reflecting the spatial or temporal variability of these parameters.
sometimes along with the flow equation. These two equations are based upon the principle of mass and energy conservation. The transport equation takes into acco_unt the terms of advection, dispersion, adsorption, degradation, transformation, filiation, etc .. Bach term is controled by one or several physical laws and the corresponding equations. Hence, the simulation is often obtained by solving an equation system, a solution that can be quite complex. Actually, the complexity of the equations may not always allow the existence of an analytical solution, thus entailing the use of a numerical solution.
4.4 SENSITIVITY OF A MO DEL TO ITS PARAMETERS (after Villeneuve et al., 1987) The spatial and temporal distribution of pesticide concentrations in the unsaturated zone depends on the parameters related to both the water flow and the transport of the compound. For the water flow, the most important parameters are those controling the infiltration rate (hydraulic conductivity) and the phenomena linked to the dispersion of a solute. The parameters intervening in the quantification of the persistence (half-life or constant of degradation, k) and retention (constant of adsorption, Kd) of pesticide in soils are most
important for predicting the transport of organics in the unsaturated zone. AlI these parameters directly intervene in models representing the adversion-dispersion and the bio-physico-chemical processes that control the fate of a pesticide in the saturated and unsaturated zones. The important in situ variability of these parameters can le ad to a large uncertainty in terms of the representativeness of the results if the model is very sensitive to the vari ab ilit y of sorne parameters.
It is therefore important to evaluate the sensitivity of a model with respect to its different parameters, especially those which are highly variable. This allows the user to assess the significance of the transport simulation results given lack of precision of the advection, dispersion, adsorption or degradation parameters. Moreover, the knowledge of the impact of possible mis specifications of these parameters on the simulation results or on the prediction of pesticide propagation towards the unsaturated zone, allows the deduction of practical consequences on the experimental evaluation of these parameters and on field sampling procedures.
4.4.1 Sensitivity analysis
The deterministic PRZM model was used to illustrate the importance of the variability
of adsorption (Kd) and degradation (k) parameters on the results of contamination in the
subsurface. The simulations allowed the evaluation of a profile of pesticide concentration at a given time in the different horizons of the unsaturated zone, or the establishment, as a function of time, of a breakthrough curve of the pesticide concentration reaching a given depth.
These simulations were carried out using the Portneuf region conditions, one of the most important sites of application of aldicarb in Québec (potato culture). The model was submitted to a large range of variation for the Kd or k values. The sensitivity analysis was performed by varying only one parameter at once, either Kd or k.
The objective of this sensitivity analysis is to show the impact of the precision or representativeness of the adsorption and degradation parameters on the simulation results of pesticide transport based on a purely deterministic model such as PRZM. For this reason, the impact on the model results of the variability of the Kd and k values around their respective
average values ("Rd and K) is particularly significant for the evaluation of the local
representativeness of such results.
Results especially indicate that a 15% uncertainty on K or a 24% uncertainty on "Rd
entails a possible modification of 100% on the predicted cumulated quantity of pesticide reaching the water table after three years. Similarly, a 100% uncertainty on the model results
after three years of simulation is induced by a 22% variability of K in the case of the pesticide
concentration leaving the root zone, and by a 17% variability in the case of the pesticide concentration reaching the water table. As regards the constant of degradation, aIl the results indicate that, at the end of each of the three years of simulation, a 15-25% variability can entail a 100% uncertainty on the simulation results.
4.4.2 Interest of a Monte Carlo approach
The results of transport simulation of a pesticide, i.e., the prediction of contamination by this pesticide, are very sensitive to the variations of input parameters such as adsorption and degradation. Given the spatial and temporal variability of the characteristics of a site, the
representativeness of these results is very uncertain if only one value of Kd or k is used. In such
conditions, a realistic evaluation of the contamination risk of groundwater, by means of a pure deterministic model such as PRZM, would necessitate a sampling strategy that could take into account in situ distributions for the input parameters. Given the significant variability of these parameters, only a sufficient number of field measures could allow the obtaining of more reliable results.
Hence, it appears that a stochastic approach for the simulation of the migration of a pesticide in the unsaturated zone offers an interesting option to take into account the variability of the soil characteristics, and therefore the variability of the parameters related to water flow and contaminant transport. It is this approach that must be retained for the elaboration of the quantitative evaluation model of groundwater vulnerability that we want to develop. It must be stressed however, that the lack of field measures allowing an adequate characterization of the in situ distributions of parameters could induce sorne uncertainty as regards the results of the stochastic simulation of transport in the unsaturated zone, but not as significantly as in a purely deterministic approach.
4.5 IMPORTANCE OF THE DISPERSION PARAMETER (after Isabel and Villeneuve, 1987)
The important spatial variability of soil properties, and the complexity of the processes intervening in the modeling of the fate of pesticides, pose a problem about the significance and the representativeness of results from deterministic models. Following an exhaustive review of models and hypotheses intervening in the modeling of transport in the vadose zone, Nielsen et
~ (1986) conclude that results from a deterministic approach will have to be used within a
Stochastic models are the results of such an integration. In these models, it is first assumed that the classical convection-dispersion deterministic equation is valid for a soil column of a limited lateral extent. Then, simulations are repeatedly carried out given this deterministic model, the values of soil hydraulic properties being randomly selected from assigned probability distributions. Such an approach is called stochastic modeling or stochastic type approach. Results from these simulations provide statistical data on aU the conditions entailed by the spatial variability of the parameters. Sposito et al. (1986) have exposed numerous theoretical problems related to this type of approach. Among other difficulties, they observe that results from convection-dispersion stochastic modeling are insensitive to the dispersion coefficient value. The authors conclude that the spatial variability of the infiltration rate is sufficient to explain the dispersion observed at the field scale. It is then possible to disregard dispersion and simply use a convection stochastic model. This type of model being much simpler, it aUows analytical solutions such as those of Simmons (1982). Moreover, and this is a very significant advantage, there is no more need with such a model to estimate the dispersion coefficient.
It is interesting to de termine under which conditions the results from these two models
are sufficiently similar to justify, in practical applications, the omission of the dispersion coefficient.
4.5.1 Results
A maximum absolute deviation of 0.5 between both models can be chosen as a likeness criterion. This deviation is not very significant with respect to the poor precision of the data usually available to simulate the fate of pesticides in the unsaturated zone. The convection stochastic model can thus advantageously replace the convection-dispersion stochastic model when values for the Peclet number and the coefficient of variation are such that the likeness criterion is respected.
The dispersion coefficient can be calculated from the infiltration rate and the dispersivity (D = av). The dispersivity observed in soils is, according to Bresler and Dagan
coefficient of variation around 0.5.
Given such values (under actual field conditions), the stochastic utilization of a deterministic convection model is numerically equivalent to the stochastic utilization of a deterministic convection-dispersion model, when the infiltration depth is more than 1.2 m.
4.5.2 Interest of a convection model
Since stochastic modeling with a convection model can advantageously replace stochastic modeling with a convection-dispersion model under these conditions, and since the study of groundwater vulnerability to contamination considers the quantity of pesticide reaching the water table (its depth being usually more than 1.2 m), it appears useless to take into account the dispersion phenomenon.
CHAPTERS
VULPEST
A GROUNDWATER YULNERABILI1Y EVALUATION MODEL
5.1 THE VULPEST MO DEL
It has been established that in order to adequately simulate the transport of a dissolved pesticide through the unsaturated zone, one should use a stochastic approach, disregard dispersion, and take into account the contaminant degradation. It has also been established that, for the stochastic approach to be efficient, a model with a minimum computation time should be used. Finally, it has not been possible to select and adapt an existing simulation model or method that would satisfy aH the constraints and requirements of the evaluation of groundwater vulnerability under real field conditions. To establish the new VULPEST model, it is admitted that transport can be adequately modeled by the advection differential equation. An exact solution of this equation is used in order to diminish computation time and minimize calculation errors. This deterministic model will be used within a stochastic simulation approach (Monte Carlo type) to take into account the spatial variability of soil hydrogeological characteristics defmed at the scale of the site.
5.1.1 The transport eguation
The vertical transport of contaminants in a porous medium is usually described by the following differential equation:
ac
ac
= -v +D (5.1)
at
az
where v (pore water velo city) represents the advective component of transport and D the dispersive component. The term D includes the phenomena of molecular diffusion and
kinematic dispersion. As opposed to the phenomenon of diffusion, which can be described by Fick's law, kinematic dispersion appears to be the result of a combination of factors. While sorne authors admit that kinematic dispersion can also be described by Fick's law, other ones have shown that their phenomenon can be the result of local variations in pore water velocity (Matheron and De Marsily, 1982; Simmons, 1982; Dagan, 1982; Sudicky, 1986).
In a deterministic approach, where the values of the different parameters are fixed, the dispersive term of the transport equation is necessary to represent the reality of the phenomenon. On the other hand, in a stochastic approach, where the spatial and temporal variabilities of parameters are considere d, the kinematic dispersion resulting from the variation in pore water velocity is represented by the variability of the parameters affecting water movement. The effect of molecular diffusion being most often very small relative to advection (and kinematic dispersion), this term can often be neglected.
Admitting that the dispersion term of the equation can be representative of the phenomenon, Isabel and Villeneuve (1987) observe that under actual field conditions and in stochastic simulation, this term has very little effect on the results. Since the stochastic approach takes into account the spatial variability of soil hydraulic properties, neglecting the dispersion term of the equation does not entail any significant error.
As for percolation through the soil, this can be viewed as movement through a series of vertical tubes of different dimensions (Van der Zee and Van Riemsdijk, 1986; Van Ommen,
1985). The unidimensional equation governing the transport of a solute in a tube is:
ac
ac
= -
v (5.2)at
az
The spatial variability in the hydraulic conductivity of these tubes can explain the local variations in pore water velo city, resulting in the phenomenon of dispersion.
The VULPEST model is based upon this approach and takes into account the spatial and temporal variability of the various parameters. In this perspective, the dispersion term of the transport equation is omitted.
This model being especially designed to deal with pesticides, the process of adsorption onto the solid phase must be taken into account. It is generally assumed that adsorption can be represented by a reversible instantaneous equilibrium characterized by the solid-liquid phase partition coefficient, K (Bourg and Sauty, 1987). This process is described by:
Ssol. = KCliq. (5.3.a)
It is also assumed that the different pro cesses involved in pesticide degradation can be represented by first order kinetics:
Q = ÀBC
+
I-'pS (5.3.b)where À and 1-' represent degradation both in the liquid phase and on the solid phase, p
the bulk density, and B the water content.
These two terms can be introduced into the transport equation:
ac
ac
R = -v - fJC
at
az
where R
=
1 + pK/B and fJ=
À + I-'pK/BHence, fJ
=
ÀR when 1-'=
À5.1.2 The Monte Carlo approach
(5.4)
The stochastic method of introducing variability of parameters for the simulation of contaminant transport can be achieved by a Monte Carlo approach. This approach consists of carrying out a sufficient number of simulations so that the distribution of values assigned to each parameter, these values being randomly selected from a chosen probability distribution, approximates the given distribution.
The VULPEST model allows the declaration of different types of probability
random selection of a value from a given distribution is achieved in two stages. First, a probability density equiprobable between 0 and 1 is calculated by means of an appropriate random-number-generating algorithm. Second, the value of each parameter is computed by me ans of the inverse probability density function of the parameter given distribution.
In order to obtain a result that is statistically close to reality, a sufficient number of simulations must be carried out. For the VULPEST mode l, given the possible high variability of the different parameters, the number of simulations has been set to 1000. This number is sufficiently large to allow statistical treatment of the results.
5.1.3 The analytical solution
Since the Monte Carlo approach requires a large number of simulations, the choice of the method of solution for the transport equation is of great importance. For this mode l, an analytical solution has been preferred to a numerical one. This solution offers other advantages su ch as the ease of entry of the data, the stability of the calculations, and the reliability of the results. With the following boundary conditions,
C=o
for z > 0 and t = 0(5.5)
C-C - 0 for z
=
0 and t > 0equation 5.4 admits as a solution:
C(z,t) = 0 for t < zR/v
(5.6)
C(z,t) = Co exp(-zÀR/v) for t > zR/v
This solution, defined for aIl spatial and temporal points, requires aIl parameters to remain constant in space and time. Considering the soil as a collection of continuous tubes, the vertical continuity of water flow is assumed. The model nevertheless allows the separation of the soil into distinct horizons. These horizons, each one with its specific characteristics, are defined by the user.
Water movement acts as a transitory phenomenon over time. Taking most important climatic conditions into account, the model integrates monthly rainfall,_ evaporation and transpiration amounts, to produce an average value for infiltration. From this value, the model evaluates the average pore water velocity as a function of the soil permeability and porosity. To a certain extent, the stochastic approach allows the simulation of the transitory aspect of flow by integrating the variability of the factors influencing infiltration.
5.1.4 The results of the model
Different types of results are obtained from such simulations. First, the model provides a stochastic breakthrough curve corresponding to the integration over time of the breakthrough curves from each Monte Carlo simulation. The maximum concentration, the average annual concentration and the cumulated amount (mass) are also provided for each Monte Carlo simulation. The breakthrough curves are obtained for a given depth, such as the depth to the water table according to the definition of groundwater vulnerability to contamination.
These results are presented in the form of files and graphs (curves, histograms), according to the user's needs. The results can be treated statistically, in terms of the risk (probability) of exceeding the norms or reference values entered by the user.
5.2 THE VULPEST SOFtWARE
The VULPEST software version 2.00 is the translation into computer language of the VULPEST model. This software allows a rapid simulation of the course of the contamination by a pesticide in the unsaturated zone. It essentially respects the hypotheses, conditions and constraints that have been set out in the previous sections.
The VULPEST software version 2.00 is conceived to be used as a management tool by non-technical personnel. It is structured and programmed to interact with the user who enters data. This user-software interaction is made more effective by the possibility of visualization,
which has been provided for in the software. This user friendly interactive structure becomes evident at the first use of the software. Indeed, the practical application of the software is based on a logical structure of overlapping windows that leads the user from ente ring data values to visualizing results.
5.2.1 The software
The VULPEST software version 2.00 consists of 4 main modules:
1- Definition of data; 2- Simulation;
3- Visualization of results; 4- Management of files.
5.2.2 Definition of data
It is at this level that the user enters data values for the stochastic simulations. The user
also chooses the theoretical distributions that will best represent the observed distribution for each input variable. These data are of four types:
1- Climatic data; 2- Soil characteristics; 3- Crop data;
4- Properties of pesticide.
5.2.3 The simulation module
This module consists of two elements:
1- Choice of the number of simulations; 2- Simulation.
It is in this module that the stochastic simulations are carried out. Each user can choose
ample for a statistical analysis of the results).
For each Monte Carlo simulation (loop), the soil parameters are initialized in the subroutine INISOL. The values are randomly drawn from the distributions, beginning with the coefficients entered in (1) by the user. DISTRI returns a value of the parameter for the chosen distribution (dis crete, uniform, normal, lognormal, or asymmetrical). These calculations are first carried out by means of the RND function, which provides random numbers of equal probability between 0 and 1. Then, the XNOR function supplies a normally distributed value which corresponds to a given probability between 0 and 1. The final calculations establish the agreement between the probability density functions of the different distributions.
For each simulation, the parameters of the pesticide, the application and the crop are initialized in the subroutine INIAPL, in the same manner as above. INIAPL also computes the average infiltration as a function of climatic data (rainfall, potential evapotranspiration, temperature) and the water requirement of the crop.
From these initial values, VULPEST establishes the parameters of the transport equation by means of which the analytical solution is calculated.
5.2.4 The visualization of results
This module consists of four elements, each one corresponding to a particular result of the model. The simulation results are the maximum concentrations (piston displacement) and the corresponding times (times of arrivaI and duration). From these values, the program calculates the average annual concentrations and the cumulated amounts (masses). The stochastic breakthrough curve is finally calculated by an integration over time of the maximum concentrations.
These elements are defined as: 1- Maximum concentrations;
2- Annual concentrations; 3- Cumulated masses;
4- Stochastic breakthrough curve.
The visualization module allows the representation on the screen of these various results in the form of curves or tables.
For the first three elements, the user can:
1- Draw a curve of categories of values; 2- Draw a histogram;
3- Establish exceeding probability tables; 4- Verify a norm.
5.2.5 The manaeement of files
In this module, the user can choose files other than the default ones. He can also save files created during data manipulation and entry as weIl as result files, if desired.
This last module consists of the four following elements:
1- Reading of data files;
2- Writing to disk of data from memory; 3- Reading on disk of results;
4. Writing to disk of results.
CHAPTER6
APPLICATION OF THE VULPEST MO DEL ON 'IWO SITES IN OUEBEC
6.1 INTRODUCTION
The VULPEST model has been used for the quantitative evaluation of groundwater vulnerability at two agricultural sites located in Québec. The application of the model at the se
two sites confirms its interest in predicting the quantity of pesticide which can reach the water
table. Carried out at the sites of Portneuf and Saint-Augustin, the simulations take into account twO different types of crops and pesticides.
6.2 DESCRIPTION OF THE SITES OF APPLICATION
The sites of application of the VULPEST model are currently active agricultural zones. At both sites, the groundwater quality (pesticide analysis) has been tested over a more or less long period of time. These sites are on a different scale (a small experimental farm field and a large crop region), and the types of crops and pesticides associated with each of them are also very different.
6.2.1 The Portneuf re2Ïon
6.2.1.1 Statement of the problem
Since 1984, cases of contamination by aldicarb, an insecticide used to protect potato crops, have been identified by means of a series of water sampling from 25 private or municipal wells located within or near agricultural zones. Very variable concentrations in aldicarb (from 0 to 30 p.g/l) have been measured between July 1984 and July 1986 in the water of sorne wells located near the municipalities of Sainte-Catherine, Pont-Rouge and Saint-Ubald. The monitoring of the water quality from wells within this area is presently provided by the Ministère de l'Environnement du Québec (TEMIK program).
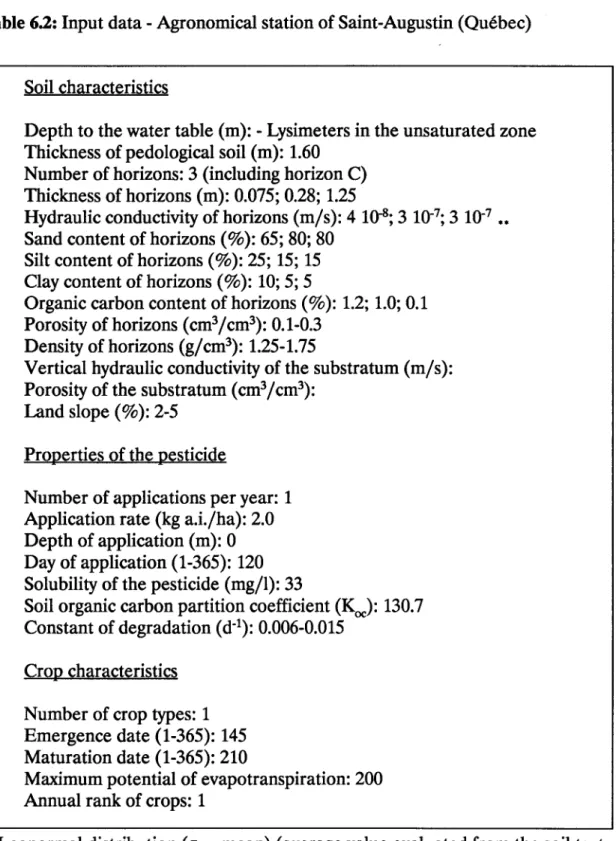
Table 6.1: Input data - Portneuf region (Québec)
Soil characteristics
Depth to the water table (m): 3-5 Thickness of pedological soil (m): 3-5
Number of horizons: 5 (inc1uding horizon C)
Thickness of horizons (m): 0.18; 0.08; 0.08; 0.41; 2.25-4.25
Hydraulic conductivity of horizons (mis): 10-5 ••
Sand content of horizons (%): 91; 87; 88; 96; 96
Silt content of horizons (%): 8; 13; 12; 3; 4
Clay content of horizons (%): 1; 0; 0; 1; 0
Organic carbon content of horizons (%): 1.51; 1.27; 2.20; 0.44; 0.15
Porosity of horizons (cm3/cm3
): 0.1-0.3
Density of horizons (g/cm3): 1.25-1.76
Vertical hydraulic conductivity of the substratum (mis):
Porosity of the substratum (cm3
1
cm3):Land slope:
Properties of the pesticide
Number of applications per year: 1 Application rate (kg a.i./ha): 2.24 Depth of application (m): 0.05 Day of application (1-365): 135
Solubility of the pesticide (mg/l): 6000
Soil organic carbon partition coefficient (Koc): 3.1
Constant of degradation (d-1): 0.01-0.03
Crop characteristics Number of crop types: 1 Emergence date (1-365): 165 Maturation date (1-365): 225
Maximum potential of evapotranspiration: 200 Annual rank of crops: 1
•• Lognormal distribution (a
=
10-5) (average value evaluated from the soil texture6.2.1.2 SOU characteristics
Potato crop soils are relatively homogeneous and mainly consist of medium to coarse grain sand (Morin sand). The soil belongs to the podzol humoferric orthic group, its average content in organic matter varying between 3% and 5%.
6.2.1.3 Application of the pesticide
The aldicard used on the site is in the form of grains, i.e., the pesticide (with 5%, 10% or 15% of active ingredient or a.i.) is mixed with an inert substrate made of gypsum or corn residues. It is applied yearly at the rate of 2.24 kg a.i.jha. At seed-time (mid-May), aldicarb granules are mechanically buried at a depth that normally vat:ies between 5 and 10 cm: the pesticide is then leached from its support when entering in contact with soil humidity. The emergence and maturation of crops occur towards mid-June and mid-August respectively, and the harvest takes place near mid-September. The root zone of the crops varies between 15 and 45 cm.
6.2.1.4 Input data of the VULPEST model (see table 6.1)
6.2.2 The amnomical station of Saint-Aupstin 6.2.2.1 Context
The agronomical station of the Faculté des Sciences de l'Université Laval is located in Saint-Augustin-de-Desmaure (Portneuf). Among other experimental crops, this station contains
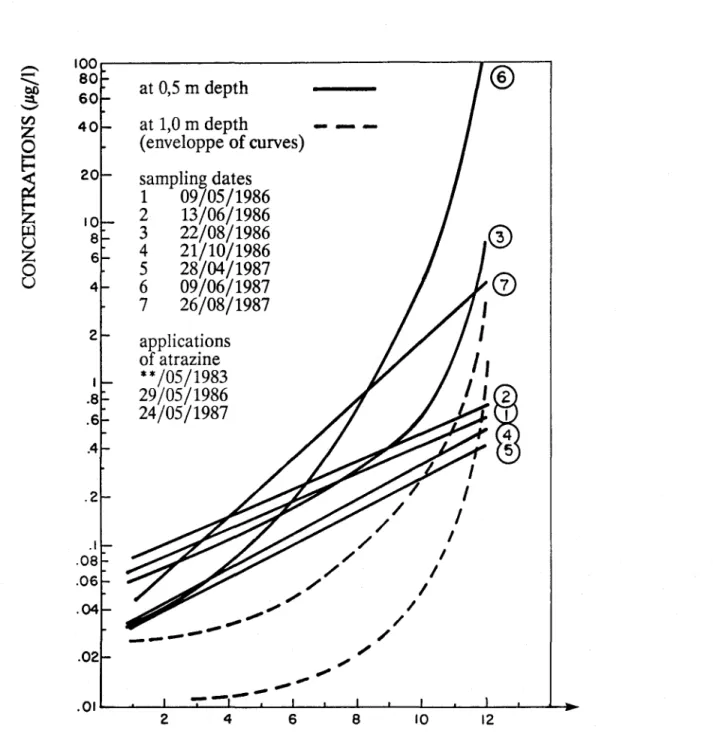
a small field of sweet corn (52 x 18 m2) treated with the herbicide atrazine. A network of 30
pressure-vacuum soil water sampi ers (lysimeters) has been set up on tbis site by the Ministère de l'Environnement du Québec in December 1985. These lysimeters have been installed for the monitoring of the interstitial water quality under actual crop conditions, in the unsaturated zone down to a depth of about 1.5 m.
Table 6.2: Input data - Agronomical station of Saint-Augustin (Québec)
Soil characteristics
Depth to the water table (m): - Lysimeters in the unsaturated zone Thickness of pedological soil (m): 1.60
Number of horizons: 3 (inc1uding horizon C) Thickness of horizons (m): 0.075; 0.28; 1.25
Hydraulic conductivity of horizons (mis): 4 10-&; 3 10-7; 3 10-7 **
Sand content of horizons (%): 65; 80; 80
Silt content of horizons (%): 25; 15; 15
Clay content of horizons (%): 10; 5; 5
Organic carbon content of horizons (%): 1.2; 1.0; 0.1
Porosity of horizons (cm3
1
cm3): 0.1-0.3Density of horizons
(gl
cm3): 1.25-1.75Vertical hydraulic conductivity of the substratum (mis):
Porosity of the substratum (cm3
1
cm3):Land slope (%): 2-5
Properties of the pesticide
Number of applications per year: 1 Application rate (kg a.i./ha): 2.0 Depth of application (m): 0 Day of application (1-365): 120
Solubility of the pesticide (mg/l): 33
Soil organic carbon partition coefficient (KoC>: 130.7
Constant of degradation (d-1): 0.006-0.015
Crop characteristics Number of crop types: 1 Emergence date (1-365): 145 Maturation date (1-365): 210
Maximum potential of evapotranspiration: 200 Annual rank of crops: 1
** Lognormal distribution (0- = me an) (average value evaluated from the soil texture
The main advantages of this site in view of the application of an evaluation method of groundwater vulnerability are the constant control of agricultural practices, the complete record of applications of atrazine, and the particular type of soil.
6.2.2.2 Physical characteristics of the soil
The site is located at the limit of an alluvial terrace and the relief is variable (slope: 2-5%). The soil is artificially drained: it is related to the Saint-Antoine series (original materials perturbed on the surface).
The texturaI class of the horizon Ap of this site has been identified as a fine sandy loam (Baril, 1974) and the pedological report of the Portneuf County indicates that the soil from the Saint-Antoine series found in this county is a coarse sandy loam (Raymond et al., 1976). The organic matter content on the soil surface is near 1.5% (September 1986) or 2.2% (April 1986).
There is a clay schist at an average depth of 1.6 m, which is the maximum depth reached by the
set up lysimeters.
6.2.2.3 Application of the pesticide
Since 1986, the Ministère de l'Environnement du Québec has carried out several series of water sampling from the lysimeters for atrazine analysis.
The atrazine, which is in the form of a wettable powder, is pulverized on the site at the time of emergence of weeds, about one week after seed-time. In 1986, the application rate of atrazine on the experimental site has been 2 kg a.i./ha. Seed-time is at the beginning of May, the emergence of crops ocCUrs towards mid-May, and the maturation and harvest take place at the beginning of August. The root zone of the crops is between 60 and 120 cm.
6.2.2.4 Input data of the VULPEST model (see table 6.2)
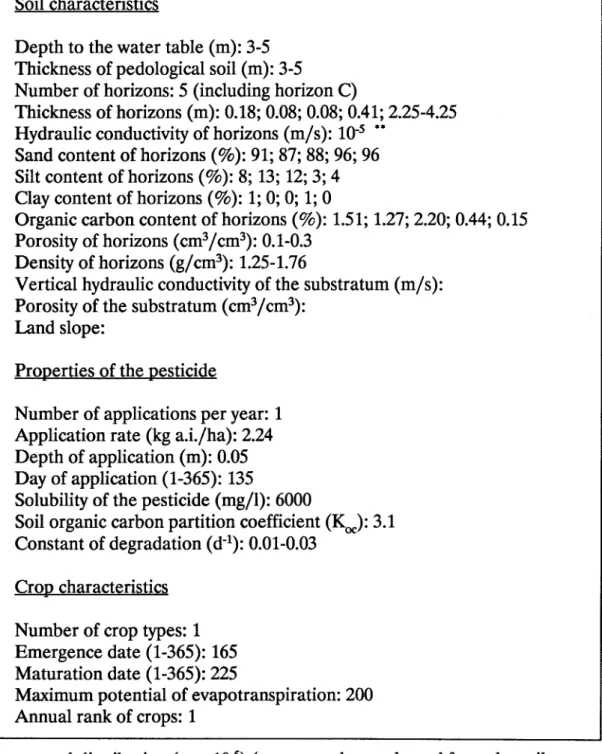
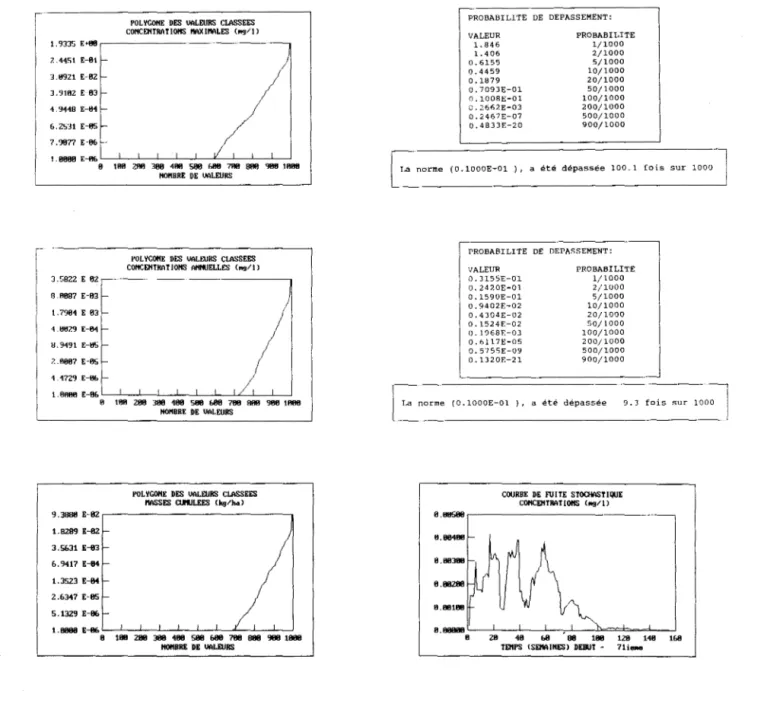
Figure 6.1: Results from the VULPEST model for the Portneuf region
POLYGOIiE DES VALEURS CLASSEES CotfCEHTRATlottS f1AXII'tALES (,.g/l) 3734.888 ~---. 33bl.328 2987.847 2&H.3b& 2248.895 1067.484 1493.923 1128.443 746.9&2 373.481 8. B88 L.-L_.±::=L....__"_ _ _'___--.l_--'--_.L-~_,____..:' 8 188 288 3BB 488 588 (.11(1 7811 888 988 1888 HONDRE DE VALEURS
POL YœltE DES VALEURS CLASSEES COHCEI1TRATIOHS Altl«JELLES ( . . I l l 1.925 , - - - , 1.7321- 1.5481-1. 347 f-1.155 8.%2 8.778f-8.577f- ~ 8.38Sf- 8.1921-8.888 L---L_L--I...=,==::±::===l---..l_..L~ 8 188 288 388 488 588 &88 7811 888 988 1 _ _ ORE DE VALEURS
POLYGONE DES VALEURS CLASSEES
MSSES cuttULEES Ckg/ha.)
1.l1&li , - - - , 1.&74 1.488 1.382 1.11& 8.938 8.744 8.5sa 8.372 8.181> 8._L...-L--~~c=-L---'---~L....--"---.L-~ __ ~ 8 188 Z88 388 488 S88 &88 788 888 988 1 _ _ ORE DE VALEURS PROBABILITE DE DEPASSEMENT: VALEUR 3695. 3550. 3330. 3176. 2862. 2414. 2047. 1442. 496.4 11. 40 PROBABILITE 1/1000 2/1000 5/1000 10/1000 20/1000 50/1000 100/1000 200/1000 500/1000 900/1000
La norme (0.1000E-01 ), a été dépassée 984.3 fois sur 1000
PROBABILITE DE DEPASSEMENT: VALEUR 1.711 1. 279 0.8539 0.7250 0.5785 0.3801 0.3033 0.1979 O.6J67E-Ol O.I50lE-02 PROBABILITE 1/1000 2/1000 5/1000 10/1000 20/1000 50/1000 100/1000 200/1000 500/1000 900/1000
1 La norme (0.1000E-01 ), a été dépassée 781. 3 fois sur 1000 1
COURDE DE FU !TE STOCHASTIQUE COHCEI1TRATIOIiS ( . . I l l
8 . 8 8 8 , - - - ,
8.488
8.288
18 15 Z8 25 38 35 48
6.3 EVALUATION OF GROUNDWATER VULNERABILI1Y
6.3.1 Results of the VVLPEST model
The results obtained by means of the VULPEST model are maximum concentrations (reaching the water table), average annual concentrations, cumulated masses, and the stochastic breakthrough curve. These results are available in the form of files of rank ordered values, and as graphs.
The graphs shown on figures 6.1 to 6.3 are sorne of the results obtained from the VULPEST software. Polygons of rank ordered maximum concentrations, average annual concentrations and cumulated masses are presented as normal or se mi-log scale graphs. The stochastic breakthrough curve and exceeding probabilities are also given for maximum concentrations and annual averages. A value of 0.01 mg/l (10 ppb) is used as an average norm of water quality for numerous pesticides.
6.3.2 Interpretation of the results
The maximum concentration reaching the water table, a result of each Monte Carlo simulation, represents the highest concentration that could be measured at a given point of the saturated - unsaturated zone interface. It is a point concentration in space and time of the interstitial water of the unsaturated zone.
The average annual concentration of each Monte Carlo simulation could be related to the measured concentration at a given point of the saturated zone (water table), near the interface. Indeed, if it is admitted that the water flow is relatively weak, and that water recharge takes place vertically through the unsaturated zone, the concentration at a given point of the saturated zone near the water table would result from the mixing of concentrations reaching the water table through the unsaturated zone, during all the annual hydrological cycle.