Université de Montréal
The genetics of red blood cell density, a biomarker of
clinical severity in sickle cell disease.
par Yann Ilboudo
Programme de bio-informatique Faculté de médecine
Mémoire présenté à la Faculté des études supérieures et postdoctorales en vue de l’obtention du grade de M.Sc.
en bio-informatique
Déc. 2016 © Yann Ilboudo, 2016
Université de Montréal Faculté des études supérieures
Ce mémoire intitulé:
The genetics of red blood cell density, a biomarker
of clinical severity in sickle cell disease.
présenté par
Yann Ilboudo
a été évalué par un jury composé des personnes suivantes :
Sylvie Hamel, Ph. D.
président-rapporteurGuillaume Lettre, Ph. D.
directeur de rechercheYves Pastore, MD.
membre du juryiii
Résumé
L’anémie falciforme est l’une des maladies du sang les plus répandues chez l’homme. Les complications liées à la maladie sont systémiques. Influant virtuellement tous les organes du corps, cette affection provoque des crises de douleurs imprévisibles et aigües dont les complications mènent parfois à la mort. Le processus à travers lequel un globule rouge sain prend la forme d’une faucille est bien décrit dans la littérature; sous désoxygénation, l’eau et les solutés se retirent des globules rouges, la concentration d’hémoglobine S augmente et nous donne des globules rouges denses et déshydratés qui par la suite deviennent falciformes. Les traitements d’aujourd’hui sont pour la plupart expérimentaux et coûteux. De plus, leurs efficacités à long terme varient d’un patient à l’autre. Il est donc impératif de trouver un biomarqueur qui est à la fois abordable et qui améliore la santé des malades de façon systématique. La densité des globules rouges est un biomarqueur largement ignoré par la communauté médicale dans le contexte de la drépanocytose. Aborder l’étude de la sévérité de cette maladie en se concentrant sur la densité des globules rouges nous met en position d’identifier des traitements pour réhydrater les érythrocytes et leur rendre leur forme originale de disque biconcave. Plusieurs études cliniques et physiologiques se sont penchées sur ce biomarqueur sans explorer le volet génétique. Nous avons cherché à éclaircir cet aspect en menant une étude d’association pangénomique et en examinant les séquences exomiques d’individus avec des mesures de densité extrême. Notre étude d’association pangénomique n’a pas conduit à la découverte de nouveau loci, probablement parce que la taille de notre échantillon, et donc notre puissance statistique, était limitée. En revanche, à travers notre approche de priorisation, nous avons découvert un marqueur intronique qui contrôle l’expression d’ATP2B4, la protéine principale de transport de calcium dans les hématies. Notre séquençage exomique a identifié deux mutations rares faux-sens chez un même patient; l’une dans
ATP1B2, un transporteur de Na+/K+, et l’autre dans SPTB, le gène du -spectrin. Ces mutations
expliqueraient pourquoi ce patient a le pourcentage de densité le plus élevé parmi tous nos patients séquencés, et pourquoi il vit avec plusieurs complications de la maladie. Finalement, nous avons localisé une mutation faux-sens rare chez deux patients avec un indice élevé de densité de globule rouge, dans PIEZO1, le canal ionique mécano-sensitif. La mutation est prédite délétère par deux algorithmes de prédiction de fonction protéique.
Mots-clés: Analyse pangénomique, séquençage d’exome, anémie falciforme, densité des globules
rouges, hydratation des hématies, eQTL. .
iv
Abstract
Sickle cell disease is one of most common blood disorder amongst human. The complications associated with the disease are systemic. They damage virtually all the organs of the body, causing severe, unpredictable pain episodes, which repercussions can eventually lead to death. The process through which a biconcave, healthy red blood cell assumes a crescent-shape is well described in the literature; under deoxygenation, as water and solutes leave erythrocytes the concentration of hemoglobin S increases thus giving us dense dehydrated cells and subsequently sickled cells. Today’s current therapies are for the most part experimental, costly, and vary widely in their long-term effectiveness from patient to patient. There is, therefore, a pressing need, to identify a biomarker that is cost-effective and provides positive health outcomes to patients. The density of red blood cell is a biological indicator largely ignored by the medical community in sickle cell disease. Exploring erythrocytes density can facilitate the development of new therapies by targeting channels to rehydrate cells back to their normal shape. Clinical and physiological characterizations of this phenotype exist in many studies, but the genetic characterization is absent. We attempted to elucidate the genetic underpinning of this phenotype, by conducting a genome-wide scan, and examining the whole-exome sequences of individuals with extreme red blood cell density. Our genome-wide association study did not highlight any new loci due to our limited statistical power reflected by the cohort’s small sample size. However, our prioritization approach highlighted an intronic variant that controls the expression of
ATP2B4, the main calcium pump in erythrocytes. Our whole-exome sequencing experiment pointed out
two rare missense mutations in the same patient; one in ATP1B2, a Na+/K+ transporter, and the other in
SPTB, the -spectrin gene. These variants could explain why he has the highest measured density of red
blood cells amongst all of our sequenced patients, and why this person experiences several of the disease-related complications. Another rare missense mutation in two patients with elevated levels of dense cells was discovered in PIEZO1, the mechanosensitive ion channel. The mutation is predicted to be deleterious by both protein function prediction algorithms.
Keywords: Genome wide association, whole-exome sequencing, sickle cell disease, erythrocyte
v
Table of Content
Résumé ... iii
Abstract ... iv
List of Tables ... viii
List of Figures ... ix
List of Abbreviations ... xi
Acknowledgments ... xii
Chapter 1 . Introduction ... 13
1.1 Sickle Cell Disease Historical Background ... 13
1.2 Sickle Cell Disease Burden in Today’s Society ... 14
1.3 Red Blood Cell and Hemoglobin ... 17
1.4 Sickle Cell Disease and Malaria ... 19
1.4.1 Historical Perspective ... 19
1.4.2 Pathophysiology ... 20
1.4.3 Burden and Protection ... 20
1.5 Pathophysiology of Sickled Cells ... 22
1.6 Complications of Sickle Cell Disease ... 25
1.7 Known Biomarkers of Severity in Sickle Cell Disease ... 28
1.8 Therapies in Sickle Cell Disease...31
1.8.1 Hydroxyurea ... 31
1.8.2 Bone Marrow Transplant ... 31
1.9 Genome-Wide Association Studies ... 31
1.10 Density of Red Blood Cell in Sickle Cell Disease ... 33
1.10.1 Biology and Physiology of Red Cell Hydration ... 33
1.10.2 Sickle Cell Disease and Clinical Trials... 36
1.11 Research Objectives ... 38
1.12 Thesis Outline ... 38
Chapter 2 . Methods ... 39
2.1 Study Sample ... 39
2.2 Phenotype Quality Control ... 40
vi
2.4 Whole-Exome Sequencing Quality Control ... 43
2.5 Imputation ... 43
2.6 Statistical Methods for Association Testing ... 44
2.6.1 Power and Replication ... 44
2.6.2 Single Variant Testing ... 45
2.6.3 Gene-Based Testing ... 46
2.7 Bioinformatics Analysis ... 47
2.7.1 Bioinformatics Software ... 47
2.7.2 Genotyping Quality Control and Imputation ... 48
2.7.3 Genome-Wide Association, Prioritization, VEP Annotation ... 48
2.7.4 Whole Exome Sequencing Analysis ... 48
Chapter 3 . Genome-Wide Association Study of Erythrocyte Density in Sickle Cell Disease Patients50 3.1 Author Contribution ... 50 3.2 Affiliations ... 50 3.3 Abstract ... 51 3.4 Introduction ... 52 3.5 Methods ... 54 3.5.1 Ethics Statement... 54
3.5.2 Samples and DNA Genotyping ... 54
3.5.3 Statistical Analyses ... 54
3.5.4 Genetic and functional prioritization of Genetic Variants ... 55
3.5.5 RNA Extraction and qPCR ... 56
3.6 Results... 58
3.6.1 Genome-Wide Association Study of Red Blood Cell Density ... 58
3.6.2 Variant Prioritization ... 59
3.6.3 ATP2B4 and DRBC in Sickle Cell Disease Patients ... 60
3.7 Discussion ... 61
3.8 Acknowledgements ... 62
3.9 Conflict of Interest ... 62
Chapter 4 . Whole-Exome Sequencing of Sixty-Four Patients with Sickle Cell Disease ... 72
4.1 Motivation ... 72
vii
4.3 Results and Discussion ... 73
4.3.1 Cohort Description ... 73
4.3.2 Data Mining Variant Annotation and Correlation ... 74
Chapter 5 . Discussion ... 79
5.1 Aims ... 79
5.2 Significance of Results ... 79
5.3 Strengths and Limitations ... 80
5.4 Recommendations ... 81
viii
List of tables
Chapter 1
TABLE 1.DIFFERENT TYPES OF SICKLE CELL DISEASE ... 23 TABLE 2.GEN-MODCOHORT DESCRIPTION ... 39
Chapter 2
TABLE 3.SUMMARY OF BIOINFORMATICS TOOLS ... 47
Chapter 3
TABLE 1. DESCRIPTIVE STATISTICS OF THE GEN-MOD AND CSSCD SICKLE CELL DISEASE PARTICIPANTS ANALYZED IN THIS STUDY ... 63 TABLE 2.TOP SINGLE VARIANT ASSOCIATION RESULTS WITH RED BLOOD CELL DENSITY (DRBC)
IN 374 PARTICIPANTS FROM GEN-MOD ... 64 TABLE 3.TOP ASSOCIATION RESULTS BETWEEN VARIANTS PREVIOUSLY ASSOCIATED WITH MEAN CORPUSCULAR HEMOGLOBIN CONCENTRATION (MCHC) IN NON-ANEMIC EUROPEAN -ANCESTRY INDIVIDUALS AND RED BLOOD CELL DENSITY IN 374 SICKLE CELL DISEASE PATIENTS ... 66 SUPPLEMENTARY TABLE 1. LIST OF CANDIDATE GENES WITH A POTENTIAL ROLE IN RED BLOOD
CELL HYDRATION. ... 70
Chapter 4
ix
List of figures
Chapter 1
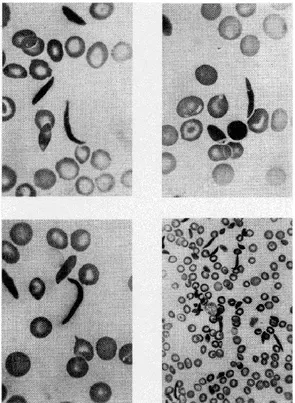
FIGURE 1 Blood Smear of Sickle Cell... 14
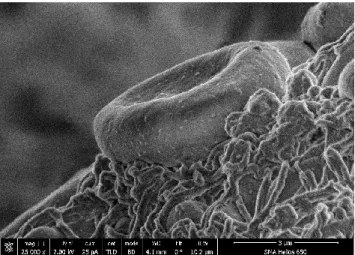
FIGURE 2 Scanning Electron Micrograph of Healthy Erythrocyte ... 15
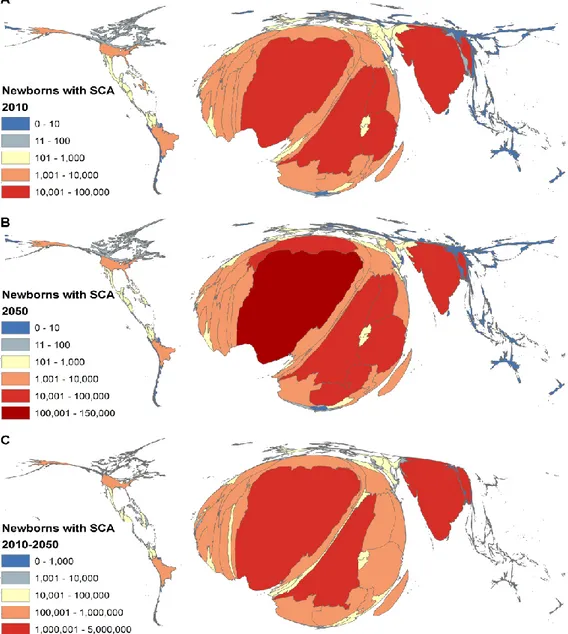
FIGURE 3 World's Distribution of Infants with SCA ... 16
FIGURE 4 Hemoglobin Molecule ... 18
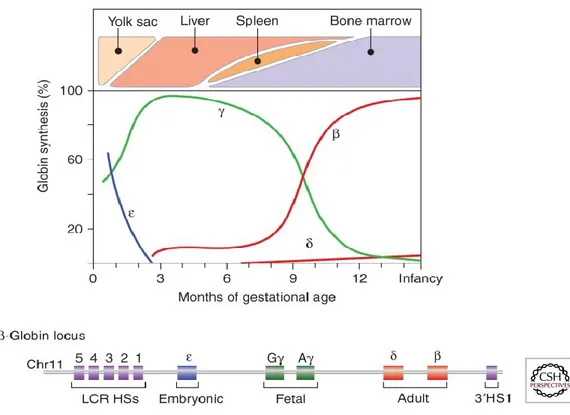
FIGURE 5 Globin Gene Expression during Development ... 18
FIGURE 6. Biomelecular Model of Malaria ... 21
FIGURE 7. Pathophysiology of Sickle Cell Disease ... 24
FIGURE 8. Sickle Cell Disease Biomarkers ... 30
FIGURE 9. Control of Red Cell Hydration ... 35
Chapter 2 FIGURE 10. Dense Red Blood Cell Distribution Normalized ... 40
FIGURE 11. Principal Component Analysis of the GEN-MOD cohort against HapMap3 Populations ... 42
FIGURE 12. Power Estimation for Association Test of Density of Red Blood Cell... 45
Chapter 3 FIGURE 1. Distribution of genome-wide association results with red blood cell density (DRBC) in 374 sickle cell disease patients ... 67
FIGURE 2. Atp2b4 expression levels in the bone marrow of normal mice (C57) or a mouse model of sickle cell disease (SAD) ... 68
SUPPLEMENTARY FIGURE 1. Correlations (Pearson’s r) between hematological parameters corrected for age, and sex in up to 408 patients with sickle cell disease from the GEN-MOD cohort ... 69
Chapter 4 FIGURE 14. Whole-Exome Sequencing Dense Red Blood Cell Distribution ... 73
FIGURE 15. Visual Correlation of the z-score of Dense Red Blood Cells to Hematological Traits ... 86
x
List of abbreviations
1000G 1000 Genome
ASW African ancestry in Southwest USA ATP Adenosine triphosphate
Ca Calcium
CEU Utah residents with Northern and Western European ancestry from the CEPH collection
CHB Han Chinese in Beijing, China
CHD Chinese in Metropolitan Denver, Colorado CI Confidence interval
Cl Chloride
CO2 Carbon dioxide
DNA Deoxyribonucleic acid
DRBC Dense dehydrated red blood cell eQTL Expression quantitative trait loci GIH Gujarati Indians in Houston, Texas GWAS Genome wide association study
HbA Adult hemoglobin
HbF Fetal hemoglobin HbS Hemoglobin S HCT Hematocrit HGB Hemoglobin HU Hydroxyurea HS Hereditary Spherocytosis IBD Identity by descent IRS Irreversibly sickled JPT Japanese in Tokyo, Japan
K Potassium
kb Kilo base
kDa Kilo dalton
LD Linkage disequilibrium LWK Luhya in Webuye, Kenya MAF Minor allele frequency MCH Mean cell hemoglobin
MCHC Mean cell hemoglobin concentration MCV Mean corpuscular volume
MDS Multi dimensional scaling
Mg Magnesium
MKK Maasai in Kinyawa, Kenya MPV Mean platelet volume
MXL Mexican ancestry in Los Angeles, California
Na Sodium
NIH National institute of health
OR Odds ratio
xi
PP Prolonged priapism
SP Stuttering priapism
QC Quality control
r2 Imputation measure of quality of imputation
R2 Variance explained
RA Rare nonsense minor allele
RBC Red blood cell
Retic Reticulocyte SCA Sickle cell anemia SCD Sickle cell disease
SE Standard error
SKAT Sequence kernel association test SNP Single nucleotide polymorphism TSI Toscani in Italia
VT Variable threshold WBC White blood cell count WES Whole-exome sequencing YRI Yoruba in Ibadan, Nigeria
xii
Acknowledgments
I would like to express my sincere gratitude to my supervisor, Guillaume Lettre, for his continuous support, encouragements, and enthusiasm throughout these intense two years. Thank you for giving me the opportunity to grow as a bio-informatician, a scientist overall, and for providing me exciting yet challenging projects. I could not have found a better supervisor. I would also like to thank John Rioux for sharing with me stories of his career path, which inspired me to work hard.
I want to thank our collaborators Frederic Galacteros, Carlos Brugnara, Pablo Bartolucci, for their depth and breath of knowledge, and their incisive contributions to our projects.
I am grateful to all members of the Lettre lab, for all the fun lab outings, lab meetings, lab lunches, you all participated in creating a collegial and stimulating work environment. I am fortunate to be a part of an amazing group who made this journey as enjoyable as possible. For their contribution, and insights into my work I would like thank Ken Sin Lo (my coding sensei master), Cecile Low-Kam (my statistics guru), Samuel Lessard, Nathalie Chami, and Melissa Beaudoin (all three geneticist mentors).
Last but not least, I would like to thank my fiancé, Marième Dembélé, my family members, Christiane, Jean-Pierre, Andy, and Giulia for your unwavering love and support throughout my studies. Finally, also like to thank my friends, for their patience and for bearing with me when I canceled several get-togethers, showed up late, or missed events because of my homeworks or labwork, you guys are the best.
13
1. Introduction
1.1 Sickle Cell Disease Historical Background
Sickle cell disease (SCD) was first described more than a 100 years ago in Occidental literature, by a cardiologist named James B. Herrick while tending to a dental student who complained about chest pain. In 1910, he published what is considered today the first report in a medical journal describing red blood cells with an odd shape, as seen in Figure 1, which he called “sickle-shaped cells”1,2. In 1927, E. Vernon Hahn and Elizabeth Biermann Gillespie3
were the first to discover the relationship between red blood cells and low oxygen. Three years later, Scriver and Waugh determined that in the absence of oxygen, red blood cells become sickled4. About twenty years later, in 1948, Janet Watson was the first scientist to elucidate the
protective role of fetal hemoglobin (HbF)5 on the disease noticing that newborns with the
disorder did not display any of the known complications. That same year, award winning Nobel scientist, Linus Pauling6 called “Sickle Cell Anemia, a Molecular Disease” in Science , where
he explained that the sickling phenomena originated from abnormal hemoglobin (HbS) which differed from normal hemoglobin. The following year James V. Neel7 uncovered the recessive
model of inheritance. The last two historical landmarks of SCD occurred in the 1950s. In 1956, Anthony Allison discovered the link between the protective effect of the sickle cell trait and malaria8. The second one happened two years later when Vernon Ingram confirmed that the
abnormal hemoglobin (HbS) differed from normal adult hemoglobin (HbA) by a single amino acid which replaced a glutamic acid by a valine amino acid at position 6 of the -globin subunit of hemoglobin9. Although previous reports described the process between red blood cell
deoxygenation and sickling, Ferrone et colleagues10 cemented our appreciation of the process
by explaining that the abnormal hemoglobin polymerizes under deoxygenation thus disrupting the shape of erythrocytes. This body of discoveries contributed to our understanding of the molecular basis of sickle cell disease and constitutes the foundation of future investigations of SCD in the 21st century.
14 1.2 SCD Burden in Today’s Society
The two main inherited hemoglobinopathies are: sickle cell disease (SCD), and the thalassemia syndromes. On one hand, SCD made distinctive by red blood cell assuming a crescent shape as opposed to the normal biconcave disc-like shape (Figure 2). This change in anatomy will cause cells to clog up in blood vessels, small capillaries, and to have a shorter lifespan. As a result, problems such as kidney damage, stroke, acute pain, skin ulcers, infections, to name a few, will ensue. Thalassemia, on the other hand, is characterized by an imbalance in the synthesis of the globin chains. Several types of thalassemia exist; the most common ones are α and β thalassemia, which cause ailments such as enlargement of the spleen (splenomegaly), susceptibility to infections, and more.
In 2006, the World Health Organization (WHO) recognized SCD as a global health problem11.
The increase in SCD awareness prompted public health organizations and health professionals to implement strategies to reduce infant mortality, which translated into a systematic prenatal screening, prescription of antibiotics, and vaccinations for children. However, these pediatric
Figure 1. Blood Smear of Sickle Cell The image was copied from J.B. Herrick (1910).
15
preemptive measures are more accessible to high-income countries compared to low-income countries where 1 in 2 neonates will not reach the age of 512. Although the infant mortality has
decreased in some parts of the world, projections indicate that the global burden of the disorder is set to increase, from over 300,000 newborns in 2010 to more than 400,000 by 2050 (Figure
3)13. Most of this increase in birth will be attributed to the African continent, which accounts
for 70% of the world’s cases of SCD. This growth in population from Africa is evidence for the argument that malaria endemic countries have the highest disease prevalence14.
While the highest incidence of the trait is attributable to Africa, WHO’s survey from 2011 found that worldwide 35 million individuals carried a mutant allele of the disease (i.e. individuals that are heterozygous for the sickle cell disease mutation). Indeed, we can find individuals of Hispanic (South America, Central America, and parts of the Caribbean), Mediterranean (such as Greece, Turkey, and Italy), Indian and Arab descent with the sickle cell trait. Studies attributes the occurrence of the gene in those populations to migration, which introduced the allele in non-malaria endemic regions, and to selective pressure of malaria, which increased the survival of individuals who lived to pass on their genes15-18.
Figure 2. Scanning Electron Micrograph of Normal Erythrocyte Retrieved as is from Wikipedia.
16
Figure 3. World's Distribution of Infants with SCA As seen in Piel et al. (2013).
17
1.3 Red Blood Cell and Hemoglobin
In mammals, red blood cells are biconcave and disc-shaped. Hemoglobin protein molecule depicted in Figure 4 is a 64 kDa complex with four polypeptide chains; two β polypeptide chains, and two α polypeptide chains, held together by non-covalent bonds19. The hemoglobin
tetramer, also known as HbA, or adult hemoglobin, is the most predominant in humans. Each globin chain contains a heme group in which the iron atom binds to oxygen as red blood cells pass through the lungs and releases it once in peripheral tissues. Carbon dioxide (CO2) is then
loaded for a return trip to the lungs where it is exchanged for oxygen. Two different gene clusters encode the α-globin and the β-globin families. The α-globin locus on chromosome 16 contains from 5’ to 3’ the embryonic ζ-globin gene and two adult α-globin genes. The β-globin locus resides on chromosome 11 and contains from 5’ to 3’ the embryonic gene (also known as ε-gene), two fetal γ-globin genes, and the adult genes, δ and β genes. Each of these genes combines to become different hemoglobin tetramer form during various stages of development (embryonic, fetal, and adult life). Figure 5 illustrates the relative levels of expression of the different globins over time during pregnancy on the y-axis and the organs responsible for blood cell production (erythropoiesis) on the x-axis. The ε-globin and ζ-globin genes responsible for embryonic hemoglobin are produced during the early maturation stage of red blood cells (erythroblast) in the yolk sack20. As the fetal liver becomes the site of erythropoiesis, red blood
cells become more and more mature, with α and γ genes taking over the previous embryonic globin genes. At the time of birth in humans, the bone marrow replaces the fetal liver as the site of erythropoiesis21.
18
Figure 4. Hemoglobin Molecule Copied from the book Inquiry into Life.
Figure 5. Globin Gene Expression during Development Duplicated from Sankaran VG et. al (2013).
19
1.4 SCD and Malaria 1.4.1 Historical Perspective
Malaria is a potentially fatal disease caused by a protozoan parasite infection of red blood cells. Depictions of the disease symptoms date back more than four millenniums ago, in Chinese medical scrolls, Greek documents, Roman writings, and Spanish missionaries memoires22.
Since then remedies existed to overcome the illness. In China for example, the Qinghao plant (Artemisia annua) dispensed to infected individuals is today known to contain artemisinin, an effective antimalarial drug particularly in combination with other drugs. In fact, 2015 Nobel Prize in Medicine was awarded to Youyou Tu for her work on an artemisinin-based drug, which completely cures sick individuals within 72 hours. Additionally, quinine, another potent antimalarial drug used today, was administered back in the 17th century in the form of a bark
tree known as the Peruvian bark as a cure23. The discovery of the parasite, at the time named
Plasmodium Oscillaria and later renamed Plasmodium Falciparum, came from Nobel-prize
winning French surgeon, Charles Louis Alphonse Laveran24. His discovery was
groundbreaking because it was the first time a eukaryotic pathogen was observed in human cells. Following his findings, in 1886, Italian scientist Camilo Golgi, found that two other species of the parasite caused variable symptoms of malaria22. His fellow countrymen,
Giovanni Batista Grassi, and Raimondo Filetti ten years afterwards set out to name each of them; Plasmodium vivax, Plasmodium malariae25. Simultaneously to Ronald Ross’ discovery
that the Plasmodium relictum is transmitted by mosquitoes in birds causing avian malaria, a joined effort between Italian scientists, lead by Giovanni Batista Grassi, observed that the Anopheles mosquitoes act as a vector for the P. falciparum, P. vivax, and P. malariae in humans. The scientific inquiries on the parasite life cycle, pathophysiology, therapies, complications related to the disease, and resistance of S trait carriers against the Plasmodium
stemmed from these breakthroughs. Finally, to date, at least 150 species of the Plasmodium genus have been discovered to cause malaria in other vertebrates26-30, two of which in humans:
20 1.4.2 Pathophysiology
The symptoms of the disease intensify from parasite to parasite. The P. Falciparum causes the most severe clinical manifestations because of its role in the lifecycle in the human body. Complications resulting from the infection, include fever, nausea, vomiting, headache, and in severe cases seizures, pulmonary embolism, jaundice and renal failure, convulsions, uremia, and acidosis.31 The pathogenesis of the Plasmodium in humans has been extensively
documented by Ricardo T. Gazzinelli et al32 and more recently by Samuel Crocodile Wassmer
et al33.
1.4.3 Burden and Protection
Despite recent claims of malaria mortality reduction (from 21% to 57%)34,35,36 over the past
decade, the disease continues to claim hundreds of thousands of lives each year and remains the leading cause of death in developing countries. With estimates ranging between 207 and 214 million new cases every year, the infection is most frequent in Africa (88%), southeast Asia (7%) and the Mediterranean region (2%) 35,36. The high prevalence of malaria in Africa can be
attributed to the selective pressure, which caused germline mutations to confer a survival advantage against the disease. In fact, since Anthony Allison’s discovery of the protective capability of the sickle cell trait against malaria, studies have attempted to uncover the exact biomolecular mechanism through which the -globin mutation hinders the parasite life cycle in the human body. Several genetic determinants are thought to shield from the parasite; genotypes A/E, A/C, C/C and C, E mutations prevent the parasite multiplications
through its interaction with low oxygen or reduce adherence to erythrocytes37,38. Additionally,
two erythrocyte enzymes deficiency; G6PD (glucose-6-phosphate dehydrogenase deficiency), and PKLR (pyruvate kinase) are thought to lessen the density of the Plasmodium, the first one through oxidative stress while the second one through inhibition of its replication in vitro.39
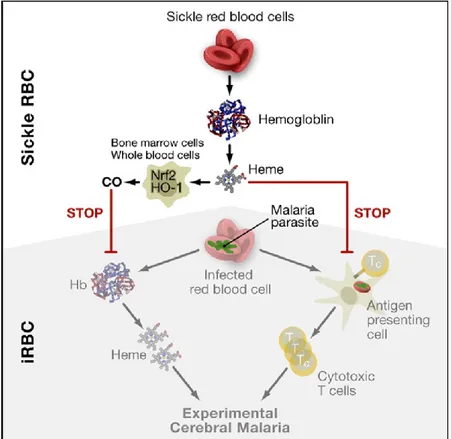
Moreover, National Institute of Health (NIH) group lead by Miller LH found that platelet glycoprotein 4, also known as CD36, sequester the plasmodium parasite inside erythrocytes and compromises its immune system40. Several other hypothesis and mechanism involving
heme-oxygenase 1 (HMOX1), or the interactions between higher levels of carbon monoxide and hemoglobin S41 (Figure 6), and other molecules were put forward, without necessarily being
21 confirmed in humans on a large scale42-44 .
Figure 6. Biomolecular Model of Malaria Protection Copied from Ferreira et al. (2011)
22 1.5 Pathophysiology of Sickled Cells
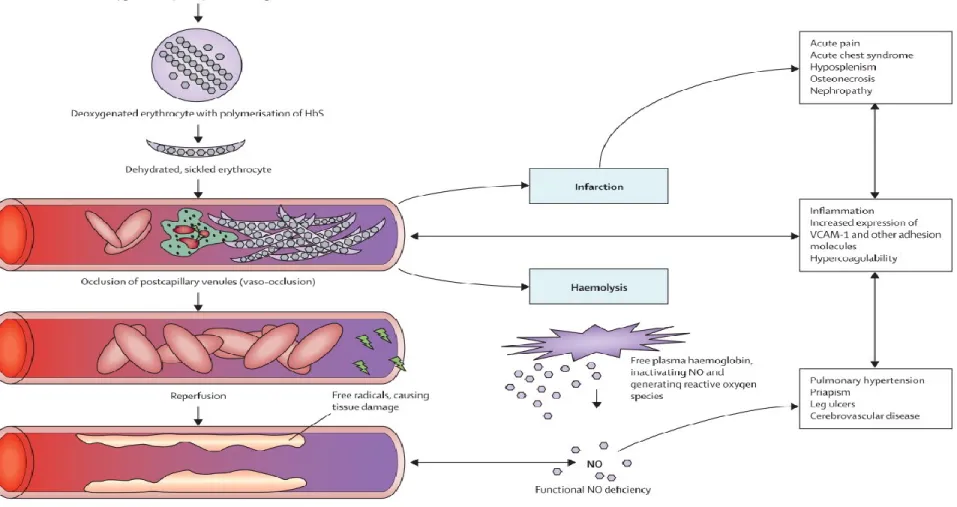
Hemoglobin S (HbS) polymerization is the chief and initial phenomenon in SCD pathophysiology. Upon the removal of the oxygen atom and dehydration of erythrocytes, the hemoglobin molecule becomes sticky and starts to form rod-like structures. Erythrocytes then become rigid, dehydrated and eventually assume a sickle shape. While the polymerization process is initially reversible, after multiple cycles of sickling, the blood cells become irreversibly sickled (IRS). These cycles, in turn, have some significant effects on red cell membrane structure, function, and adherence to the vascular endothelium, which will lead to the trapping of red blood cells and leucocytes in small capillary beds. According to Rees et al.45, and as seen in Figure 7, there are two major pathways involved in the manifestations of
the complications related to SCD. The first one is a direct consequence of cells being trapped in blood vessels and of the endothelium becoming sticky. This obstruction of blood vessels, and increase adhesiveness of the endothelium causes complications such as acute pain, nephropathy, inflammation, and pulmonary hypertension to name a few. The second pathway is the result of red blood cells bursting and therefore releasing hemoglobin, which will bind nitric oxide (NO)46. Hemolysis is the source of complications such as leg ulcer, priapism, stroke and
chest pain45. The sickling rate in erythrocytes is directly correlated with the intracellular
concentration of HbS, which can be reduced by the presence of fetal hemoglobin (HbF) as seen in individuals with the hereditary persistency of fetal hemoglobin (HPFH) genotype. Indeed, different alleles other than the -globin mutation can influence HbS concentration and either raise or lower the polymerization rate. We find three main SCD genotypes. The first one is sickle cell anemia (SCA) groups together all individuals with homozygous -globin mutation (S/S) which depending on reports and populations’ ethnicity can vary from 36.4% to 95.7%47.
The second genotype consists of heterozygous (S/C) with allelic frequency ranging from
3.6% to 92.2% depending on ethnicity and reports. The final genotype consists of S and
-thalassemia (S/0) which is widespread mostly in Arabs (~28%), and in Indians (~30% and
~63%), but has a low frequency in Africans (~0.7%)47. Other genotypes of the disease can
23
Severe sickle-cell disease Characteristics
HbS/S (β6Glu>Val/ β6Glu>Val); sickle-cell anaemia
The most common form of sickle-cell disease HbS/β0 thalassaemia Most prevalent in the eastern Mediterranean region and
India48
HbS/OArab (β6Glu>Val/ β121Glu>Lys)
Reported in north Africa, the Middle East, and the Balkans; relatively rare48
HbS/D Punjab (β6Glu>Val/ β121Glu>Gln)
Predominant in northern India but occurs worldwide48
HbS/C Harlem
(β6Glu>Val/ β6Glu>Val/ β, β73Asp>Asn)
Electrophoretically resembles HbSC, but clinically severe; double mutation in β-globin gene; very rare49
HbC/S Antilles
(β6Glu>Lys/ β6Glu>Val, β23ValIle)
Double mutation in β-globin gene results in severe sickle-cell disease when co-inherited with HbC; very rare50
HbS/Quebec-CHORI (β6Glu>Val/ β87Thr>Ile)
Two cases described; resembles sickle-cell trait with standard analytical techniques51
Moderate sickle-cell disease
HbS/C (β6Glu>Val/ β6Glu>Lys)
25-30% cases of sickle-cell disease in populations of African origin52
Moderate HbS/ β+ thalassaemia Most cases in the eastern Mediterranean region; 6-15%
HbA present48
HbA/S Oman
(βA/ β6Glu>Val, β121Glu>Lys)
Dominant form of sickle-cell disease caused by double mutation in β-globin gene; very rare50
Mild sickle-cell disease
Mild HbS/ β++ thalassaemia Mostly in populations of African origin; 16-30% HbA
present48
HbS/E
(β6Glu>Val/ β26Glu>Lys)
HbE predominates in southeast Asia and so HbSE uncommon, although frequency is increasing with
population migration53
HbA/Jamaica Plain (βA/ β6Glu>Val, β68Leu/Phe)
Dominant form of sickle-cell disease; double mutation results in Hb with low oxygen affinity; one case
described54 Very mild sickle-cell disease
HbS/HPFH Group of disorders caused by large deletions of the β-globin gene complex; typically 30% fetal haemoβ-globin48
HbS/other Hb variants HbS is co-inherited with many other Hb variants, and symptoms develop only in extreme hypoxia Table 1. Different Types of Sickle Cell Disease
Copied as is from Rees DC, et al (2010). Genotypes that have been reported to cause sickle-cell disease are listed. All include at least one copy of the βS allele, in combination with one or more mutations in the β-globin gene. HbS=sickle haemoglobin.
24
Figure 7. Pathophysiology of Sickle Cell Disease Copied from Rees DC, et al (2010)
25
1.6 Complications of Sickle Cell Disease
As mentioned before, SCD is a systemic disorder affecting multiple organs. These include the cardiovascular system (chronic myocardial insufficiency), the digestive system (chronic liver disease, gallbladder dysfunction), the urinary system (nephropathy), the nervous system (cerebral infarction), the male reproductive system (priapism), the ocular system (retinopathy), the skin system (leg ulcers), the blood system (splenectomy), and the respiratory system (acute chest syndrome). The National Heart Lung and Blood Institute website at the National Institute of Health identifies 18 major inter-related complications to SCD55. Although children show no
sign of the disease until they are 5 to 6 months old due to HbF’s protective effect, some of the first most common complications newborns are likely to experience include: dactylitis (aching and swelling of hands and feet), anemia (manifested by fatigue), and jaundice (yellow coloring of skin and eyes due to hemolysis of cells)56. Below are the four overarching complications,
each with the specific organs they affect and their manifestations:
Acute Pain
o One of the major complications and a sure sign of SCD is the acute pain episode
18,57. Pain crises are sudden, unpredictable, and are attributable to erythrocytes being
entangled in blood vessels, thus, reducing the supply of oxygen to tissue organs. The pain episodes, can therefore be felt at any location on the body, and have been described as intense, agonizing, excruciating aches that can require hospitalization. o Acute chest syndrome is another well-characterized complications of SCD58,59. It
ensues from vaso-occlusion of erythrocytes in the lungs, which prevents the provision of oxygen to capillaries, which will, in turn become damaged. Acute chest syndrome’s symptoms resemble those of pneumonia and often lead to hospitalization of the individual. This complication is so severe that it is the leading cause of deaths in adults.
o An hour long lasting painful erection without sexual arousal (priapism) is a frequent complication in males with SCD. Priapism persisting more than three hours is called prolonged priapism (PP), whereas when there are intermittent relapsing attacks of lasting two to six hours it is known as stuttering priapism (SP). Severity or recurrence of either SP or PP can end in penile fibrosis and
26
impotence.
Chronic Pain
o Bone and joint-related complications in SCD patients are debilitating. Usually widespread amongst teenagers, both osteoporosis, and bone marrow expansion are common60. Osteonecrosis results from bone infarction, and is one of the leading
causes of chronic pain in adults with devastating effect on the quality of life. Bone marrow infarction is a result of an acceleration of the production of blood cells (hematopoiesis), which can lead to reticulocytopenia (also known as aplastic crises, the decrease production of reticulocytes), a release of immature leukocytes and erythrocyte in the blood (known as leukoerythroblastic anemia).
o The advent of adolescence and the presence of severe anemia may enable the rate of leg ulcers61,62. These ulcers are more often reported in patients with S/S genotype
than with S/C (22% and 9% respectively)63. Plus, lifetime occurrence of ulcers can
vary from patient to patient. 50% of individuals will experience leg ulcer once in their lifetime, another 25% will experience them once to twice a year over several years, and finally the remaining 25% will experience leg ulcers chronically with multiple relapses64. Due to inflammation, scarring, and infection that accompany the
complications, leg ulcers can be very painful. While high levels of HbF improve the condition, low hematocrits count (HCT), with increase hemolysis and manhood are additional risk factors for developing leg ulcers65. Moreover, a Jamaican cohort
study of 225 patients showed that the occurrence of leg ulcers is increased at 18 years of age66.
Vascular Disorders
o Brain related complications also manifest themselves in SCD patients. These can be broken down into two types of complications: clinical strokes and silent strokes. Clinical strokes, which are due to a loss of the blood circulation to an area of the brain and cause tissue damage, are called ‘clinical’ strokes because their onset is noticeable and identifiable when they occur. Symptoms include seizures,
single-27
sided weakness or numbness/tingling, loss of balance, vision, and slurring of speech. One severe form of clinical stroke is known as intracerebral hemorrhage, which is the result of the breakage of an aneurysm that can lead to sudden death. The second form of brain related complications is the silent strokes, also known as silent brain infarct. These are a temporary loss of blood flow with unnoticeable symptoms of stroke causing brain lesions. In term of incidence, 35% of individuals will be affected by one of the types of brain vasculopathy, with 10 to 15% of them being under the age of 1067. Transcranial Doppler (TCD) screening is an effective
method for cerebral vasculopathy68.
o Eye problems or retinopathies are common for SCD patients. Goldberg et al. 69 have
divided a classification system to assess the progression of retinal complications in SCD. Stage 1 consists of a simple peripheral inadequate blood supply with arterial occlusion. Stage 2 features the degradation of ocular capillaries, with a benign change in vasculature near the retina. Stage 3 consists of the formation of functional microvascular networks with red blood cell perfusion known as neovascularization. Finally, stage 4, marks the leakage of blood into the areas in and around the vitreous humor of the eye, which can lead to a detachment of the retina.
Organ insufficiencies and other complications
o Renal complications or nephropathy are well characterized in SCD. Often times, renal manifestations are due to kidney’s tubular malfunction, thus causing improper acid excretion, inappropriate uric acid elimination, and inefficient potassium regulation. It is estimated that 18% of SCD patients will experience renal failure over their lifetime. The presence of blood in the urine (hematuria) occurs more often in individuals with the S/C genotypes as opposed to S/S. Hematuria results from
the death of renal papillary tissue, but can also be due to the formation of stony mass (calculi) in the body, tumor, or infection70,71. Additionally, the presence of
protein in urine (proteinuria), the presence of albumin in urine (albuminuria), excess of uric acid in the blood and attacks of gout are the consequence of glomerular dysfunction, an acquired dysfunction in SCD.
28
o The other major category causing complications is severe anemia. Different degrees of anemia affect individuals with SCD. However, severe anemia, which manifests itself mainly in infants less than ten years of age, is life-threatening and can be caused by acute splenic sequestration crisis. The crisis presents itself as an enlargement of the spleen that is due to considerable drop in hemoglobin levels brought about by acute blood entrapment within the splenic tissue72. Moreover,
aplastic crisis can also lead to severe anemia. The main cause of this predicament is parvovirus B19 infection, which in SCD patients causes a disruption of red blood cell production leading to severe anemia73.
o Irrespective of the patients’ age, infections are a recurrent theme for SCD patients. With the activity of the spleen being compromised early in their lifetime, patients are more at risk of contracting deadly bacterial infections74,75. These can cause
blood infection (septicemia), lung infection (pneumonia), infection of the membrane covering the brain and spinal cord (meningitis), and bone infection (osteomyelitis).
1.7 Known biomarkers of severity in SCD
According to the NIH Biomarkers Definitions Working Group definition from 199876,
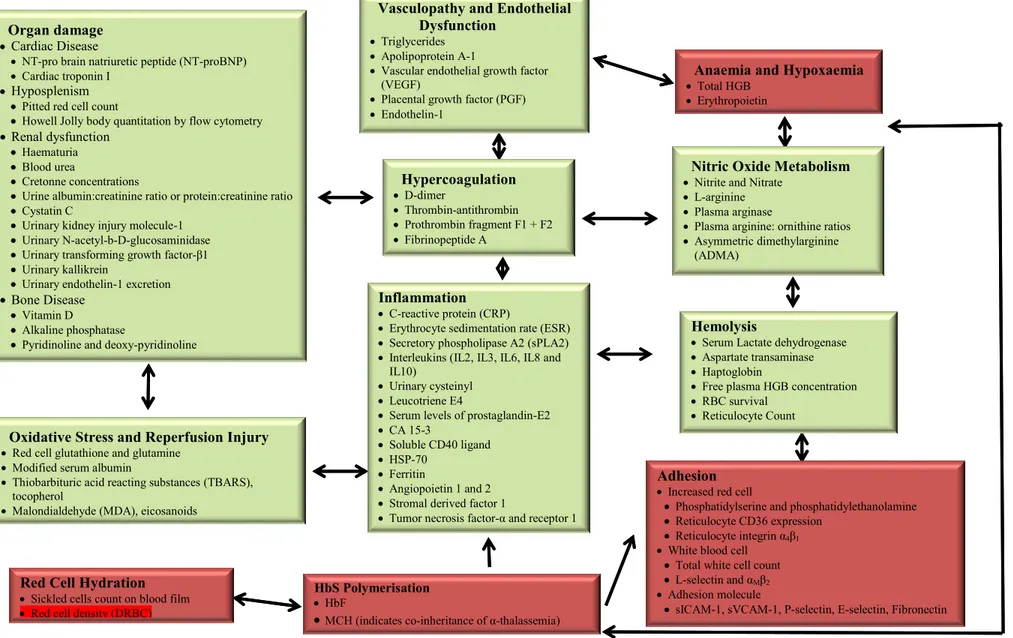
biomarkers (a contraction of the word biological and markers), is defined as an unbiased observation or measure which can be used as an indicator of a diseased or natural biological process or drug response. Their critical role in biomedical research stems from their impact on enhancing drugs effectiveness, and their relevance in helping understand basic science research. Based on the currently available reviews of biomarkers in SCD 77,78, these indicators are
categorized based on the pathophysiology of SCD, some are more functional than others (i.e., biomarkers of red cell rigidity vs. total hemoglobin), and some are interrelated (i.e., red cell survival and reticulocyte count). Figure 8, illustrates the physiological pathways of SCD starting from hemoglobin polymerization. The red boxes show the originator processes with red blood cell density (DRBC) highlighted in red inside the red cell hydration biomarkers box. The bright green boxes are the outcomes of interrelated processes. This summary points to the fact that using DRBC as a biomarker for SCD positions us early enough in the course of sickling that we may be able to reverse it. We believe that as more and more reseachers explore this biomarker and initiate clinical
29
30 Vasculopathy and Endothelial
Dysfunction
Triglycerides Apolipoprotein A-1
Vascular endothelial growth factor (VEGF)
Placental growth factor (PGF) Endothelin-1
Oxidative Stress and Reperfusion Injury
Red cell glutathione and glutamine Modified serum albumin
Thiobarbituric acid reacting substances (TBARS), tocopherol
Malondialdehyde (MDA), eicosanoids
Inflammation
C-reactive protein (CRP)
Erythrocyte sedimentation rate (ESR) Secretory phospholipase A2 (sPLA2) Interleukins (IL2, IL3, IL6, IL8 and
IL10)
Urinary cysteinyl Leucotriene E4
Serum levels of prostaglandin-E2 CA 15-3
Soluble CD40 ligand HSP-70
Ferritin
Angiopoietin 1 and 2 Stromal derived factor 1
Tumor necrosis factor-α and receptor 1
Hemolysis
Serum Lactate dehydrogenase Aspartate transaminase Haptoglobin
Free plasma HGB concentration RBC survival
Reticulocyte Count
HbS Polymerisation
HbF
MCH (indicates co-inheritance of α-thalassemia)
Red Cell Hydration
Sickled cells count on blood film Red cell density (DRBC)
Adhesion
Increased red cell
Phosphatidylserine and phosphatidylethanolamine Reticulocyte CD36 expression
Reticulocyte integrin α4β1
White blood cell Total white cell count L-selectin and αMβ2
Adhesion molecule
sICAM-1, sVCAM-1, P-selectin, E-selectin, Fibronectin
Anaemia and Hypoxaemia
Total HGB Erythropoietin Hypercoagulation D-dimer Thrombin-antithrombin Prothrombin fragment F1 + F2 Fibrinopeptide A
Nitric Oxide Metabolism
Nitrite and Nitrate L-arginine Plasma arginase
Plasma arginine: ornithine ratios Asymmetric dimethylarginine
(ADMA)
Organ damage
Cardiac Disease
NT-pro brain natriuretic peptide (NT-proBNP) Cardiac troponin I
Hyposplenism
Pitted red cell count
Howell Jolly body quantitation by flow cytometry
Renal dysfunction
Haematuria Blood urea
Cretonne concentrations
Urine albumin:creatinine ratio or protein:creatinine ratio Cystatin C
Urinary kidney injury molecule-1 Urinary N-acetyl-b-D-glucosaminidase Urinary transforming growth factor-β1 Urinary kallikrein
Urinary endothelin-1 excretion
Bone Disease
Vitamin D
Alkaline phosphatase
Pyridinoline and deoxy-pyridinoline
Figure 8. Sickle Cell Disease Biomarkers Adapted from Rees, D. C. and J. S. Gibson (2012).
31
1.8 Therapies in SCD
Although gene therapy shows promising signs79,80, the treatment remains in its early stages of
development and is considered to be out of reach for most. Therefore, as of today, there is no official and readily available cure for individuals with SCD.
1.8.1 Hydroxyurea (HU)
HU is the treatment of choice in sickle cell disease, its goal is to stimulate the production of HbF in patients81-83. Remaining the only FDA approved drug for the therapy of the disease, it
has been shown to reduce acute chest syndrome episodes, the number of hospitalizations and of blood transfusions in all age groups84-88. Moreover, it has been proven successful in decreasing
mortality in a group of severely affected patients after a 5 to 10 years’ follow-up88.
Nevertheless, the drug is still considered as a half way measure since there are no clear benefits on the risk of stroke89, priapism, renal complications, as well as pulmonary and cardiac
insufficiencies. In addition, several severe side effects exist; myelotoxicity (which is the decrease in production of cells responsible for providing immunity, carrying oxygen, and/or those responsible for normal blood clotting (thrombocytes)), leg ulcers, and low sperm count (oligospermia)90-92.
1.8.2 Bone Marrow Transplant
Bone marrow transplantation is another accepted therapy in SCD, yielding 80-90% disease free survival93-96. It is similar to receiving a blood transfusion, however, the cost of the procedure,
the need to identify a sibling compatible donor (or human leucocyte antigen identical donor), the necessity of going through chemotherapy, and to take immune suppressor considerably limits the number of patients who can access the therapy.
1.9 Genome-Wide Association Studies (GWAS) of Sickle Cell Disease
GWAS are a powerful tool to explore the genetic architecture of human disease. In essence, genetic associations refer to the association test between a SNP and a trait. The traits can be categorical (e.i., having or not having type 2 diabetes) or quantitative (i.e., height, weight, high-density lipoprotein cholesterol, low-high-density lipoprotein cholesterol). For a given trait, the association will be significant if the disease frequency varies according to the genotype. In
32
other words, when testing a specific allele T, at an T/C biallelic SNP, we will find more cases than controls or a correlation with a quantitative trait for a significant association97. Thanks to
the advent of cost-effective massively parallel genotyping arrays able to genotype upwards 2.4 millions SNP, and the cataloguing of human polymorphism in project such as the 1000 Genome project98, the HapMap project99, and more recently the Haplotyple Reference
Consortium100, we have witness a considerable increase in the number of association studies.
As of 2014 the National Human Genome Research Institute Catalogue of published GWAS101
indexes close to 2,000 curated publications, 12,000 SNPs for more than 200 traits. This profusion in genome wide scans is in stark contrast to 2005, at the eve of the completion of the human genome project102,103 when just very few publications and loci were reported. GWAS
confers a true advantage compare to linkage studies and candidate gene analysis, as they give the ability to interrogate the whole genome in a systematic manner97.
One of the early successes of GWAS dates from 2005 with the identification of the
Complement Factor H gene as a major risk factor for age-related macular degeneration104-106 in
studies of 146 patients with 90 cases, and about 100,000 SNPs. Nowadays, with the implementation of imputation in GWAS analysis pipelines, and extensive collaborations meta-analyses never conceived before are now undertaken. For example, the recent meta-analysis of blood traits in the UKBiobank107 which consisted of a sample size of ~200,000 patients, with
29.5 million markers, and the one on body mass index which included over 300,000 individuals and tested over 2.5 millions SNPs108.
In SCD research, early association studies that focused on acute chest syndrome, priapism, osteonecrosis, and pain crises yielded spurious results109. However, SNPs in UGT1A1110 and
MYH9–APOL1111 were associated with gallstones, and renal failure respectively in SCD
patients and replicated in other cohorts. The presence of replication for these findings provided the first loci for SCD complications. The majority of other successful GWAS in SCD implicated discoveries with HbF. Namely the link between HbF and BCL11A112,113, and
subsequently between HbF and BCL11A, HBS1L-MYB, and HBB114-116 which together account
33
1.10 Density of Red Blood Cell in Sickle Cell Disease 1.10.1 Biology and Physiology of Red Cell Hydration
Before 1950 the role of moving solutes and water across red cell membrane was attributed to calcium-dependent potassium channels in general118. However, since the discovery of the
Gardos channel, a calcium-activated potassium channel, our understanding of the importance of this channel on ion homeostasis has significantly improved. In fact, today, our comprehension of the transport mechanism involved in erythrocyte osmoregulation extent to designing pharmaceutical drugs to target these channels. Studies have found that in red cells both the volume, and the hemoglobin concentration are dependent on the cation, anion content, as well as the water amount. Cation content regulation involves two active and two passive transporter membrane proteins. The sodium-potassium-ATPase pump and the calcium-ATPase pump are the two ATP-dependent transporters that move sodium and calcium outside of erythrocytes either in collaboration with passive transporters or on their own. Although loss-of-function mutation and missense mutation have been reported to cause hemiplegic migraine type 2 and a type of Parkinson disease119,120, scientific inquiries pinpointed the calcium-activated potassium
channel to play an important role in the dehydration of erythrocytes in SCD121-123. Passive
cation transporters rely on the external and internal concentration of potassium to become active, which why they are labeled co-transporters. The two co-transporters reviewed in human erythrocytes are the sodium-potassium-chloride co-transporter (Na+/K+/Cl-), and the
potassium-chloride (K+/Cl-) transporter. Reports indicates that the latter, the electroneutral
co-transporter, plays an essential part in erythrocyte dehydration in SCD either by itself or in conjuction with the Gardos Channel. Knockout models and molecular characterization of all of its isoforms (KCC1, KCC2, KCC3, KCC4) shed light on its impact. Of interest, knockout mouse KCC3 (-/-)124 results in dysfunctional cell volume regulation in neurons and kidney
tubular cells, which is accompanied by a loss of hearing acuity, and neurological disorders. Additionally, knockout KCC4 (-/-)125 lead to deafness and tubular acidosis, and KCC2 (-/-)126 is
lethal just after birth due to respiratory failures. Additional cation transporters include sodium-hydrogen (Na+/H+) exchanger, and sodium-magnesium (Na+/Mg+) exchanger. The Na+/H+
exchanger is crucial for the regulation of intracellular pH and cell volume127, and was found to
34
content in erythrocytes and may be to incriminate for the low levels of magnesium found in SCD individuals. When it comes to the regulation of anion content the only protein known to be involved is the anion exchanger band 3128,129. Several functional roles have been identified
for the protein, including; chloride-bicarbonate exchanger (Cl-/HCO3-), transporter of carbon
dioxide (CO2) from tissues to the lungs’ alveoli, and stabilizer of red cell cytoskeleton. In vitro
studies and DNA mutations analysis in this gene have been associated with severe health outcomes, such as spherocytosis, hemolytic anemia, splenectomy, and renal dysfunction130-132.
Finally, water content moves freely across red blood cell membrane without the need of any energy input but it can be rushed through the water channel known as the aquaporin 1 (AQP-1)133. The water content generally depends on osmotic pressures, and solutes (Na+, K+, Cl-)
35
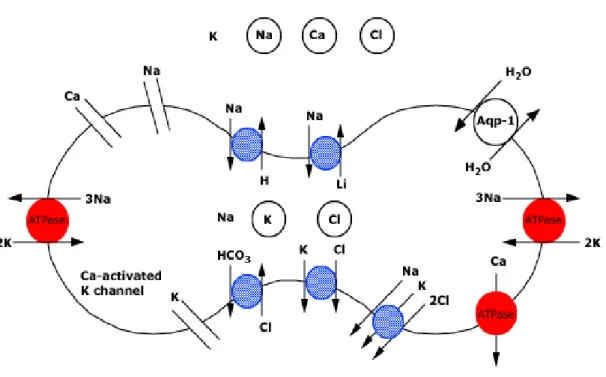
Figure 9. Control of Red Cell Hydration
Retrieved as is from UptoDate webpage on Control of red cell hydration. The figure is a schematic representation of the transport mechanisms regulating red cell hydration. The extracellular concentrations of sodium and calcium are higher than those within the cell, creating favorable gradients for entry, while the intracellular concentration of potassium is higher than that in the extracellular fluid, creating a favorable gradient for potassium exit by the K-Cl cotransporter or the calcium-activated (Gardos) potassium channel. The red transporters are active, the blue transporters are passive. Band 3 protein primarily functions as a Cl-HCO3 exchanger. Its primary physiological function is to facilitate CO2 transport from tissues to alveoli; it also plays an important role in defining red cell shape and membrane stability. Water movement passively follows that of cations and anions, or changes in tonicity of the red cell's environment. Transport of water can occur at a much faster rate via water channels (aquaporin-1, Aqp-1).
36 1.10.2 Sickle Cell Disease and Clinical Trials
To summarize red blood cells volume is dependent on osmotic pressures, which are dependent on water content, and solutes concentrations. In SCD, the literature shows that three primary pathways are involved in cell dehydration:
The potassium-cloride co-transporter or KCC pathway, a key regulator in the dehydration of sickle red cells, playing a role alone or cooperatively with the Gardos channel134-136. When sickled cells are in contact with the renal medullary environment,
they cause leakage of potassium, chloride, and water. KCC has four isoforms
SLC12A4/KCC1, SLC12A5/KCC2, SLC12A6/KCC3, and SLC12A7/KCC4, which are
all present in human erythrocytes.
The Gardos channel, or KCNN4, activates under deoxygenation and sickling when the red cell membrane is more permeable to calcium. This will push chloride out of the membrane leading to further sickling. Some in vitro studies have shown that the calcium-dependent channel causes red blood cell to become irreversibly sickled and contribute to the vaso-occulusive process137,138.
The deoxygenation-induced pathway leads to dehydration because it causes the cell membrane to become permeable to calcium thus activating the Gardos Chanel. 139-141.
The density of red blood cell is a biomarker that captures the modification of intracellular HGB concentration and red cell dehydration. This biomarker is crucial in understanding the modulation of hemoglobin S in SCD and designing therapeutic drugs142 to prevent dehydration
or increase hydration. Indeed, Ishii et al143 described the mechanism through which the
calcium-activated potassium channel regulates the dehydration of erythrocytes. Upon activation the Gardos channel, which causes an increased intracellular calcium levels, potassium and water are forced out of the cell, therefore dehydrating it and raising HbS concentration. Bartolucci et al144 who reported dense red blood as a cell with decreased water content, and
increased MCH, provided empirical evidence of the role of DRBC in SCD complications. Their analysis on dense erythrocytes in ~500 SCD patients for the first time established the negative link between DRBC and complications such as renal dysfunction, priapism, and leg ulcer. Moreover, to strengthen the relationship between dense red blood cells and SCD, he showed
37
that after six months of hydroxyurea usage the population of dense cells decreases by 34%. Both the Bartolucci’s study and the role of the Gardos channel in red cell dehydration in the context of sickle cell provide evidence that the density of erythrocytes leads to complications, and that a specific protein could be involved in the process of SCD pathology. In fact, using antifungal drug, clotrimazole, in transgenic mice the Gardos channel was successfully inhibited leading to a reversal of dehydration and potassium loss145,146. Plus, a clinical investigation with
the same therapeutic agent administered to 5 sickle cell anemia individuals was found to effectively inhibit cell dehydration and potassium loss147. Another trial consisted in giving oral
supplement of magnesium pidolate148 to 17 SCD patients. Although this pilot study resulted in
an increase in cell volume, a decrease in hemoglobin concentration, and reduction in the rate of pain crises149, it seems to raise the concentration of circulating hemoglobin. More recently a
phase III clinical trial of 144 people with Senicapoc (ICA-17043)150 a Gardos channel blocker
was found to improve erythrocyte survival (e.i., hematocrit levels, and reticulocyte count), to reduce the number of dense red blood cells, and hemolysis. The trial didn’t move to phase IV because it didn’t have any impact on pain crises.
38 1.11 Research Objectives and Thesis Outline
Given the clinical heterogeneity of SCD, and that erythrocyte dehydration is a typical feature of the disorder, in this thesis, we attempted to identify the genetic factors contributing to the disease severity through red cell density. We hypothesize that DRBC, a precursor to red blood cell sickling, explains the clinical variability of SCD manifestations. We first performed a genome-wide association study to identify common variants with modest-to-weak effect size, prioritizing markers falling within erythroid enhancers, expression quantitative traits locus (eQTL) in candidate genes, and variants associated with MCHC. We then singled out variants based on their significance thresholds for further analysis. Finally, we sequenced the exomes of a subset of our cohort to identify rare variants in candidate genes with high penetrance using a variant scoring scheme and available bioinformatics annotations.
1.12 Thesis Outline
In Chapter 2, I provided a description of the GEN-MOD cohort detailing demographic information, sample size for hematological traits, and complications. Additionally, I reviewed the genotype imputation method, the normalization of DRBC, the quality control measures employed in the genotyping, and the whole-exome sequencing experiments. I also, provided an overview of the statistical methods used in genome-wide association testing. Finally, the chapter ends with a breakdown of the bioinformatics tools utilized to carry out the analyses presented in the thesis. Chapter 3 presents the methods, discussion as well as the association results of DRBC in sickle cell disease patients. Chapter 4, describes the methods, results and discussion of the whole-exome sequencing analysis. Finally, chapter 5 concludes the thesis summarizing and discussing all the key findings, and puts forward guidelines for future experiments.
39
2. Methods
2.1 Sample Size
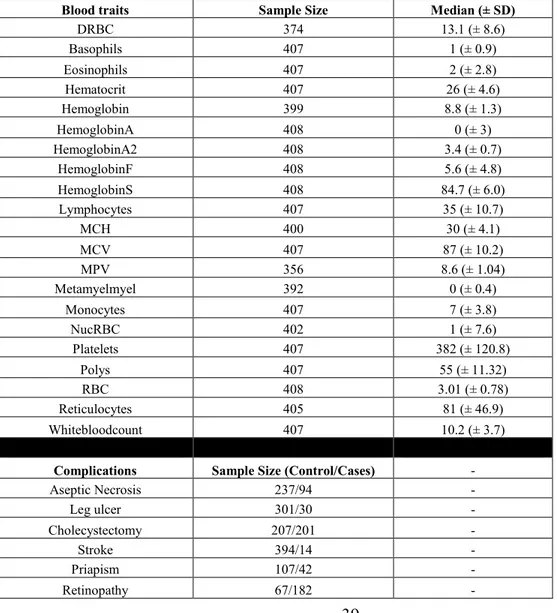
The Genetic modifier study (GEN-MOD) is a cohort of African individuals from the West Indies, Sub-Saharan Africa, and Central Africa recruited in France as described in Bartolucci et al144. The cohort included 185 men, and 223 women, with a median age of 30 (± 9) (Table 2
below describes the available blood traits, and complications). Our final dataset consisted of 403 patients selected for genotyping. One individual was removed during genotyping QC, and an additional twenty-eight that were dropped due to DRBC missing values.
Table 2. GEN-MOD Cohort Description
The table below describes the GEN-MOD cohort by sample size for hematological traits, and SCD-related complications. Additionally, it presents the median with standard deviation whenever possible.
Blood traits Sample Size Median (± SD)
DRBC 374 13.1 (± 8.6) Basophils 407 1 (± 0.9) Eosinophils 407 2 (± 2.8) Hematocrit 407 26 (± 4.6) Hemoglobin 399 8.8 (± 1.3) HemoglobinA 408 0 (± 3) HemoglobinA2 408 3.4 (± 0.7) HemoglobinF 408 5.6 (± 4.8) HemoglobinS 408 84.7 (± 6.0) Lymphocytes 407 35 (± 10.7) MCH 400 30 (± 4.1) MCV 407 87 (± 10.2) MPV 356 8.6 (± 1.04) Metamyelmyel 392 0 (± 0.4) Monocytes 407 7 (± 3.8) NucRBC 402 1 (± 7.6) Platelets 407 382 (± 120.8) Polys 407 55 (± 11.32) RBC 408 3.01 (± 0.78) Reticulocytes 405 81 (± 46.9) Whitebloodcount 407 10.2 (± 3.7)
Complications Sample Size (Control/Cases) -
Aseptic Necrosis 237/94 - Leg ulcer 301/30 - Cholecystectomy 207/201 - Stroke 394/14 - Priapism 107/42 - Retinopathy 67/182 -
40 2.2 Phenotype Quality Control
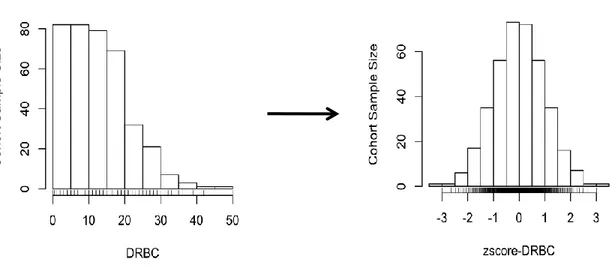
To establish a link between genotype and phenotype in association testing it is common practice to use linear mixed models. As one of the main assumptions of these models is that the phenotype under consideration follows a normal distribution. When this is not the case, it is standard practice for phenotypes to be normalized151. Normalizations account for outliers and
can involve one of the following: natural log, inverse normal, or square root. We can then evaluate confounding factors (age, gender, batch effect and more), fit them with a linear model to adjust for them. For DRBC we inverse normal transformed it after adjusting for age, and gender using custom R script. Figure 10 below shows the before and after normalization of DRBC.
Figure 10. Dense Red Blood Cell Distribution Normalized
The left most histogram shows that the raw data follows a power law distribution prior to any transformation whereas the right most histogram shows that post transformation the data follows a normal distribution.
41 2.3 Genotyping Quality Control
The genotyping quality control (QC) is essential for any association analysis, and it has been extensively reviewed by Ziegler et al.152 and by Teo et al.153. The three important steps to apply
to genotyping QC are SNP quality assurance, sample quality assurance, and population stratification assessment. Looking at the SNP quality assurance involves, filtering out autosomal variants with a genotyping call rate of less than 95%, variants with minor allele frequency (MAF) less than 1% or 5%. Additionally, weeding out correlated variants identified by LD threshold, and SNPs out of Hardy-Weinberg Equilibrium (HWE P-value < 1e-7) improves the quality of the dataset (variants out of HWE violate the assumption that allele frequency and genotype frequency are predictable). Sample quality assurance requires filtering out cryptically related individuals, erroneously labeled gender, individuals with a missing call rate less than 95% and individuals with over or under heterozygosis rate. Finally, investigating the population stratification involves identifying individuals that fall outside of their expected ethnicity when comparing them to another population samples dataset through principal components analysis (PCA). In this work, multidimensional scaling (MDS) available in PLINKv1.07154 was used when comparing the GEN-MOD cohort to the HapMap399 samples
(Figure 11) because we wanted to make sure we could identify population substructure based on genotypic distances.
42
Figure 11. PCA of GEN-MOD against HapMap3
(A) First principal component versus second principal component shows that the GEN-MOD cohort aligns as expected with
individuals from African ancestry. (B) Third principal component versus fourth principal component shows again that the GEN-MOD aligns with individuals of African ancestry. (C) First principal component versus second principal component only for individuals from African ancestry, shows the difference in ethnicity amongst Africans.
43 2.4 Whole-Exome Sequencing Quality Control
Whole-exome sequencing requires extensive pre-processing, and quality control measure to reduce false positives and improve the sensitivity of variant calling. Multiple tools and pipelines for whole-exome sequencing exist and have been reviewed by Bao et al155.
Additionally, different manufacturers provide their own recommendations for cleaning, and processing their data, yet they all involve the same steps:
Quality control which entails the removal of low-quality reads, PCR primers, adaptors, duplicates and other contaminants
Mapping reads onto a reference genome Targeted sequencing quality control Quality control of mapped reads Post-alignment processing Variant calling
2.5 Imputation
Genotype imputation is the statistical method to infer genotypes that were not directly typed156.
The existing implementations (BEAGLE, IMPUTE, and Minimac157-159) rely on hidden
Markov model to predict untyped markers using both correlation information of typed markers and the reference panel. Imputation allows researchers to analyze markers that were not previously available in their study, and therefore represent significant cost saving. In a comparative analysis that looks at the differences in computation between tools mentioned above, pre-phasing160 haplotypes was found to have a dramatic improvement on imputation
speed for all three methods. In decreasing order of imputation speed, the methods are
BEAGLE, Minimac, and IMPUTE161. Yet, looking only at factors specific to sensitivity such
as concordance (percentage that an observed SNP genotype is identical after imputation), imputation quality score (IQS162; concordance adjusted for probability of consensus), and
average r2156 (correlation between the imputed genotype and the observed), identified Minimac
and IMPUTE2 as best the performer163. Our dataset increased from ~2.5 million to 31 million