Universit´e de Montr´eal
Video-based Postural Sway Analysis in a Controlled Environment
par Monica Urseanu
D´epartement d’informatique et de recherche op´erationnelle Facult´e des arts et des sciences
M´emoire pr´esent´e `a la Facult´e des arts et des sciences en vue de l’obtention du grade de Maˆıtre `es sciences (M.Sc.)
en informatique
aoˆut, 2014
c
Ce m´emoire intitul´e:
Video-based Postural Sway Analysis in a Controlled Environment
pr´esent´e par: Monica Urseanu
a ´et´e ´evalu´e par un jury compos´e des personnes suivantes: Max Mignotte, pr´esident-rapporteur
Jean Meunier, directeur de recherche S´ebastien Roy, membre du jury
R´ESUM´E
`
A mesure que la population des personnes ˆag´ees dans les pays industrialis´es augmente au fil de ann´ees, les ressources n´ecessaires au maintien du niveau de vie de ces personnes augmentent aussi. Des statistiques montrent que les chutes sont l’une des principales causes d’hospitalisation chez les personnes ˆag´ees, et, de plus, il a ´et´e d´emontr´e que le risque de chute d’une personne ˆag´ee a une correlation avec sa capacit´e de maintien de l’´equilibre en ´etant debout. Il est donc d’int´erˆet de d´evelopper un syst`eme automatis´e pour analyser l’´equilibre chez une personne, comme moyen d’´evaluation objective.
Dans cette ´etude, nous avons propos´e l’impl´ementation d’un tel syst`eme. En se basant sur une installation simple contenant une seule cam´era sur un tr´epied, on a d´evelopp´e un algorithme utilisant une impl´ementation de la m´ethode de d´etection d’objet de Viola-Jones, ainsi qu’un appariement de gabarit, pour suivre autant le mouvement lat´eral que celui ant´erieur-post´erieur d’un sujet.
On a obtenu des bons r´esultats avec les deux types de suivi, cependant l’al-gorithme est sensible aux conditions d’´eclairage, ainsi qu’`a toute source de bruit pr´esent dans les images. Il y aurait de l’int´erˆet, comme d´eveloppement futur, d’in-t´egrer les deux types de suivi, pour ainsi obtenir un seul ensemble de donn´ees facile `
a interpr´eter.
Mots cl´es : traitement d’images, ´equilibre, d´etection de caract´ eris-tiques, suivi d’une cible
As the senior population in developed countries increases, so will the resources dedicated to maintaining a high standard of life for the elderly. Statistics show that falls are one of the main causes of senior citizens being hospitalized. Furthermore, it has been shown that the risk of an elderly person falling is correlated to their ability to maintain their balance during standing position. It is then of interest to develop an automated system to evaluate a subject’s balance, or postural sway, as a means of objective evaluation.
In this study we have proposed the implementation of such a system. Based on a simple setup of one camera on a tripod, we have developed an algorithm using the Viola-Jones implementation, as well as template matching, to track both lateral and anterior-posterior postural sway.
We have obtained good results for both types of tracking, however, the tracking algorithm is sensitive to lighting conditions and any kind of noise in the images. It would be of interest, as a future development, to integrate both types of tracking, so as to obtain only one easily-interpretable dataset as a result.
CONTENTS
R´ESUM´E . . . iii
ABSTRACT . . . iv
CONTENTS . . . v
LIST OF TABLES . . . viii
LIST OF FIGURES . . . ix
LIST OF ABBREVIATIONS . . . x
ACKNOWLEDGMENTS . . . xi
CHAPTER 1: INTRODUCTION . . . 1
1.1 An increasingly aging population . . . 1
1.2 What is postural sway and why study it? . . . 1
1.3 Different approaches to measuring sway in a clinical environment . 2 CHAPTER 2: LITTERATURE REVIEW . . . 3
2.1 Video surveillance . . . 3
2.2 Human activity analysis . . . 4
2.3 Gait analysis . . . 5
2.3.1 Analyzing gait for identification purposes . . . 5
2.3.2 Gait analysis in the medical field . . . 6
2.4 Fall analysis . . . 7
2.5 Postural sway . . . 8
2.5.1 Two-dimensional . . . 10
CHAPTER 3: A SIMPLE SYSTEM FOR POSTURAL SWAY
AS-SESSMENT . . . 13
3.1 Introduction . . . 13
3.2 Camera setup . . . 13
3.2.1 Calibration . . . 13
3.2.2 Flow diagram of the system . . . 16
3.3 Viola-Jones object-detection algorithm . . . 19
3.4 Template matching . . . 21
3.5 Post-processing . . . 22
3.5.1 Focusing on Face Sway . . . 23
3.5.2 Frontal and side views . . . 23
3.5.3 Validation . . . 23
CHAPTER 4: EXPERIMENTS AND RESULTS . . . 25
4.1 System implementation . . . 25
4.2 Experiments . . . 25
4.2.1 Camera setup . . . 25
4.2.2 Camera positioning and lighting . . . 26
4.2.3 Clothing . . . 27
4.3 Results . . . 27
4.3.1 No movement . . . 27
4.3.2 Single leg balance . . . 28
4.3.3 Ball throwing . . . 30
4.3.4 Comparison . . . 32
4.3.5 Side-view ear detection . . . 35
4.3.6 Trajectory comparisons . . . 37
4.3.7 Virtual combined trajectories . . . 38
CHAPTER 5: CONCLUSION AND FUTURE WORK . . . 39
5.1 Overview . . . 39
vii BIBLIOGRAPHY . . . 42
4.I Results of different experiments . . . 34 4.II Template tracking results . . . 37 4.III Stable vs. unstable sway . . . 37
LIST OF FIGURES
2.1 Postural sway - young vs. older subject . . . 9
3.1 Setup for two synchronized cameras . . . 14
3.2 Camera projection models . . . 15
3.3 System flow chart . . . 17
3.4 Viola-Jones features . . . 19
3.5 The value of a point in an integral image . . . 20
3.6 The sum of the pixels of rectangle in an integral image . . . . 20
3.7 AdaBoost classifiers . . . 21
4.1 Typical camera setup . . . 26
4.2 No sway trajectory . . . 28
4.3 Trajectory comparison with ground truth . . . 29
4.4 Distance between two trajectories . . . 29
4.5 Shorter distance from the subject . . . 30
4.6 Ruler used for determining scale . . . 31
4.7 Ball throwing experiment . . . 32
4.8 Images skipped in ball throwing experiment . . . 33
4.9 Ear template and position of the green marker for profile sway tracking . . . 36
4.10 Profile sway tracking: template matching vs. green marker tracking . . . 36
BBS Berg Balance Scale COM Centre of mass
COP Centre of pressure FP Force plate
ROI Region of interest SD Standard deviation
ACKNOWLEDGMENTS
I would like to thank, first and foremost, my thesis advisor, Jean Meunier, for his unwavering support and constant encouragement, as well as the guidance provided throughout this project. It has also been invaluable to have a thesis advisor, as well as the Computer Science department of Universit´e de Montr´eal, be very accommodating with schedules and meetings while I worked full time and lived in another city.
Furthermore, I am grateful to the Fondation Universitaire Pierre Arbour for the financial support provided in the early months of my degree, when I needed it most.
Finally, I would like to thank Sabine and Julien for participating in my experi-ments, and allowing me to use not-so-flattering pictures of them in my thesis.
CHAPTER 1
INTRODUCTION
1.1 An increasingly aging population Statistics
Canada, much like many other industrialized countries, is facing the prospect of managing an increasingly aging population, and the costs associated with it. According to Statistics Canada [14] the projected population of senior citizens will reach 24.6% in 2036, compared to 14.5% in 2011, the date of the latest census. This increase is a result of a generation baby-boomers reaching old age, as well as an overall increase in life expectancy. The growing population of elderly citizens will require increasingly more resources for maintaining its health and well-being.
The need for automating health and well-being tests
One of the major problems affecting the health of the elderly are falls, which can lead to severe impairment, or even death [30]. It has been observed [44] that one predictor of future falls in an older person is abnormal postural sway, i.e. increased sideways and forward-backward sway, while the person is standing. It is therefore of use to perform tests in order to anticipate as much as possible which individuals would be at risk.
1.2 What is postural sway and why study it?
A person’s balance is generally defined to be an even distribution of weight enabling them to remain upright and steady. Consequently, postural sway is defined as lack of balance, identified by the body’s movement while standing still. It has been suggested [44] that an older person’s increased loss of balance is a result of a decrease in spatial visual sensitivity, as well as the peripheral sensory system
becoming less effective with age.
According to the Public Health Agency of Canada [30], almost two thirds of injury-related hospitalizations for the elderly are as a result of a fall. In addition, it has been observed [26][18] that increased postural sway during quiet standing is correlated to an increased likelihood of falling.
1.3 Different approaches to measuring sway in a clinical environment Postural sway is traditionally measured in a clinical setting under the supervi-sion of trained personnel. The subjects are made to perform several tasks and are then evaluated according to a gold standard, which is generally taken to be the Berg Balance Scale (BBS) [11]. This consists of a series of balance-related tasks, each scored on a scale from zero to four, and then summed up. The BBS has been found to be a good predictor of falls in populations of older adults [13], especially those residing in long-term care facilities.
Another method is Tinetti’s test, also known as the Performance Oriented Mo-bility Assessment (POMA). The test is comprised of a static component, first on a chair, then standing, followed by a dynamic gait analysis. The test is scored over 28 points, with a result below 19 showing a high risk for future falls. The inter-rater reliability was measured by having a physician and a nurse test the patients at the same time and high agreement was found [36].
A simple and yet effective test is the Timed Up and Go test, which simply measures the time taken to rise from a chair, walk three metres, turn around, walk back to the chair, and sit down. When used as a test on elderly individuals who are already frail, it has been shown that a score higher than 14 seconds indicates that the person has a higher risk of falling.
Other ways of measuring standing balance include placing sensors or markers on the subject or centre of pressure (COP) measurements with force platforms, discussed further in the literature review.
CHAPTER 2
LITTERATURE REVIEW
2.1 Video surveillance
Video surveillance has been a ubiquitous part of our lives for several decades, publicly, as well as in the private sector. It is widely used for traffic monitoring, commercial security, as well as customs and border protection. More recently, it has been used as a tool to assist in monitoring the safety of elderly patients, both those in institutional care and those residing at home. The approach differs markedly from the public-camera monitoring, due to privacy issues as well as the need for more cost-effective means, supported by small privately-owned companies.
The number of cameras in public spaces has increased exponentially in the last decade [16], making it crucial to develop software capable of analyzing the produced data without human interaction. A comprehensive review of multi-camera video surveillance [42] has focused on the connection and integration of large distributed multi-camera networks and the aggregation of the data provided by these networks. The study shows that jointly modelling data improves the robustness and the accu-racy of the detection and tracking. As an example, activity modelling can improve inter-camera tracking, while multi-camera tracking provides information for camera calibration and the inference of the topology of camera views.
A study presented by Baumann et al. [8] reviews several measures used to evaluate different video surveillance algorithms and their results. Automated alert systems need to be precise and robust enough to alert a human agent only when needed, while at the same time not missing any of the events that do need to raise an alarm. In general, algorithm results are found to be largely dependent on the choice of a ground truth, as well as that of the benchmark datasets. One of the difficulties in assessing different algorithms and the evaluation metrics used is that some published articles provide little information on the details of their
implementation, such as methods for averaging out data, or combining different computational measures.
2.2 Human activity analysis
A recent and comprehensive review has been published by Aggarwal and Ryoo [3]. They classify activity recognition methodologies into two types of approaches: single-layered and hierarchical. Single-layered approaches classify activities directly from video data, or, more specifically, from sequences of images. Single-layered ap-proaches are further divided into space-time apap-proaches and sequential apap-proaches. Space-time approaches generally work with training videos, from which a model 3-D XYT space-time volume representing each activity is constructed. When a new video is then tested, a new 3-D space-time volume is constructed and com-pared with each activity model, and the activity which has the highest similarity is chosen. Sequential approaches view an input video as a sequence of observations and each activity is viewed as a particular sequence of feature vectors.
Hierarchical approaches are based on the recognition of sequences of simpler subactivities, which are combined to create high-level activities - e.g. punch-ing and kickpunch-ing combined to create fightpunch-ing. Hierarchical approaches are fur-ther divided into statistical methods, syntactic methods and description-based ap-proaches. Statistical approaches use multiple layers of state-based models, such as Hidden Markov Models (HMMs) and Dynamic Bayesian Networks (DBNs), while syntactic approaches model human activities as a string of symbols, each of which represents a subactivity. High-level activities are then recognized from the latter by using context-free grammars (CFGs) or stochastic context-free grammars (SCFGs). Description-based approaches, like the other hierarchical approaches, also view an action as being composed of simpler events (i.e. subevents, or subactivities). Ac-tivities are recognized by searching the subevents satisfying the relations specified in its representation. Time-intervals are usually associated with subevents in order to generate temporal relationships among subevents, and CFGs are used as formal
5 syntax for human activity representation.
2.3 Gait analysis
Gait is generally defined as an individual’s manner of walking, taking into ac-count speed, cadence, balance as well as any idiosyncratic features specific to the individual. It is dependent on physical features such as height, weight, limb length, as well as posture and characteristic motion. Gait analysis may be useful in iden-tifying a person, for security reasons, as well as ideniden-tifying certain medical issues in patients [21].
2.3.1 Analyzing gait for identification purposes
One of the methods of analyzing gait for identification purposes was proposed by Lee et al. [24]. They have used feature vectors based on moments extracted from orthogonal-view video silhouettes of walking motion, and used these for both person identification and gender classification. They have focused on two types of gait features, one based on average appearance of gait, and one based on spectral components. They have found the latter to be performing less accurate identifi-cation when the subject’s type of appearance and clothing was already present in the training database, but better suited for when the clothing changed drastically from the training set to the testing set.
Alternatively, Wang et al. [39] used three-dimensional voxel reconstruction, with two calibrated inexpensive webcams. Their approach was to first subtract the background, then extract silhouettes, and then finally to reconstruct 3-D voxels from back projecting the silhouettes from multiple camera views. The algorithm results were tested against output using the GAITRite Electronic mat, and the Vicon motion capture system, both of which have been shown to be accurate [43], and very good agreement was obtained for walking speed, step time and step length. These are only two simple examples among the many other methods proposed in the literature. For a comprehensive treatment and many additional references
to the existing literature on the subject, the reader may refer to Nixon et al. [27].
2.3.2 Gait analysis in the medical field
Gait analysis is performed in the medical field as a tool to detect possible pathologies, as well as to determine future treatment for known ones. It has been shown that cerebral palsy and stroke patients benefit from gait analysis while de-veloping strategies for rehabilitation. In the case of cerebral palsy patients [22], when comparing visual gait analysis performed by trained medical personnel and 3-D gait analysis, the latter performed markedly better. Out of ten specific points of the gait cycle only two were shown to have been similarly evaluated by visual analysis and 3-D computer analysis.
In studying elderly persons without dementia, Verghese et al. [37] concluded that the presence of neurological gait abnormalities is a significant predictor of the risk of development of dementia, and more particularly non-Alzheimer’s dementia. Bautmans et al. [9] have used 3-D accelerometers to study gait and its corre-lation to fall-risk. They have found that, when based on the average of two walks instead of only one, the assessment of gait speed and regularity of steps and strides shows good to excellent reliability. However, in this study, only gait speed showed sufficient consequence on the increase of fall-risk, while the the relationship of other gait features needs more research.
As an example of a more traditional method of measuring gait, Bamberg et al. [7] developed the “GaitShoe”, a wireless wearable system for gait analysis. The benefit of such a system is that it is portable and independent of the patient’s pres-ence in the motion analysis laboratory. It is, however, an intricate framework, as it consists of three orthogonal accelerometers, three orthogonal gyroscopes, four force sensors, two bidirectional bend sensors, two dynamic pressure sensors, as well as electric field height sensors. Their results were promising, being validated using re-sults obtained simultaneously from the Biomotion Laboratory of the Massachusetts General Hospital, however, the prototype’s price being close to $500 per shoe at the time of the article’s writing, it also makes it cost-prohibitive for use with large
7 samples of individuals.
This non-exhaustive list of research work demonstrates that gait analysis is a field of interest in clinical medical practice, both for neurological and non-neurological disorders.
2.4 Fall analysis
Falls are the leading cause of hospitalizations in the elderly population in Canada [32]. They are also the second most common cause of unintentional in-jury deaths (at 25%), surpassed only by transportation incidents. It is thus of great interest to develop accurate and affordable systems for automatically detect-ing such events. In addition to the elderly population residdetect-ing in long-term care facilities, this would also benefit older persons living independently in their own home. In the past, many such systems were dependent on either the person wearing a set of sensors, which was both cumbersome and costly, or the person being able to push a button or a switch to call for help, which was largely dependent on the person being conscious and able to reach the signalling device.
A vision-based, ceiling-mounted Personal Emergency Response System is pro-posed by Belshaw et al. [10] and tested in a home environment. The system is based on visual background modelling, which separates a subject’s shadowed sil-houette and shadow-less silsil-houette regions. The regions are then analyzed to create velocity, area, and moment features, which in turn are classified as fall or non-fall. Their results were promising, detecting all the simulated falls in the video input, and detecting only 5.4 false positives per day, obtaining a false positive rate of 0.00126%, and a true positive rate of 100%, where the rates are calculated by di-viding the number of events (true or false positives) by 3,024,000, the total number of frames occurring over the trial period.
Another similar system was presented by Lee and Mihailidis [25], also using a digital videocamera installed on the ceiling, in a mock home-environment setting. The algorithm was based on the Pfinder [46] background subtraction model, and
they have obtained accurate fall detection on 77% of occasions, compared to 23% missed falls and 5% false alarms.
Anderson et al. [6] have presented a framework for modelling and monitoring human activity from video, falls in particular. Their model was based on recon-structing a voxel person from the frame sequence and using fuzzy logic to classify the type of activity in which the person is engaged. In order to build a 3-D approx-imation of the human, i.e., voxel person, silhouettes are extracted from multiple camera views. The model is then refined by removing additional shadows, reflective static surfaces, and errors, to subsequently extract features from it. Features are extracted from the voxel person and used along with fuzzy inference to determine the temporal state of the resident. The resulting fuzzy rule base outputs can then be temporally processed to detect activity. This is a flexible framework in which rules can be modified, added, or removed, allowing for customization of resident-specific knowledge. Their “on-the-ground” person recognition accuracy was 97.6%, while “upright” is 83.1%. False classification of “upright” as “on-the-ground” was 10%.
A survey of some of the systems and algorithms used to detect falls in the elderly is presented by Noury et al. [28]. The review also details the difficulty of comparing the performances of the different systems due to the lack of a common framework, while presenting a possible evaluation method.
2.5 Postural sway
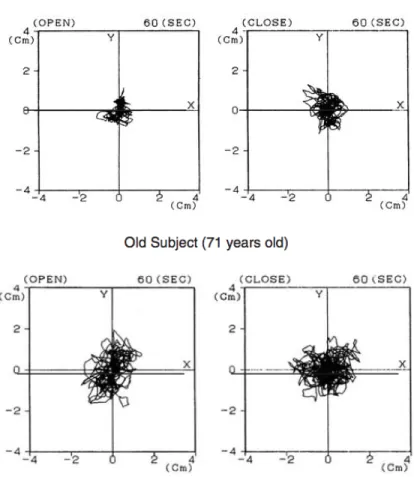
It has been observed that, as people age, or due to cerebellar disease [17], it becomes increasingly difficult to maintain one’s balance and, as such, postural sway, both lateral and anterior-posterior, increases with time [45][29][35]. In Figure 2.1, from Fujita et al. [35], we can see an example of the centre of mass (COM) trajectory for a young person, compared to that of an older person. We can see definite increased postural sway in the latter, especially with eyes opened.
bal-9
Figure 2.1 – Postural sway trajectory in a young (top) vs. an older (bottom) subject with eyes opened (left) and closed (right); Fujita et al. [35]
ance is an important predictor of falls within the elderly population. Lajoie and Gallagher [23] have conducted a comparative study in order to determine the ef-fectiveness of several scales of measure in predicting such falls, by comparing these tests as applied to older adults who have fallen before and those who have not. The study has focused on results from simple reaction time, the Berg Balance Scale (BBS), the Activities-specific Balance Confidence (ABC) scale and postural sway. Their results suggest that those who do not have a history of falling have significantly faster reaction times, higher scores on the BBS and the ABC scale as well as sway at slower frequencies when compared to those who have fallen in the past. When comparing postural sway between these two groups, those who have a history of falling seem to oscillate at a higher frequency. In addition, it was observed that postural oscillations were much more apparent in the lateral plane than in the anterior-posterior one.
2.5.1 Two-dimensional
Historically, postural sway has been measured by either following the trajectory of a person’s centre of mass (COM), or the movement of the centre of pressure (COP). Until recently, the norm was to acquire these measures by either placing sensors or markers on patients to measure the former, or else by using force plates (FPs) to measure the latter. More modern systems, however, use computer vision techniques to track relevant elements without using markers, making the process more time-efficient as well as more cost-effective.
Goffredo et al. [20] have presented a marker-less, model-free study, based on the block matching algorithm (BMA). The method consisted of tracking the relevant points on the human silhouette, followed by the evaluation of the rotations of the principal body segments, and then estimation of COM trajectories. Their method has been proven effective in correctly estimating the anterior-posterior component of a trajectory, as well as obtaining results validated by comparing the COM movement with COP variations.
11 of a single uncalibated camera, used to film one-minute video sequences of elderly patients in a community centre. The camera was placed in front of the subject, who was made to perform a series of tasks. The gold-standard was human evaluation by physical therapists, using the Berg Balance Scale (BBS). The trajectory of the postural sway was extracted by using a template tracker for the heads and feet and the results matched those obtained by the traditional visual method of the BBS. The advantages of this method over previous accelerometer, marker or FP methods is the simplicity of the setup, as well as the low cost and easy availability of the equipment.
2.5.2 Three-dimensional
Wang et al. [40] presented a method for analyzing body sway from a three-dimensional voxel reconstruction. The system consisted of two inexpensive cali-brated webcams, which were used to extract sway parameters from both standing and walking subjects. The voxel person, similarly to Wang et al. [39], was built from back-projected silhouettes extracted from multiple camera views. The Vicon marker-based motion capture was used as ground truth, and the authors have ob-tained very good agreement for body sway during standing. For walking, however, while the detected body centroid followed the Vicon results, the overall agreement numbers were lower, due to the sway amplitude having a larger error rate.
It has been noted [7] that FPs are able to measure subtle changes in a person’s standing balance that are not perceptible by a physical therapist. The use of the BBS still remains largely subjective, and thus it is preferable to measure sway more precisely using hardware or software systems. Clark et al. [4] experimented the use of the Nintendo Wii Balance Board (WBB) as a less expensive alternative to FPs. In addition to being more affordable, the WBB is also more portable and more widely available than FPs, thus making it more accessible in a variety of clinical situations.
Similarly to FPs, the WBB uses four transducers which are used to assess force distribution and the resultant movements in COP. In this study, thirty participants
were asked to perform four types of balance tasks: single limb standing with eyes closed, single limb standing with eyes open, double limb standing with eyes closed and feet together and double limb standing with eyes open and feet a comfortable distance apart. The results were evaluated in terms of COP path length, for fixed time intervals, and the data obtained from the WBB and FP were compared using intraclass correlation coefficients (ICC), Bland-Altman plots (BAP) and minimum detectable change (MDC). The ICC obtained for COP path length test-retest reli-ability between-device was fair at between 0.77 and 0.89, on all testing protocols.
In this chapter we have given ample evidence demonstrating the potential of gait and balance analysis for clinical medical practice. Traditionally, simple score sheets are used for quick screening of patients based on their balance and gait, however, these tests are limited to very simple and somewhat subjective assess-ments. More sensitive methods exist, such as motion capture devices or force plates, but usually involve complex systems requiring a dedicated laboratory with trained specialists. We have shown that, fortunately, human motion analysis with video cameras has become a viable alternative. This method has the potential benefits of being relatively affordable, marker-less, and applicable in a wide range of environments. However, this approach is currently often limited to the study of features extracted from the body’s silhouette. Furthermore, it is usually used for activity recognition or identification, while clinical applications have not yet been extensively exploited. Taking the above into account, we present in the next chapter a very simple, portable and automated system to evaluate postural sway, as a means of objective evaluation of a patient’s balance, for early detection of anomalies and assessment of fall risk in clinical or home environments.
CHAPTER 3
A SIMPLE SYSTEM FOR POSTURAL SWAY ASSESSMENT
3.1 Introduction
It has been shown in the previous chapter that the fall risk of an elderly person is correlated to their ability to maintain their equilibrium during standing position. It is therefore of interest to develop an automated system to evaluate a subject’s movement, or sway, whilst in a standing position. It this chapter, we present a simple, affordable, marker-less and portable system for postural sway assessment, as a means of objective evaluation that could be used either in a clinical or home environment.
3.2 Camera setup
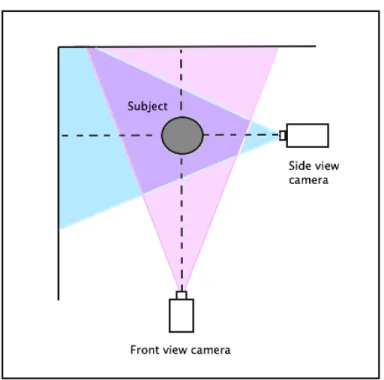
The typical system setup is quite simple with two synchronized cameras mounted on tripods, one facing the subject to assess lateral motion and the other on the side for anteroposterior measurements, as illustrated in Figure 3.1. Alternatively, one camera can be moved from the front to the side of the subject to get two independent sets of measurements.
3.2.1 Calibration
The camera model used in computer vision uses perspective projection to rep-resent the mapping from the 3D world space onto a 2D image space. Also known as the full perspective projection, this model is computationally complex, and can in certain situations be approximated by simpler methods, namely the orthogonal perspective model, the weak perspective model and the paraperspective model. Wang et al. [41] illustrate this in Figure 3.2.
Figure 3.1 – Setup for two synchronized cameras
The Orthographic Perspective model
Orthographic projection is a subset of parallel projection, for which all the pro-jection lines are orthogonal to the propro-jection plane. As it can be seen in Figure 3.2, this results in image projections which are to scale, but not representative of how a human eye would perceive them, as objects in the distance will not appear smaller than those close by.
The Weak Perspective model
The weak perspective model can be seen as a hybrid between the orthogonal perspective model and the full perspective projection model. It is defined as a per-spective projection in which each individual point depth is replaced by a constant point depth, therefore making it an orthographic projection scaled by a constant factor. The weak perspective assumption is a good approximation of perspective projection when the depth variation of the object is small compared with the
dis-15
tance to the camera.
Generally, weak perspective is a good approximation if: the focal length, as well as the field-of-view are small, the field-of-view is small comparatively to the average depth and the depth variation of the object is small compared to the average depth [31]. For example, considering a normal lens for a 35 mm camera with a focal length of f=50 mm, the distance from the camera at 2.5m and an average depth variation of a person’s head of 100mm, we can use the weak perspective model as an approximation, as all the above conditions are satisfied. These parameters correspond to our experimental setup, presented in Chapter 4.
3.2.2 Flow diagram of the system
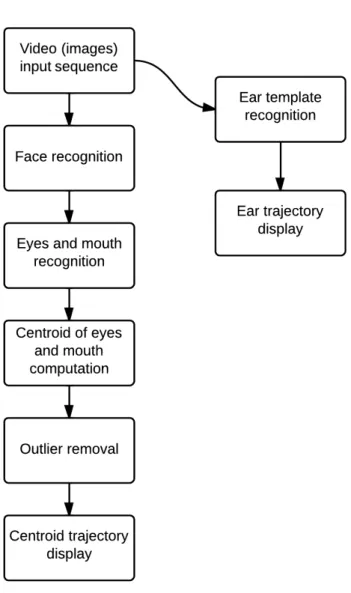
A diagram of the system flow chart is presented in Figure 3.3.
The initial videos are acquired with a static camera on a tripod, under either natural or artificial light. The images are then extracted from the videos, and each image is subsequently processed to locate the person’s face, using the Viola-Jones algorithm, presented in section 3.3. If several faces are located, we only keep the one found in the upper third or half of the image, depending on the distance of the person from the camera, discarding the image if more than one face is found in the upper region, or if no faces are located. The location of the face is not necessary for the trajectory tracking, but it is used for confirming the accuracy of the location of the eyes and the mouth, needed for postural sway assessment.
The left eye, right eye, and mouth are detected separately, also using the same Viola-Jones implementation. For each one of these, the threshold is increased until only one of each is found. The smaller the threshold is, the more detected features are found, and as the threshold is increased, there are fewer and fewer of each until the number of features detected converges to zero. The maximum threshold T, which has been empirically found to be a good cut-off point beyond which the chances of detecting something are very slim, is computed. If no left eye, no right eye, or no mouth is found up until this threshold, the image is skipped, as all three are necessary for the computation of the face centroid, used as a virtual marker for
17
lateral sway estimation. Typically, the number of skipped images is around 2%, as can be seen in Table 4.I.
The last two right eyes, two left eyes, and three mouths found while increasing the threshold are kept in memory for each image iteration, in the event that one of the current features is incorrect, i.e. not within the bounds of the face. In the majority of cases, the feature that was not correctly identified at the end is present in these last two or three saved features and is then chosen instead. Otherwise the image is skipped.
The centroid is computed for each image as the centre of the left eye, right eye and mouth. To compute the centroid, we have chosen to use both eyes, as well as the mouth, rather than only one of these features, in order to increase both precision and robustness. The outliers of the trajectory, if any, are then removed by using an implementation of the Thompson tau method [15], available online [33]. This method is based on the average of a dataset and the absolute standard deviation of each point with respect to the average. A rejection region, based on a formula using the critical value of the Student’s t-distribution probability density function, is determined, within which points are considered to be outliers. This region is given by:
Re jectionRegion= tα /2(n − 1)
√
nqn− 2 +t2 α /2
In this formula, tα /2 is the critical value from the Student t-distribution, with α = 0.05, and n as the sample size.
Finally, the trajectory of the centroid is plotted.
The procedure is somewhat different for the side view sequence of images. The trajectory of the movement viewed from the side is extracted using a subject-specific method, namely template matching, presented in section 3.4. For each subject, the template of one feature must be selected by the evaluator as a separate image and loaded into memory. In our case we used an ear, and limited the region of interest to the upper half of the image. The template matching is performed and the resulting
19 trajectory is plotted, similarly to the frontal trajectory.
Since this method is significantly more time-consuming, as it can be seen in Table 4.II, we have opted to use it for the side-view tracking only. In addition, the templates for each feature are somewhat person-specific and may need to be defined for each individual subject, further complexifying the task of the evaluator.
3.3 Viola-Jones object-detection algorithm
The Viola-Jones framework uses a set of four Haar-like features, as seen in Figure 3.4.
Figure 3.4 – Viola-Jones features; Viola and Jones [38]
These are simple features used to coarsely classify the subsections of an image, before combining them to form stronger classifiers. Each feature is computed by subtracting the pixels corresponding to the black area from the pixels corresponding to the white area. As an example, this can be seen by looking at features A and B in Figure 3.4, which are particularly sensitive to vertically and horizontally delimited image regions, respectively. However, these are primitive features and, as such, will only produce a rough evaluation.
The advantage of using such simple features, is that, due to the use of the concept of integral image, each feature can be computed in constant time. In the integral image, also known as the summed area table, the value of any point (x, y) is the sum of all the pixels above and to the left of (x, y), as seen in Figure 3.5, from Viola and Jones [38]:
I(x, y) =
∑
x0<=x y0<=y
i(x0, y0)
Figure 3.5 – The value of a point in an integral image; Viola and Jones [38]
Similarly, a rectangle defined by four points A, B, C, D will be computed with four lookups, as it can be seen in Figure 3.6, from Viola-Jones [38]:
∑
x0<=x<=x1
y0<=y<=y1
i(x, y) = I(C) + I(A) − I(B) − I(D)
Figure 3.6 – The value of a rectangle in an integral image; Viola and Jones [38]
From this, it follows that any two-rectangle feature can be computed in six array references, any three-rectangle feature in eight, and any four-rectangle feature in nine.
21 AdaBoost
Although each feature can be computed quickly, the number of possible fea-tures causes their evaluation to be inefficient and extremely time-consuming: for a 24 x 24 pixel sub-window, the number of possible features exceeds 160,000. The object detection algorithm uses a variant of AdaBoost [19] to only choose the best features.
Boosting can be illustrated by Figure 3.7, from Szeliski [34]. After each primitive classifier is selected - in our case one of the four features in Figure 3.4 - the weights of the points that were mis-classified are increased. The final strong classifier is a linear combination of the simple weak classifiers.
Figure 3.7 – AdaBoost classifiers; Szeliski [34]
Cascade architecture
The last step of the Viola-Jones framework uses a cascading approach to evalu-ate the strong classifiers. These are evaluevalu-ated successively by order of complexity, by training each successive classifier on only the sub-windows which have passed through preceding, less complex and faster, classifiers.
3.4 Template matching
To compute the profile-view sway in our subjects, we have used a different video sequence, and processed it using a template matching method. This was necessary since, in the case of a side view, the implementation of the Viola-Jones algorithm
only detects faces and eyes, rather poorly for the latter. There is an option to train classifiers to detect other features, however, this would have been extremely time-prohibitive in our case, in addition to the added difficulty of enrolling many subjects for adequate training.
Template matching is essentially a method for locating a given pattern within an image. In our case, since facial features are person-specific to a certain degree, it needs user input in selecting the region of an image that represents what is being tracked, such as an ear, a nose, or a mouth. The decision to use the visible ear for tracking was based on the fact that it is still fully visible in case the person turns their head slightly away from the camera.
Template matching uses a sliding window approach in finding a feature within an image. Out of several methods of implementing template matching, the one we have used is based on a convolution mask, applied to greyscale images. First, a template is chosen, such as the one of the ear seen in Figure 4.9. The centre or origin of the template is then moved over each point in the examined image, calculating the Sum of Absolute Differences (SAD) at each point. The SAD at point (x, y) is given by:
SAD(x, y) =
∑
i
∑
j|T (i, j) − I(x + i, y + j)|; T: template, I: image
In doing this, all possible values of the template with respect to the examined image are evaluated, and the position with the highest value is chosen. The advan-tage of this method is that it is easy to implement, however, it is slow to execute and dependent on the user selecting the template beforehand. Note that although the SAD is illumination-dependent, this is not an issue in our case because of the high frame rate and controlled environnement.
3.5 Post-processing
Our methodology, as described in subsection 3.2.2, consists of first extracting the images from video, detecting the features, then plotting the trajectory. Several
23 methods of post-processing the data have been tried. In earlier versions of our algorithm, there were instances of obvious outliers within the trajectory which were eliminated, by first using a simple rule of each point not being farther than five times the distance of the previous three pairs of points. Later on we have used an implementation of the Thompson tau method. However, this processing is less necessary with better quality videos and with a few constraints on the lighting and the subject’s clothes.
3.5.1 Focusing on Face Sway
Traditionally, we look either at the centre of gravity or centre point of pressure to assess the degree of sway. In our study, however, we have decided to focus on the face movement to determine sway. The subjects were asked to first stand with feet held together, and were not allowed to move the feet in order to keep their balance. Since our subjects were young and in good health, this test often resulted in a very small amount of postural sway. Several tests were devised to make the subjects’ sway more pronounced.
3.5.2 Frontal and side views
Our experiments consisted of sequentially filming two videos of a subject, one from the front, and another one from the side, in order to assess both medial-lateral and anterior-posterior sway. Ideally, these two videos would have been filmed at the same time with two identical cameras, however, due to practical constraints, the subject was filmed twice with the same camera, resulting in two videos of two different sway sequences.
3.5.3 Validation
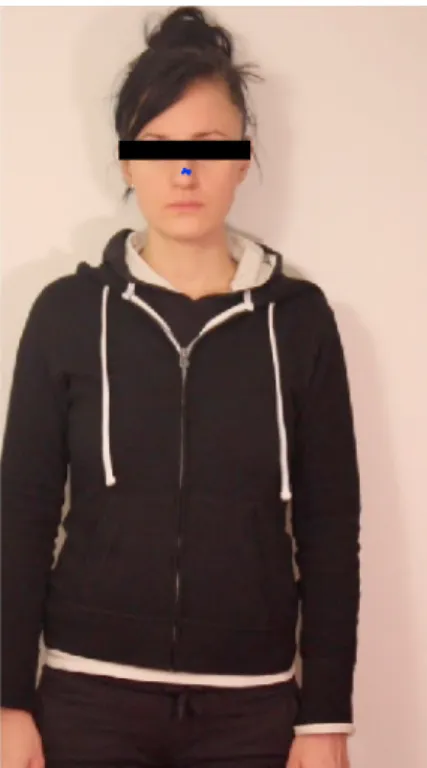
The validation process consisted of comparisons between our results and those generated by placing a green marker on the face of the subject. In the case of frontal tracking, the marker was placed on the tip of the nose, as seen in Figure 4.3, whereas
for profile tracking it was placed near the ear, as in Figure 4.9. The nose is not one of the features detected for the frontal tracking, and, for the side view, the green marker was placed outside of the area of the template. As the marker was placed on regions that were not tracked in either of the two algorithms, it did not influence the outcome of the tracking in either cases.
The tracking of the marker was done by simply extracting the green from the image, ensuring that there were no other green objects present, and tracking the trajectory of the centroid of the green pixels. Both the visual trajectories and the subsequent error calculations between our feature-tracking algorithm and the green marker tracking give us an idea of the validity of our approach, however, it is not expected that the trajectories will be identical. For the frontal images, the tracked centroid corresponds to the centre of the three features tracked: the left and right eyes and the mouth, expressed as rectangles. This centroid will not necessarily correspond to the tip of the nose. Similarly, the centre of the ear, as found by the template matching algorithm, does not necessarily move in an identical way to the centre of a marker placed on the face.
CHAPTER 4
EXPERIMENTS AND RESULTS
4.1 System implementation
The system was developed using a full version of Matlab on an 8GB Mac OS X platform. For the final testing, the videos were 30s long, at 30fps, and the native video resolution was 1920 x 1080. The algorithm was developed using the face detection implementation available in the Computer Vision toolbox of Matlab. Object detection in general, and face detection in particular, is implemented in Matlab using the Viola-Jones object-detection algorithm [38].
4.2 Experiments Empirical observations
The final algorithm and camera setup were based on a few observations made during the development phase.
4.2.1 Camera setup
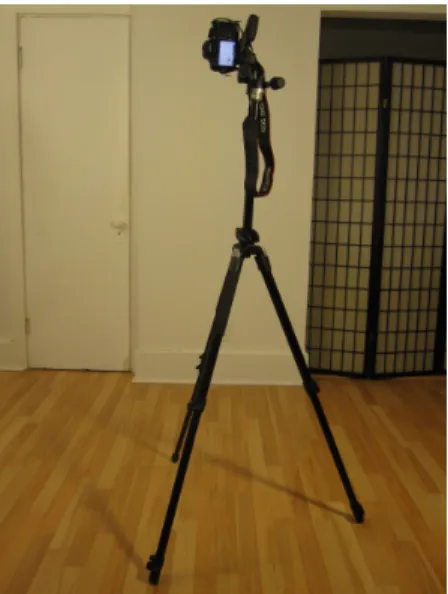
Our experiments were carried out using an 18 MP Digital SLR Camera with an 18-55mm lens. The frame rate was set at 30 fps and the resolution of the images extracted from video was 608 x 1080. The camera was placed on a tripod, facing the subject at a distance of approximately 2.5m for lateral motion assessment. Then the camera was moved to the side of the subject for anteroposterior measurements. For these experiments we did not use two synchronized cameras due to practical restrictions, but the overall methodology remains the same. Two lamps were also placed on each side of the camera, facing the subject. Figure 4.1 shows a typical camera setup, with a somewhat smaller than usual distance from the camera to the subject.
Figure 4.1 – A typical camera setup
4.2.2 Camera positioning and lighting
The camera was placed on a tripod so as the subject’s face was clearly visible and centered. The torso and upper part of the legs were also visible, while the feet and lower part of the legs were not. Because of the decision to not track the movement of the feet, it became unnecessary to have them in the videos. The algorithm also performs better when the face is not too close to the camera: for instance, when the face takes about a quarter of the image, the processing time increases more than threefold. This is due to the cascading classifiers, which take far longer to compute on a larger face. The convergence of the features towards the last correct one is also much slower within our algorithm, frequently reaching a threshold higher than 100, versus an average of 45 for a face that is only roughly a tenth of the image. The maximum threshold was set at T = 200, based on a series of empirical observations showing that the chances of detecting features above this value are very slim.
If the faces are in-plane rotated by 90 degrees, e.g. when the camera was vertical when filming and the extracted images were not subsequently unrotated, the algo-rithm fails entirely. This is due to the fact that the Viola-Jones feature detectors
27 were only trained on the normal frontal view of the faces, without rotation. The al-gorithm also performs poorly if the images have a small amount of blur, either due to fast movement or insufficient lighting. It is then paramount to ensure that there is sufficient illumination and appropriate head orientation, i.e. lighting focused on the subject and frontal view with head roll, yaw and pitch near 0 degrees.
4.2.3 Clothing
The clothing worn by the subject can also aid in increasing the accuracy of the feature detection. It generally does not matter if the person is wearing short or long sleeves or pants, as our algorithm only considers the faces detected in the upper third, or upper half of the image, depending on the distance of the subject from the camera. However, we have observed that the accuracy is improved when black clothing is used, as it created less small shadows along the folds in the clothing. These shadows may be mis-classified by the algorithm as features and significantly increase computation times. It is obviously advised to avoid wearing clothing that has faces on it, such as cartoons, as they might also be mis-classified as real faces.
4.3 Results
The results were obtained over a period of several months, using both artificial and natural light, indoors and outdoors.
4.3.1 No movement
As a control experiment, we have used a 10 second video in which there was no movement. The centroid of the two eyes and mouth was computed for all the images, and the trajectory is displayed in blue in Figure 4.2. There were no points omitted due to features not found, and no outliers were removed. As expected, the trajectory is concentrated in a very small spot. The maximum horizontal postural sway is of about 6mm, and the vertical sway is of about 4mm.
Figure 4.2 – No sway trajectory
4.3.2 Single leg balance
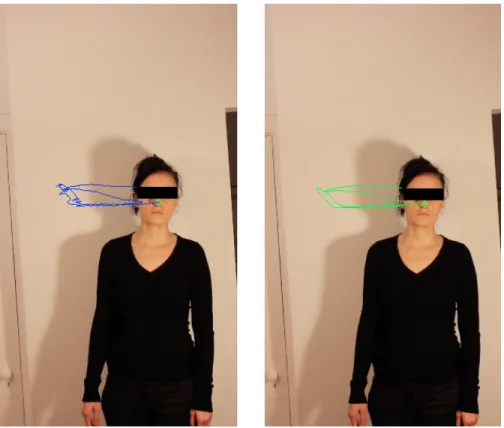
An example of a single-leg balance experiment is shown in Figure 4.3. For illustration purposes, the trajectory represents a smaller subset of images than the standard 30 seconds/900 frames we have used. In order to have a clearer trajectory displayed on the final image, we have only used 300 frames (i.e. 10 seconds).
The left image represents the trajectory as computed by our algorithm. The image on the right represents the tracking of the green marker placed on the nose, as a means of comparison to the centroid of the two eyes and the mouth, which generally falls on the nose, unless the face is not forward-facing. The two displayed trajectories are similar in shape, however, we can see that the one on the left contains some noise on the left-hand side.
This particular video sequence contains two images that were bypassed by our algorithm, both because the mouth was not found. No visible outliers were present, so the outlier removal code was not run. We computed the error between the two curves, by calculating the Euclidean distance between each pair of corresponding
29
Figure 4.3 – Trajectory comparison with ground truth
Figure 4.5 – Shorter distance from the subject
points. The mean error was found to be 9.90 pixels, with a minimum error of 0.50 pixels and a maximum error of 28.75 pixels. Displaying a ruler at the beginning of the video, we have found a correspondence of 9 pixels per cm, or 1.11mm per pixel. The mean error is then of 11mm, with a maximum of 31.91mm, and a minimum of 0.55mm. These errors are partly due to the systematic slight difference between the mouth-eyes centroid and the nose position. The graph in Figure 4.4 represents the computed distance between the two trajectories, image by image.
The postural sway from this image sequence is about 289.2mm horizontally and 63.0mm vertically, by computing the differences between the maxima and minima along the x and y axes, respectively.
4.3.3 Ball throwing
Another experiment consisted of having the subject throw a ball to somebody behind the camera and then catch it, a test devised in an attempt to increase postural sway. As seen in Figure 4.7, the tracking works well if the face is sharp and in focus, even if parts of the image are blurry. The outline of the detected face,
31
Figure 4.6 – Cropped image of a ruler from the video beginning
eyes, and mouth are displayed, along with the centroid of the eyes and mouth, in blue. The results of this test, however, have been rather poor, with an average of 15.3 skipped images for each set of a hundred. In our particular experiments, this was due to the person oftentimes looking after the ball and showing a profile face or looking down and obscuring the mouth. In a few instances, the subject completely lost their balance and the face or part of it went beyond the boundaries of the image.
The graph in Figure 4.8 depicts the number of centroid points passed over for a 30 second video sequence of our subject in Figure 4.7. We mark by a 1 an image that was skipped, thus a centroid that was not computed. The result of 138 omitted images, representing 15% of the total of 900, is much higher than for the other types of experiments, due to the aforementioned reasons.
Another thing to note, which has been observed in many of the video sequences, is that skipped images tend to cluster. This holds even for good videos (not blurry, person looking at the camera), and it shows that in most cases when features are
not detected correctly, it is as a result of the image sequence, not of the algorithm. Even minute changes, such as a person briefly squinting while trying to keep their balance or a shadow or hair obscuring a feature, can render an image unusable for feature tracking.
Figure 4.7 – Subject throwing ball
4.3.4 Comparison
During the course of our experiments, we have noted that wearing glasses does not negatively affect the eye detection, unless there is significant glare from artificial lighting. In the case that the light source directly faces the subject, it would be preferable that the subject remove their eye glasses during the experiment.
From a series of videos with the camera placed at varying distances from the subject, it has been apparent that the length of image processing increases with the subject being closer, as noted in subsection 4.2.2. As an example, the sequence of
33
Figure 4.8 – Images skipped in ball throwing experiment
900 images corresponding to the trajectory in Figure 4.5 took significantly longer to process, compared to 3.45 hours on average for smaller faces, such as the one in Figure 4.8. This is partly due to the fact that, as presented by Viola and Jones [38], the features were trained on much smaller faces than the ones used in our close-up videos. Although the results for the sequence in Figure 4.5 were very good, having omitted only nine images out of the 900, and having not removed any outliers, we have decided against using video sequences that require such extended processing times. This was due partly to our own time constraints, but also in an effort to obtain statistics helpful in building a system that would be convenient to use by a third party.
A few details worth mentioning regarding the results in table 4.I concern the size of the dataset for each type of experiment. We had many more video sequences for one-leg standing balance in artificial lighting than any other type of motion. This was because we felt it was the most representative type of movement and indoor setting. In addition, we acquired less video outdoors since it was mainly for testing purposes and it does not reflect a realistic environment for our experiments, such as a medical clinic, for example. We have noted, however, that the tracking is very good in outdoor scenes, but less so in indoor sequences with natural light
Type of experiment Average points skipped (%) Average outliers removed (%) Trajectory mean error (mm)
Two legs, artificial light 1.8 0 5.2
Single leg, artificial light 2.1 0 12.7
Single leg, natural light 1.6 0 N/A
Ball throwing 9.8 0.2 N/A
Table 4.I – Results of different experiments
only. This is mainly due to the lower exposure time needed for outdoor scenes, resulting in negligible motion blurring. In order to create a good environment with natural light, the subject needs to face a window that receives a lot of it, without any obstructions and not creating any shadows on the subject.
In addition, it was only possible to compute the trajectory error for the videos that had a green marker present. Since the ball experiment proved to create videos with many unusable images, we never attempted to calculate the trajectory error. Similarly, no marker was present in the outdoor scenes, due to the small amount of data collected.
As noted before, the quality of the images in the videos highly impacts the tracking, and this is seen in the poor results obtained for the ball throwing exper-iment: as there was a high number of images in which the person was not facing the camera, there is consequently a very high number of omitted images as well as a higher than usual number of outliers.
The number of outliers is generally low, averaging less than one per 30sec/900 frame sequence. Rounded down, we obtain the zero percent seen in the table.
Finally, we see that the trajectory error is higher for a single-leg balancing exercise than a two-leg one and this is mainly due to the fact that when there is little movement the person tends to look at the camera, and the centroid of the eyes and mouth is close to the centre of the marker on the tip of the nose. When there is more movement, the face is not perfectly frontal and this moves the centroid of
35 the eyes and mouth further away from that of the green marker.
4.3.5 Side-view ear detection
As detailed in section 3.4, the profile sway tracking was performed using a template matching method, using an implementation provided by Matlab. We have used a person-specific template for each one of our subjects, however, it is interesting to note that testing the tracking of the subject in Figure 4.10 with a template of the ear of the subject in Figure 4.5 produced similar results.
In order to compare the trajectories obtained by tracking the ear and that of the green marker, we have translated the latter by the distance between the first points of each trajectory. This method is not perfect, as this distance is not necessarily the one that would minimize the error between the two curves. Once the computed errors were available in pixels, we used the image of the ruler in Figure 4.6 to find the corresponding distance in millimetres. From this particular image, we obtained that 1 pixel represents a distance of 1.69mm. Thus, using this sequence of images, we have obtained a mean error of 9.33 pixels, or roughly 16mm between the trajectory obtained by using the template obtained from the current subject and the trajectory obtained with the template from a previous subject. The minimum error was of 0mm, as expected, due to the initial translation, while the maximum was of 14.8 pixels, or 25mm.
In Table 4.II, we present the results of using different Regions of Interest (ROIs). As expected, since we know that our subject’s ear will always be in the upper half of the image, and that template matching does not use the image as an ensemble, but rather processes it from beginning to end, the results show that a smaller ROI always produces a faster runtime, without penalizing the accuracy of the results. The image sequences for this table were of 100 frames only, as the computation times were very high, and it would have been extremely time-consuming to run 900 frames on a full-image ROI. The high run-times for these sequences are a result of the slow-computing Matlab localization function, which finds the template within the image [2]. It is then best to use the minimum possible ROI, as the computation
Figure 4.9 – Profile sway tracking: ear template and position of the green marker
37 times can increase more than threefold with larger ROIs, without significantly improving the performance.
Region of interest Computation time (min) Mean error (mm)
Full image 77 13.1
Upper half 37 15.8
Upper third 23 16.4
Table 4.II – Template tracking results
4.3.6 Trajectory comparisons
To illustrate the difference between a stable and an unstable postural movement, we have calculated the standard deviations (SDs) for each one of the trajectories. For the stable sway, we have used a video sequence in which the subject was on both legs, only moving slightly. For the unstable postural sway, we have used a video segment in which the subject had been standing on one leg for more than a minute and had visibly lost some of their balance.
As expected, we can see in Table 4.III that the SD is more than nine times higher along the x-axis and roughly five times higher along the y-axis for the unstable movement. We also notice that the SD is higher along the x-axis, when compared to the y-axis, for the same experiment, since our subjects move mostly laterally.
Sway type SD (mm) Stable x-axis 9.5 Stable y-axis 4.4 Unstable x-axis 88.1 Unstable y-axis 21.9
In addition, from the ensemble of our data, we have found a maximum anterior-posterior sway of 16.2cm, and a maximum lateral sway of 41.7cm on one leg, or 56.6cm on one leg and throwing a ball.
4.3.7 Virtual combined trajectories
Due to practical constraints, it was not possible during this project to test the synchronized capture of videos using two cameras. However, for illustration purposes, we have created a combined virtual trajectory by roughly combining the results of two sequentially shot videos. Given a set of coordinates (x, z) for the frontal view of the subject and a set of (y, z) coordinates for the side view, we take the first coordinate of each set to create a combined horizontal virtual set of coordinates (x, y), representing both movements.
Since our subjects were young and in good health, most of the sway had to be artificially provoked. As a result, as we can see in the combined trajectories in Figure 4.11, the movement on the x-axis has higher amplitude, as healthy subjects tend to have a more pronounced lateral sway.
CHAPTER 5
CONCLUSION AND FUTURE WORK
5.1 Overview
In this project, we have implemented a simple and inexpensive system for track-ing postural sway, the motivation behind this betrack-ing the facilitation of an objective assessment by evaluating personnel. By tracking movement by computer, we pro-duce a quantifiable result that may not necessitate the presence of a qualified professional for evaluation.
Our system is based on the processing of two different video streams, by using two methods of feature tracking. We use an implementation based on the Viola-Jones algorithm for lateral, front-facing movement, and template matching for side-view anterior-posterior movement.
We have obtained good results for both methods, with a small margin of error when compared to the tracking of a marker placed on the face. An important factor in having successful experiments is the quality of the video, as noisy images can render the feature tracking ineffective. In these cases, the images are bypassed during processing and removing a high number of images from the sequence can significantly affect the overall resulting movement trajectory.
5.2 Future work
As a first improvement to our system, we would consider an alternate method for the profile tracking. Template matching has a slow feature-detection speed, in addition to being dependent on a user selecting the template of the feature to be searched. Another option would be to to train new classifiers for detecting profile features by using a publicly available face dataset, such as the CMU Image Database [1], which contains profile images with annotated ears.
cameras, as seen in figure 3.1, in order to film the lateral and the anterior-posterior movements at the same time. The cameras would be placed facing straight ahead, at face-level for the subject, thus keeping the cameras’ optical axes perpendicular to the subject, and also perpendicular to each other, for correct tracking of both the frontal and profile features. The two videos obtained in this fashion could be synchronized by a short burst of light, signalling to the algorithm the beginning of the two sequences to be processed. This method would be the simplest since it wouldn’t involve any hardware signal analysis, or processing of sound from the videos, which is discarded when the video clips are sequenced, and we would only need the extra step of detecting a burst of light within images which are already processed with the current implementation. We could also consider a few bursts of light to improve time registration of both sequences.
This improvement would slightly increase the cost of the system, however, it would render the framework much more user-friendly by fully automating the pro-cessing of the image sequences, and thus rendering it a viable option for use in a clinical setting.
Finally, we plan to also explore the possibility of reducing the positioning error by the application of a more powerful tracking algorithm using methods such as Kalman filters or particle filters. These methods are reliable and efficient and very robust to noisy or missing measurements. We believe that the added complexity will be compensated by their accuracy.
To conclude this work, we hope that this type of portable imaging system will be useful in both clinical and home environments, as a screening tool to detect elderly ambulatory problems or other musculoskeletal disorders. It would allow the early detection of such problems, before more sophisticated tests could be conducted in more specialized facilities. We believe that the relative simplicity and reliability of such a system will facilitate the examination of the patient and encourage clinicians to use it.
[1] CMU/VASC image database. http://vasc.ri.cmu.edu/idb/html/face/. [Online; accessed 29-July-2014].
[2] Template matching in Matlab. http://www.mathworks.com/help/ vision/ref/vision.templatematcher-class.html. [Online; accessed 07-September-2014].
[3] J.K. Aggarwal and M.S. Ryoo. Human activity analysis: A review. ACM Computing Surveys (CSUR), 43(3):16, 2011.
[4] S. J. Allin, C. Beach, A. Mitz, and A. Mihailidis. Video based analysis of standing balance in a community center. Proc. 30th Annual International Conference of the IEEE Engineering in Medicine and Biology Society, 347 (22):4531–4534, 2008.
[5] S.J. Allin, C. Beach, A. Mitz, and A. Mihailidis. Video based analysis of standing balance in a community center. Engineering in Medicine and Biol-ogy Society, 2008. EMBS 2008. 30th Annual International Conference of the IEEE, pages 4531–4534, 2008.
[6] D. Anderson, R.H. Luke, J.M. Keller, M. Skubic, M.J. Rantz, and M.A. Aud. Modeling human activity from voxel person using fuzzy logic. Fuzzy Systems, IEEE Transactions on, 17(1):39–49, 2009.
[7] S. J. M. Bamberg, A. Y. Benbasat, D. M. Scarborough, D. E. Krebs, and J. A. Paradiso. Gait analysis using a shoe-integrated wireless sensor system. Information Technology in Biomedicine, IEEE Transactions on, 4(12):413– 423, 2008.
[8] A. Baumann, M. Boltz, J. Ebling, M. Koenig, H.S. Loos, M. Merkel, W. Niem, J.K. Warzelhan, and J. Yu. A review and comparison of measures for
auto-43 matic video surveillance systems. EURASIP Journal on Image and Video Processing, 824726:1–30, 2008.
[9] I. Bautmans, B. Jansen, B. Van Keymolen, and T. Mets. Reliability and clinical correlates of 3d-accelerometry based gait analysis outcomes according to age and fall-risk. Gait & posture, 57(2):366–372, 2011.
[10] M. Belshaw, B. Taati, D. Giesbrecht, and A. Mihailidis. Intelligent vision-based fall detection system: preliminary results from a real-world deployment. RESNA/ICTA 2011: Advancing Rehabilitation Technologies for an Aging So-ciety, 2011.
[11] K. Berg. Measuring balance in the elderly: preliminary development of an instrument. Physiotherapy Canada, 41(6):304–311, 1989.
[12] K.O. Berg, B.E. Maki, J.I. Williams, P.J. Holliday, and S.L. Wood-Dauphinee. Archives of physical medicine and rehabilitation. Clinical and laboratory mea-sures of postural balance in an elderly population, 73(11):1073–1080, 1992. [13] L.K. Boulgarides, S.M. McGinty, J.A. Willett, and C.W. Barnes. Use of
clin-ical and impairment-based tests to predict falls by community-dwelling older adults. Physical Therapy, 83(4):328–339, 2003.
[14] Statistics Canada. Projected population by age group according to three projection scenarios for 2006, 2011, 2016, 2021, 2026, 2031 and 2036. http://www.statcan.gc.ca/tables-tableaux/sum-som/l01/cst01/ demo08a-eng.htm, 2014. [Online; accessed 24-April-2014].
[15] J. M. Cimbala. Thompson tau method for removing outliers. https: //www.mne.psu.edu/me345/Lectures/outliers.pdf. [Online; accessed 25-July-2014].
[16] W. Deisman, P. Derby, A. Doyle, S. Leman-Langlois, R. Lippert, D. Lyon, J. Pridmore, E. Smith, K. Walby, and J. Whitson. A report on camera surveil-lance in Canada (part one). http://www.sscqueens.org/sites/default/
files/SCAN_Report_Phase1_Final_Jan_30_2009.pdf, 2009. [Online; ac-cessed 21-June-2014].
[17] H.C. Diener, J. Dichgans, M. Bacher, and B. Gompf. Quantification of postural sway in normals and patients with cerebellar diseases. Electroencephalography and clinical neurophysiology, 57(2):134–142, 1984.
[18] G.R. Fernie, C.I. Gryfe, P.J. Holliday, and A. Llewellyn. The relationship of postural sway in standing to the incidence of falls in geriatric subjects. Age and Ageing, 11(1):11–16, 1982.
[19] Y. Freund and R.E. Schapire. A decision-theoretic generalization of on-line learning and an application to boosting. Computer Vision and Pattern Recog-nition, 2001. CVPR 2001. Proceedings of the 2001 IEEE Computer Society Conference on, 1:I–511, 1995.
[20] M. Goffredo, M. Schmid, S. Conforto, and T. D’Alessio. A markerless sub-pixel motion estimation technique to reconstruct kinematics and estimate the centre of mass in posturography. Medical engineering & physics, 28(7):719–726, 2006. [21] D. Hodgins. The importance of measuring human gait. Medical Device
Tech-nology, 19(5):44–47, 2008.
[22] C. M. Kawamura, M. C. de Morais Filho, M.M. Barreto, S.K. de Paula Asa Y. Juliano, and N.F. Novo. Comparison between visual and three-dimensional gait analysis in patients with spastic diplegic cerebral palsy. Gait & posture, 25(1):18–24, 2007.
[23] Y. Lajoie and S.P. Gallagher. Predicting falls within the elderly community: comparison of postural sway, reaction time, the berg balance scale and the activities-specific balance confidence (ABC) scale for comparing fallers and non-fallers. Archives of gerontology and geriatrics, 38(1):11–26, 2004.
45 [24] L. Lee, W. Grimson, and L. Eric. Gait analysis for recognition and classifica-tion. Automatic Face and Gesture Recognition, 2002. Proceedings. Fifth IEEE International Conference on, pages 148–155, 2002.
[25] T. Lee and A. Mihailidis. An intelligent emergency response system: pre-liminary development and testing of automated fall detection. Journal of Telemedicine and Telecare, 11:194–198, 2005.
[26] B.E. Maki, P.J. Holliday, and A.K. Topper. A prospective study of postural balance and risk of falling in an ambulatory and independent elderly popula-tion. Journal of Gerontology, 49:M72–M84, 1994.
[27] M.S. Nixon, T. Tan, and R. Chellappa. Human identification based on gait, volume 4. Springer, 2010.
[28] N. Noury, A. Fleury, P. Rumeau, A.K. Bourke, G.O. Laighin, V. Rialle, and J.E. Lundy. Fall detection-principles and methods. Engineering in Medicine and Biology Society, 2007. EMBS 2007. 29th Annual International Conference of the IEEE, pages 1663–1666, 2007.
[29] T.E. Prieto, J.B. Myklebust, R.G. Hoffmann, E.G. Lovett, and B.M. Mykle-bust. Measures of postural steadiness: differences between healthy young and elderly adults. Biomedical Engineering, IEEE Transactions on, 43(9):956–966, 1996.
[30] Division of Aging Public Health Agency of Canada and Seniors. Re-port on seniors’ falls in Canada, 2005. publications.gc.ca/collections/ Collection/HP25-1-2005E.pdf, 2005. [Online; accessed 24-April-2014]. [31] L. S. Shapiro. Computer vision: algorithms and applications. Cambridge
University Press., 2005. [Online; accessed 25-July-2014].
![Figure 3.2 – Different projection models; Wang et al. [41]](https://thumb-eu.123doks.com/thumbv2/123doknet/12545531.343564/27.918.195.797.330.754/figure-different-projection-models-wang-et-al.webp)
![Figure 3.4 – Viola-Jones features; Viola and Jones [38]](https://thumb-eu.123doks.com/thumbv2/123doknet/12545531.343564/31.918.400.582.459.621/figure-viola-jones-features-viola-and-jones.webp)
![Figure 3.5 – The value of a point in an integral image; Viola and Jones [38]](https://thumb-eu.123doks.com/thumbv2/123doknet/12545531.343564/32.918.352.635.590.827/figure-value-point-integral-image-viola-jones.webp)
![Figure 3.7 – AdaBoost classifiers; Szeliski [34]](https://thumb-eu.123doks.com/thumbv2/123doknet/12545531.343564/33.918.182.823.492.645/figure-adaboost-classifiers-szeliski.webp)