HAL Id: inria-00638698
https://hal.inria.fr/inria-00638698
Submitted on 7 Nov 2011
HAL is a multi-disciplinary open access
archive for the deposit and dissemination of
sci-entific research documents, whether they are
pub-lished or not. The documents may come from
teaching and research institutions in France or
abroad, or from public or private research centers.
L’archive ouverte pluridisciplinaire HAL, est
destinée au dépôt et à la diffusion de documents
scientifiques de niveau recherche, publiés ou non,
émanant des établissements d’enseignement et de
recherche français ou étrangers, des laboratoires
publics ou privés.
Scalable Fixed-Point Free Instruction Cache Analysis
Damien Hardy, Benjamin Lesage, Isabelle Puaut
To cite this version:
Damien Hardy, Benjamin Lesage, Isabelle Puaut. Scalable Fixed-Point Free Instruction Cache
Anal-ysis. The 32nd IEEE Real-Time Systems Symposium (RTSS 2011), Nov 2011, Vienne, Austria.
�inria-00638698�
Scalable Fixed-Point Free Instruction Cache Analysis
Damien Hardy
Benjamin Lesage
Isabelle Puaut
University of Rennes 1, UEB, IRISA
Rennes, France
{Damien.Hardy, Benjamin.Lesage, Isabelle.Puaut}@irisa.fr
Abstract—Estimating worst-case execution times (WCETs)
for architectures with caches requires the worst-case number of cache misses to be upper bounded. Most existing static cache analysis methods use fixed-point computation and do not scale well with large code sizes. To address this scalability issue, we propose in this paper a new fast and scalable instruction cache analysis technique. In contrast to existing work, neither fixed-point computation nor heavyweight interprocedural analysis are required. Thus, code sizes too long to analyze with existing techniques are then analyzable with lower analysis time and memory consumption, and with only a slight degradation of the analysis precision. Experimental results show a reduction of the analysis execution time of a factor 5 in average (with a peak near 30 for the largest and most complex code) with only a degradation of the analysis precision of 0.5% in average. The proposed technique is intended to be used in situations where the need for fast analysis outweighs the need for very tight results: early software development phases, timing analysis of large pieces of software, or iterative WCET-oriented compiler optimizations.
Keywords-Hard real time systems, worst-case execution time
estimation, instruction caches
I. INTRODUCTION
Caches aim at filling the ever broadening gap between fast micro-processors and slow memories. By taking advan-tage of the temporal and spatial locality inherent to most applications, caches improve average-case memory access latencies. This positive impact on access latencies, and thereby systems’ throughputs, led to the wide adoption of architectures comprehending caches even in the context of embedded real-time systems.
A requirement of hard real-time systems is to prove that tasks meet their deadlines in all execution scenarios, including the worst-case. To attain this level of confidence, the worst-case execution time (WCET) has to be estimated for any task in the system. WCET estimates must offer both safety and tightness properties. Safety is the guarantee that the estimated WCET is greater than or equal to any possible execution time. Tightness means that the estimated WCET is as close as possible to the actual WCET to correctly dimension the resources required by the system.
WCET estimation methods have to account for all possi-ble flows in a program and determine the longest execution path (so-called high-level analysis). They also have to ac-count for the hardware the program is running on, through a
low-level analysis. A number of static analysis methods have been designed in the last two decades at both levels [1].
The presence of caches in real-time systems makes the low-level analysis harder due to the dynamic behavior of caches. Safely estimating WCETs on architectures with caches requires knowledge of all possible cache contents at every program point, which in turn requires knowledge of the cache replacement policy.
Much research has been undertaken, during the last two decades, with the objective of predicting WCETs in archi-tectures equipped with caches. In most static cache analysis methods, fixed-point analysis is applied on the control flow graph of tasks to determine all possible cache contents in every execution point. The analysis result is then a classification of the outcome of every memory reference in the worst-case execution scenario (e.g. hit, always-miss, first-always-miss, etc.). Although shown to be tight, fixed-point based methods can be very time and memory consuming. To overcome these scalability issues, we propose in this paper a fixed-point free instruction cache analysis. This analysis uses standard information extracted from the control flow graph and commonly used in compilers [2]: dominator in-formation, and loops entries and back-edges. Thanks to this information, the proposed analysis identifies from the control flow graph the most common reference patterns resulting in cache hits (among other reference patterns, sequential execution of instructions stored to the same memory block, execution within loops of code small enough to stay resident in the cache). Our method is modular in the sense that each reference pattern can be applied independently of the others depending on the analysis requirements in terms of tightness and analysis cost.
A fast and simple basic analysis is first presented. Two extensions are then proposed to tighten WCET estimates, at the price of a reasonable extra computation time.
The goal of our method is not to provide results as tight as existing analyses. Rather, our goal is to allow the user to trade analysis tightness for analysis efficiency. Experimental results show that WCET estimates are close to an existing state-of-the-art analysis [3], whereas on the largest piece of code analyzed, the analysis run-time is only one-thirtieth of the time required by the state-of-the-art approach.
The proposed technique is thus intended to be used in situations where the need for fast analysis outweighs the
need for very precise results. A typical situation is early soft-ware development phases, during which the softsoft-ware code is modified frequently and tightness of WCET estimates is not that crucial. Another case is the analysis of large and complex software, for which the tightest analyses are too time and memory consuming. Finally, some WCET-oriented optimizing compilers, such as WCC [4], may need to itera-tively estimate WCETs in order to apply optimizations along the longest execution path. Hence, they require to estimate WCETs as fast as possible even if these estimates are slightly less tight.
The remainder of the paper is organized as follows. Section II first compares our work with related work. As-sumptions and notations are given in Section III. Our cache analysis method is presented in Section IV. Experimental results are given in Section V. Finally, Section VI concludes the paper and gives directions for future work.
II. RELATED WORK
Many WCET estimation methods have been designed in the last decades (see [1] for a survey). Among them, the mostly used WCET computation technique, called IPET (Implicit Path Enumeration Technique) [5], estimates the WCET through the resolution of an Integer Linear Program-ming (ILP) problem constraining the execution frequencies of the program’s basic blocks.
Static WCET estimation techniques need a hardware analysis phase to determine the worst-case timing behavior of the microarchitectural components: pipelines and out-of-order execution [6], [7], branch predictors [8] and caches. Regarding caches, two main classes of approaches have been designed: integrated approaches analyse the cache behavior simultaneously with WCET computation, whereas decou-pled approaches perform a separate cache analysis whose results are subsequently used by the WCET computation step.
Among integrated approaches, the methods presented in [9], [10] generate an ILP system that both computes the WCET and captures cache effects, through variables in the ILP computation that model for each memory reference if the reference hits the cache or not. Such a fine-grain cache modeling, as reported in [10], might result in very long computation times for set-associative caches (e.g. more than 15 hours to analyze the jpeg benchmark (5.5KB) for a 2-way set-associative instruction cache). In [11], a cycle-accurate processor simulator is extended to enable symbolic execution with unknown input data values; it uses alternative instruction semantics to handle unknown operands. While shown to provide tight WCET estimates, a limitation of the approach is its computational complexity, mainly due to the use of a processor simulator and a (limited) exploration of feasible paths.
For the sake of separation of concerns and analysis efficiency, decoupled approaches analyse the cache
behav-ior separately. Static cache simulation [12], [13], based on dataflow analysis, and the methods described in [14], [3], [15], based on abstract interpretation, both use fixed-point computation to determine the cache contents at all program points, considering all execution paths altogether. These two classes of methods provide a classification of the outcome of every memory reference in the worst-case execution scenario (e.g. always-hit, always-miss, first-miss, etc.). These methods were originally designed for code only, and for direct-mapped or set-associative caches with a Least Recently Used (LRU) replacement policy. They have been later extended to other replacement policies [16], data and unified caches [17], [18], and caches hierarchies [19]. Such techniques were shown to be very tight, especially when considering instruction caches only. However, the need for fixed-point computation makes these techniques prohibitively expensive for large code sizes. In contrast, our method, while providing slightly less tight results, is shown to have a much lower time complexity.
A similar effort, to reduce the cost of cache analyses, was initiated in [20]. Separate analyses of each function are performed using static cache simulation. Afterward, the results are composed in a final step. Instead, we completely abstract ourselves from fixed-point based cache analyses.
III. ASSUMPTIONS AND NOTATIONS
The static cache analysis presented in this paper focusses on instruction caches. An architecture with one level of cache (L1) is assumed. The cache is set-associative, with an associativity degree of k, and implements the LRU (Least Recently Used) replacement policy. The address space of every program is logically partitioned into a set of memory blocks. Upon a miss in the cache, a memory block is loaded as a whole in the cache line of equal size. Each instruction is located in a single memory block.
The outcome of the proposed static cache analysis is very similar to the one of existing static cache analysis methods. For each reference within a memory block, a Cache Hit/Miss Classification (CHMC) defines its worst-case behavior:
• always-hit (AH ): the reference will always result in a
cache hit,
• first-miss (FMℓ): the reference could not be classified
as hit in the first time it occurs inside loop ℓ, but will result in cache hits in later iterations,
• not-classified (NC ): in all other cases.
The proposed analysis is contextual: it categorizes each reference in each of its call contexts. The call context of a function f is defined as a path in the program call graph (assumed to be acyclic), and is represented as a list of call basic blocks traversed from the program entry function up to f . The program entry point has a single, empty call context. CTX(i) denotes the set of call contexts attached to instruction i.
The analyses focus on natural loops [2], loops possessing a single entry block, their entry basic block, and possibly several back-edges leading back to the aforementioned entry block.
IV. FAST AND SCALABLE INSTRUCTION CACHE ANALYSIS
The proposed analysis, illustrated in Figure 1, is divided and introduced in two parts. The first one, described in paragraph IV-A and called basic instruction cache analysis, focuses on the easy-to-capture reference patterns: references appearing inside each basic block in isolation; references in loops, by determining if the memory blocks accessed inside the loop can be ensured to stay in the cache during its execution.
Then, two kinds of additional (and optional) extensions are proposed, in paragraph IV-B, to tighten the estimates of the basic analysis, depending on the user-selected trade-off between analysis precision and execution time. The first extension focuses on each memory block accessed by different basic blocks. The second one targets memory blocks reused between successive calls to the same function. The two extensions can be applied separately or jointly, and in the latter case, with no imposed order of application.
Extensions (optional)
analysis Loop analysis
Intra basic block analysis
Inter basic block
analysis Inter call
Basic analysis (mandatory)
Figure 1. Analysis framework
While our analysis produces a cache classification for every call context, the analysis is applied on each function separately, to avoid heavyweight interprocedural analysis. A. Basic instruction cache analysis
In this section, we define a basic instruction cache analysis divided in two different parts. The first one, called intra basic block analysis, captures a part of the spatial locality, whereas the second one, called loop analysis, captures a part of the temporal locality due to program loops.
Intra basic block analysis
Caches are very efficient at capturing spatial locality in programs by loading information at the memory block granularity. A memory block contains several consecutive instructions. Upon a cache miss, the whole memory block containing the missing instruction is loaded into the cache, and consecutive accesses to the same memory block result in cache hits, as illustrated in Figure 2. In the figure, when instruction i1’s fetch results in a cache miss, the whole
memory block will be loaded from the memory, and thus consecutive instructions i2 and i3 will hit.
memory block imb_first imb_first i1 i2 i3 i4 i5 i6 i7 hit
{
hit{
basic block memory blockFigure 2. Intra basic block analysis
According to this behavior, a very simple intra basic block analysis is defined as follows. Inside a basic block, instructions are executed sequentially in their address order, resulting in consecutive accesses to the same memory block. Thus, every access to a memory block in a basic block can be classified as AH, except the one with the lower address. Formally:
∀i ∈ Instr , ∀ctx ∈ CTX (i), CHMC(i, ctx) = AH if ¬ first access (i, mb(i), bb(i)) (1)
where Instr is the set of all program’s instructions, bb(i) is the basic block which contains i, mb(i) is the memory block containing i and first access is a boolean function returning true if i is the first access to mb(i) inside bb(i).
This analysis is applied to each basic block of the program in all call contexts. Only first accesses to memory blocks inside basic blocks remain not-classified (N C) after this analysis step. Such accesses are called imb f irst hereafter,
and the set of all such accesses is denoted IMBFirst . The other analyses defined in this paper focus only on accesses in the IMBFirst set.
Loop analysis
During the execution of a loop, a memory block, denoted mb, accessed inside the loop may be kept in the cache after it has been first loaded. More precisely, assuming a LRU replacement policy, block mb is guaranteed to stay in the cache if the number of other distinct memory blocks possibly accessed within the loop and mapped to the same cache set as mb, is strictly lower than the cache associativity degree. In that case, the access to this memory block can result in a miss or a hit the first time it is referenced, and in hits afterwards (classification FM).
After an identification of loops using standard compiler techniques [2], the loop analysis determines for each loop ℓ of the program, all memory blocks possibly accessed inside ℓ, denoted MBloop(ℓ). MBloop(ℓ) is computed in a
straightforward manner by determining all memory blocks referenced by the basic blocks executed within the scope of ℓ, denoted BBloop(ℓ). This includes all basic blocks of
functions called, directly or indirectly, by basic blocks in the loop, as illustrated in Figure 3. In the figure, when analyzing loop ℓ in function main, MBloop(ℓ) contains the memory
blocks of all basic blocks shown in the figure, due to the direct call to foo and the indirect call to bar.
Then, for a given memory block mb mapped to cache set s, if the number of memory blocks of MBloop(ℓ), mapped
call foo call bar
function: main function: foo function: bar
loop
BB
Figure 3. Loop analysis.
to s and different from mb, is strictly lower than the cache’s associativity degree, imb f irst accesses to mb are classified
as FM. Formally:
∀i ∈ IMBFirst, ∀ctx ∈ CTX (i), ∀ℓ ∈ Loop, CHMC(i, ctx) = FMℓif
bb(i) ∈ BBloop(ℓ) ∧
| {c ∈ MBloop(ℓ) : c 6= mb(i) ∧ set(c) = set(mb(i))} |< k (2)
where Loop is the set of all the program loops, BBloop(ℓ)
is the set of all basic blocks referenced when executing ℓ, set is a function returning the cache set where a memory block is mapped and k is the cache associativity degree. B. Extensions of the instruction cache analysis
The basic instruction cache analysis presented in IV-A is local (to a basic block for the intra basic block analysis, to a loop for the loop analysis). Consequently, it does not detect that a memory block accessed by a basic block might have been loaded by its predecessor(s) in the control flow graph. Similarly, the basic analysis does not detect that a memory block referenced in a function might have been loaded in the cache by previous calls to the same function. The analysis steps defined below detect these two situations, and are presented respectively in paragraphs B.1 and B.2.
Let us first introduce two conditions used in these analy-ses: the Not evicted condition and the Dominance condition.
• Not evicted condition.
This condition is introduced to capture the fact that a memory block mb cannot be evicted between two of its accesses, once it has been set to the most recently used position by the first one. Thanks to the properties of the LRU replacement policy, mb cannot be evicted if less than k different memory blocks, in conflict with mb, are accessed between the two accesses, with k the cache associativity.
If BB denotes the set of memory blocks possibly referenced between the two accesses to mb, a boolean function not evicted(mb, BB ), that returns true if mb is ensured not to be evicted between the two accesses, and false otherwise, is defined as follows:
not evicted(mb, BB ) = | {c ∈ Blocks(BB) : c 6= mb ∧ set(c) = set(mb)} |< k (3)
In the formula, set(mb) is a function which returns the cache set where mb is mapped in the cache, and Blocks(BB ) is a function returning the sets of memory blocks accessed by each basic block of BB .
The not evicted condition is used in the analysis exten-sions for different parameters BB , whose computation are detailed in due course.
• Dominance condition.
This condition is introduced to ensure that given two basic blocks, any path reaching the second basic block traverses the first one before. This allows us to ensure that a memory block accessed by the dominated basic block is set to the most recently used position into the cache set by the dominating basic block.
The verification of the dominance condition relies on the computation of dominators [2] within each function. Inter procedural dominator information is not required. Each analysis defines its own dominance condition detailed in due course.
1) Inter basic blocks analysis (IB)
Our inter basic blocks analysis takes into account three different cases where a given basic block bb accesses a memory block mb previously loaded by other basic block(s): (i) the direct predecessors of bb have loaded mb ; (ii) an indirect predecessor which dominates bb has loaded mb ; (iii) the direct predecessors of bb in a loop have loaded mb in a loop.
It can be noticed that the set of basic blocks which are accessing the same memory block mb is easily determined by scanning all memory blocks accessed by each basic block. Then, only basic blocks accessing the same memory blocks have to be matched against the following patterns.
• (i) Direct predecessors analysis.
Intuitively, when two basic blocks p and bb access the same memory block mb and p is the only direct predecessor of bb in a function, the imb f irst access
to mb in bb will result in a cache hit. Indeed, we are sure that any path reaching bb traverses p before, and sets mb to the most recently used position in the cache set. The analysis focuses on the most widespread case: the memory block in common is accessed by the last instruction (ilast) of p and the first instruction (if irst)
of bb.
Based on this observation, and generalizing it to basic blocks with multiple predecessors, the analysis clas-sifies as AH, imb f irst accesses to memory blocks
ensured to be in the cache because they have been loaded in the cache by all their direct predecessors in the function. A memory block is guaranteed to be in the cache at bb if two conditions are met: (i) all its direct predecessors have accessed this memory block and (ii) any possible execution path between each of the
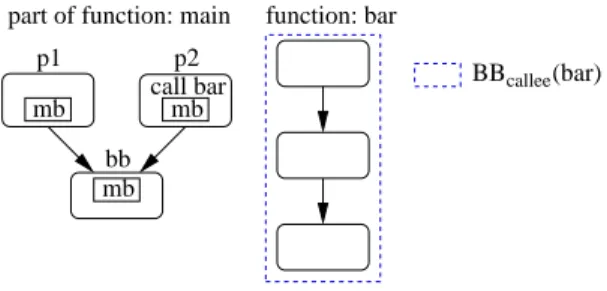
call bar callee(bar)
function: bar part of function: main
bb mb mb mb p2 p1 BB
Figure 4. Direct predecessors analysis
predecessors and bb cannot evict it. This latter condition is required in case some of the predecessors call a function. Formally:
∀i ∈ IMBFirst, ∀ctx ∈ CTX (i), CHMC(i, ctx) = AH if ∀p ∈ predecessors(bb(i)), mb(ilast(p)) = mb(i) ∧ if irst(bb(i)) = i ∧
caller(p) ⇒ not evicted (mb(i), BBcallee(callee(p)) (4)
where ilast(p) is the last instruction of p, if irst(b) is
the first instruction of b, caller(p) a boolean function which returns true if p calls a function, callee(p) returns the function called by p and BBcallee(f ) the
set of all basic blocks possibly reached by function f . BBcallee(f ) contains all the basic blocks of function
f and transitively called functions, as illustrated in Figure 4. In the figure, BBcallee(bar) contains all basic
blocks of function bar, called by p2 in function main. • (ii) Indirect predecessor analysis
In some cases, an indirect predecessor p of a basic block bb, with p dominating bb, can access the same memory block mb as bb. As exemplified in Figure 5, this case may occur when the loop’s entry basic block is put at the end of the loop in the binary code. In such a case, bb is inside a loop ℓ, p is ℓ, and they are both accessing mb. In this loop layout, the memory block in common is accessed by the last instruction (ilast) of p and the
first instruction (if irst) of bb. The analysis focuses on
this common case.
back−edge 1 p,bb mb mb p bb loop’s entry BB
Figure 5. Indirect predecessor analysis
Then, the imb f irstaccess to mb by bb can be classified
as AH if mb cannot be evicted by accesses inside the loop (determined by the loop analysis presented in
Section IV-A).
To verify that mb is not evicted between p and bb, the set of basic blocks possibly executed between p and bb, and noted BB1p,bb, has to be determined. As we
know that p is a dominator of bb, this is easily done by gathering the basic blocks (except those coming from back-edges of loop ℓ) met during a reverse graph traversal starting from bb (not included) up to p (not included) and then, by adding all basic blocks of functions called directly or indirectly by p or by basic blocks reached during the graph traversal. Formally:
∀i ∈ IMBFirst, ∀ctx ∈ CTX (i), ∀ℓ ∈ Loop if∃p ∈ dom(bb(i)), bb(i) ∈ BBloop(ℓ) ∧ p 6∈ BBloop(ℓ) ∧
mb(i) = mb(ilast(p)) ∧
if irst(bb(i)) = i ∧
not evicted(mb(i), BB1p,bb(i))
then if CHMC(i, ctx) = FMℓthen CHM C(i, ctx) = AH (5)
• (iii) Direct predecessor(s) of loop entry
The last case of our inter basic blocks analysis also results from the mapping, in the binary code, of the loop’s entry basic block after the loop’s body. Let us assume, as illustrated in Figure 6, that the loop’s entry basic block bb and its direct predecessor p, inside the loop, are accessing the same memory block mb. In such a case, when bb is executed, we are sure that p was traversed before bb inside the loop. Thus, imb f irst
accesses to mb in bb result in hits after the first iteration of the loop (FM classification). In this situation, p is linked to bb by the back-edge of the loop. Again, the memory block in common is accessed by the last instruction (ilast) of p and the first instruction (if irst)
of bb. back−edge mb mb loop’s entry p bb
Figure 6. Direct predecessor(s) of loop entry
Based on this observation, and generalizing it to loops with multiple back-edges, the dominance condition is verified if each in-loop predecessor of the loop’s entry basic block is accessing mb. Regarding the not evicted condition, it is ensured in a straightforward manner
if none of bb’s predecessors calls a function, because in that case, no access to other memory blocks can occur between the ilast instruction of each predecessor
and the if irst access of bb. Otherwise, the not evicted
condition is ensured by considering the basic blocks of functions called directly or indirectly by each caller predecessor. Formally:
∀i ∈ IMBFirst , ∀ctx ∈ CTX (i), if∃ℓ ∈ Loop, bb(i) = entry(ℓ) ∧ if irst(bb(i)) = i ∧
∀p ∈ predecessors(bb(i)) ∩ BBloop(ℓ),
mb(i) = mb(ilast(p)) ∧
caller(p) ⇒ not evicted (mb(i), BBcallee(callee(p))
then if CHMC(i, ctx) 6= AH CHMC (i, ctx) = FMℓ (6)
2) Inter call analysis (IC)
Between two executions of a given function, some mem-ory blocks loaded by the first execution may be kept in the cache when the second execution occurs. In such a situation, a memory block mb is kept in the cache between these runs, and can be classified as AH in the second execution, if the following conditions are met:
• (p1): whenever the second instance occurs, the first
instance must have taken place before;
• (p2): mb must be accessed by the function, each time
this function is called;
• (p3): mb cannot be evicted between its access in the
first instance and its access in the second one. We can notice that properties p1 and p2 form the domi-nance condition while p3 is the not evicted condition. The concordance of two instances of a function to properties p1, p2 and p3 is detailed below.
Each instance of a function is represented by its call context, ctx1 and ctx2 respectively for the first and the second instance of the studied function. The call contexts are denoted [c1, c2, ..., cn] for ctx1 and [c′1, c′2, ..., c′m] for
ctx2, and contain the list of call basic blocks in the acyclic call graph, traversed from the program entry function up to the studied instance.
As ctx1 and ctx2 are different call contexts, their paths share at least a common prefix, possibly empty. Hence, ctx1 (resp. ctx2) can be expressed as [c1, c2, ..., cd−1, cd, ..., cn]
(resp.[c1, c2, ..., cd−1, c′d, ..., cm′ ]) such that cd6= c′d; (cd, c′d)
is the divergence point of ctx1 and ctx2.
Property p1: Given two different call
contexts, ctx1 and ctx2, represented by their paths [c1, c2, ..., cd−1, cd, ..., cn] and [c1, c2, ..., cd−1, c′d, ..., c′m],
and (cd, c′d) their divergence point. ctx1 is ensured to occur
before ctx2 if:
cd∈ dom(c′d) (7)
∧
∀i > d ∧ i ≤ n, ∀bb ∈ exit(function(ci)), ci∈ dom(bb) (8)
where exit(f ) returns all the exit basic blocs of function f and function(ci) returns the function containing basic bloc
ci.
Intuitively, cd and c′d belong to the same function since
they have been reached by going through the same call basic blocks path. cdis ensured to be traversed before c′daccording
to the dominator relation (equation 7). Then according to equation 8, each call basic block of ctx1 located after cd
is ensured to be traversed. Each of them dominates its function’s exit basic blocks.
Property p2: Given a memory block mb, mb is ensured to be accessed each time function f is called if:
∃i ∈ Instr , function(bb(i)) = f ∧ mb(i) = mb ∧
∀bb ∈ exit (function(bb(i))), bb(i) ∈ dom(bb) (9)
Intuitively, we check that mb is accessed by at least one basic block which dominates function f exit basic blocks. This implies the traversal of this basic block each time f is called.
Property p3: Given a memory block mb, mb cannot be evicted between its access in ctx1 and its access in ctx2 of a same function f if:
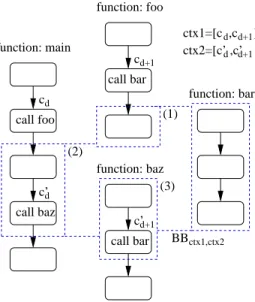
not evicted(mb, BBctx1,ctx2) (10)
where BBctx1,ctx2 is the set of basic blocks possibly
reached between the call contexts ctx1 and ctx2 of f . The computation of BBctx1,ctx2, is achieved in three
steps. The first step gathers all the basic blocks contained in f . Then, based on the divergence point (cd, c′d) of ctx1
and ctx2, and property p1, basic blocks met in the following graph traversals are gathered:
• (1) from each call basic block reached after cd (not
included) in ctx1, down to their respective function exit basic blocks;
• (2) from c′d up to cd (not included);
• (3) from each call basic block reached after c′din ctx2,
up to their respective function entry basic block. As illustrated in Figure 7, (1) considers all the basic blocks from the end of the first instance of f to the successors of cd, (2) considers all the basic blocks from the successors of
cd to c′d, and (3) considers all the basic blocks from c′d to
the second instance of f .
The last step adds to BBctx1,ctx2, all basic blocks of
functions called directly or indirectly by a basic block determined by the two previous steps.
Function f may have more than two call contexts. In such a situation, we only have to consider in the analysis the immediate dominating context in accordance with the dominance condition. An immediate dominating context is derived from its set of dominators similarly to the derivation of a basic block’s immediate dominator from its set of dominators.
function: bar call bar function: foo call bar d c’ cd+1 d ctx2=[c’ ,c’ ]d+1 function: main (2) (3) (1) BBctx1,ctx2 function: baz c’d+1 cd call foo call baz d d+1 ctx1=[c ,c ]
Figure 7. Inter call analysis for the function bar
Finally, for each function f , and each of its call contexts ctx, all imb f irst accesses to memory blocks which verify
the not evicted condition and the dominance condition between the immediate dominating context of ctx and ctx are classified AH.
V. EXPERIMENTAL RESULTS
In this section, we compare the tightness and cost (in terms of computation time and memory consumption) of the proposed method with those of a state-of-the-art instruction cache analysis [3] used as a baseline. We first describe the experimental conditions (§ V-A) and then we give and analyze results of our experiments (§ V-B).
A. Experimental setup
Analyzed codes: The experiments were conducted on seven benchmarks from the M¨alardalen WCET benchmark suite1, and on the Debie software, developed by the Euro-pean Space Agency. Debie monitors space debris and mi-crometeoroids in situ by detecting impacts using mechanical and electrical sensors. We have analyzed two tasks of Debie, as well as the test suite of Debie, which is to the best of our knowledge the largest real-time application publicly avail-able. Table I summaries the applications’ characteristics. The analyzed programs include both small loop intensive programs (jfdctint, minver, crc, qurt, fft, adpcm) and control programs, containing less loops and more complex flows of control (statemate, Debie tasks and Debie test suite).
Cache analysis and WCET estimation: The experiments were conducted on MIPS R2000/R3000 binary code com-piled with gcc 4.1 with no optimization. The default linker memory layout is used: functions are represented in memory sequentially, and no alignment directive is used. The WCETs of tasks are computed by the Heptane timing analyzer [21],
1http://www.mrtc.mdh.se/projects/wcet/benchmarks.html
more precisely its Implicit Path Enumeration Technique (IPET), solving linear equations generated from the program control flow graph, as originally proposed in [5].
Only the outermost loops are analyzed in our experiments to underline the impact on the tightness of referenced patterns not captured by our loop analysis. Moreover, to separate the effect of caches from those of other parts of the processor micro-architecture, the WCET estimation only accounts for the contribution of caches to the WCET. The effects of other architectural features are not considered. In particular, we do not take into account timing anomalies caused by interactions between caches and pipelines, as defined in [11]. The cache classification NC is thus assumed to have the same worst-case behavior as a miss during the WCET computation.
The state-of-the-art baseline instruction cache analysis used in our experiments is an implementation of the cache analysis of [3], based on abstract interpretation. For each of its composing fixed-point analyses, respectively Must and Persistence, abstract cache states (ACSs) are computed upon each basic block entry and exit. ACSs for the Must analysis model memory blocks known to be present in cache, whereas for the Persistence analysis they model memory blocks persistent in loops. Until a fixpoint on ACSs’ contents is reached, a basic block’s entry ACS is computed from its predecessors’ exit ACSs; similarly, an exit ACS is computed from said basic block’s input and its sequence of memory accesses. The cache analysis starts with an empty cache state, which is safe in the assumed context (absence of timing anomalies, use of the LRU replacement policy). The safety issue in the original persistence analysis of [3], recently identified and corrected in [22] is solved using the method given in [22].
The three most interesting configurations of our cache analysis framework are compared to each others and to the state-of-the-art fixed-point based analysis:
• the basic analysis only, denoted BA;
• the basic analysis with the inter basic blocks analysis,
denoted BA+IB;
• the analysis with the inter basic blocks analysis and
inter call analysis, denoted BA+IB+IC.
Cache configurations: The experiments were conducted using two different cache sizes. For the M¨alardalen WCET benchmarks and for the two tasks of Debie, a 1KB cache is used. A 8KB cache is used for the test suite of Debie. In both configurations, a cache associativity of 4 and a 32B cache line size are used.
Metrics: To evaluate the precision of our approach, we compare the predicted hit ratio obtained using the different configurations of our analysis framework with the hit ratio predicted by the state-of-the-art analysis. The predicted hit ratio is the percentage of instructions classified as hits, computed on the worst-case execution path identified by the IPET WCET computation.
Name Description Code size
of analyzed functions (bytes)
minver Inversion of floating point 3x3 matrix 4408
jfdctint Integer implementation of the forward DCT (Discrete Cosine Transform) 3040
crc Cyclic redundancy check computation 1432
qurt Root computation of quadratic equations 1928
fft Fast Fourier Transform 3536
adpcm Adaptive pulse code modulation algorithm 7740
statemate Automatically generated code by STARC (STAtechart Real-time-Code generator) 8900 Debie
acquisition task handling of sensors’ data 6592
tc execution task telecommand execution task 13664
test suite Calls and tests all the primitives of the Debie software 45952 Table I
CHARACTERISTICS OF ANALYZED CODES
Regarding the evaluation of the cost of our analysis, the computation time evaluation has been realized on an Intel Core 2 Duo 3 GHz with 8 GB of RAM and the memory consumption is measured with Valgrind.
B. Experimental results
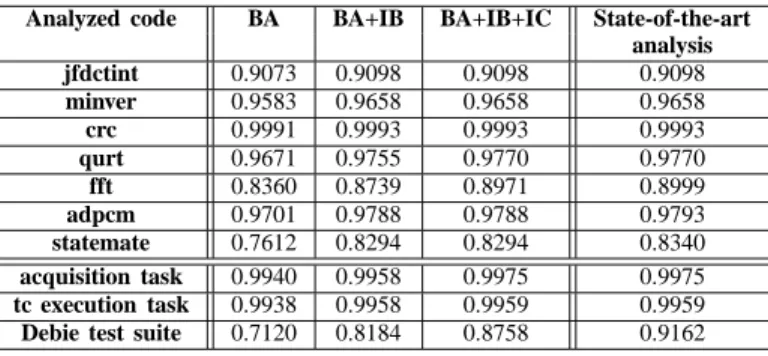
Analysis tightness: Table II compares the tightness of our analysis with the one of a state-of-the-art analysis, for the three studied configurations of our analysis framework (BA, BA+IB, BA+IB+IC).
As shown in Table II, the hit ratios predicted by the state-of-the-art analysis and those predicted by our analysis with all extensions enabled are always close to each other. The difference in percentage between the baseline state-of-the-art method and the BA+IB+IC analysis is computed by the following formula: hit ratiobaseline−hit ratioBA+IB+IC
hit ratiobaseline ∗ 100.
In average for all analyzed codes, the difference is 0.53%. For most analyzed small codes, the two predicted hit ratios are equal (jfdctint, minver, crc, qurt, acquisition task, and tc execution task). In some cases, our analysis provides slightly less tight results than the state-of-the-art method (fft, adpcm, statemate, with a difference in predicted ratio of respectively 0.31%, 0.05% and 0.55%). A careful examina-tion of the structure of these codes allowed us to identify two different scenarios implicitly captured by the state-of-the-art analysis only: (i) memory blocks shared between different functions due to function frontiers not aligned on memory block boundaries, which are not captured by our analysis;(ii) memory blocks kept between successive calls to the same function in different loop iterations, which is not investigated by our analysis. Those two cases constitute interesting, tightness-improving, future extensions of our method. The maximum difference between the state-of-the-art method and BA+IB+IC is 4.40% for the largest analyzed code (Debie test suite); due to the code complexity, further experiments would be needed to pinpoint the exact sources of pessimism of our analysis.
As one would expect, for all analyzed codes, the hit ratio of the fixed-point free analysis with all extensions
(BA+IB+IC) is always strictly higher than the hit ratio obtained with the basic analysis (BA). Concerning the in-dividual impact of the analysis extensions on tightness, we observe that the IB extension benefits to all of analyzed codes. The IC extension benefits to some analyzed codes only (qurt, fft, acquisition task, tc execution task, Debie test suite); jfdctint, minver, crc, adpcm and statemate are unaffected by the IC extension, because their code does not reuse memory blocks between function calls. A good knowledge of the analyzed application, or an initial analysis run during an iterative process, may guide the activation of the IC extension during WCET analyses.
Analysis cost (time and memory): Table III compares the cost of the proposed cache analysis, with all extensions enabled, with the cost of the baseline analysis. The left part of the table gives the analysis run-time, while the right part gives the analysis memory consumption. The costs are evaluated for the cache analysis only, and exclude costs for loading the control flow graph in memory and computing the WCET from the cache classification.
Regarding the analysis execution time, the proposed anal-ysis is always faster than the baseline analanal-ysis. In average for all analyzed codes, the proposed analysis is more than 5 times faster than the state-of-the-art. The most interesting feature is that the larger speedup is obtained with the largest and most complex analyzed code (Debie test suite), which is the objective of our analysis. For that code, the proposed analysis is close to 30 times faster than the baseline.
Similarly, the memory consumption of the proposed anal-ysis is much lower than the one of the baseline analanal-ysis (3.9 times lower in average for all the benchmarks). And interestingly again, the code with the best improvement in terms of memory consumption is the largest and most complex code we have analyzed (Debie test suite), which required 12 times less memory to be analyzed using our method than using the baseline analysis.
Table IV gives a detailed view of the analysis cost for the Debie test suite, for the different studied analysis configu-rations (BA, BA+IB, BA+IB+IC, state-of-the-art analysis).
Analyzed code BA BA+IB BA+IB+IC State-of-the-art analysis jfdctint 0.9073 0.9098 0.9098 0.9098 minver 0.9583 0.9658 0.9658 0.9658 crc 0.9991 0.9993 0.9993 0.9993 qurt 0.9671 0.9755 0.9770 0.9770 fft 0.8360 0.8739 0.8971 0.8999 adpcm 0.9701 0.9788 0.9788 0.9793 statemate 0.7612 0.8294 0.8294 0.8340 acquisition task 0.9940 0.9958 0.9975 0.9975 tc execution task 0.9938 0.9958 0.9959 0.9959
Debie test suite 0.7120 0.8184 0.8758 0.9162
Table II
PREDICTED HIT RATIO OF THE FIXED-POINT FREE ANALYSIS COMPARED TO THE STATE-OF-THE-ART ANALYSIS. CACHE SIZE OF1KB (8KBFOR DEBIE TEST SUITE).
Analyzed code Execution time (s) Memory consumption (MB)
BA+IB+IC State-of-the-art BA+IB+IC State-of-the-art
analysis analysis jfdctint 0.003 0.004 0.15 0.30 minver 0.003 0.009 0.24 0.59 crc 0.003 0.006 0.15 0.44 qurt 0.003 0.009 0.28 0.81 fft 0.009 0.022 0.54 1.65 adpcm 0.016 0.046 0.94 4.91 statemate 0.018 0.069 1.51 6.60 acquisition task 0.015 0.022 0.97 2.37 tc execution task 0.036 0.060 4.08 5.47
Debie test suite 8.07 239.17 250.70 3088.07
Table III
EXECUTION TIME AND MEMORY CONSUMPTION OF THE FIXED-POINT FREE ANALYSIS COMPARED TO THE STATE-OF-THE-ART ANALYSIS. CACHE SIZE OF1KB (8KBFOR THEDEBIE TEST SUITE).
Metrics BA BA+IB BA+IB+IC State-of-the-art
analysis Analysis 2.31 2.85 8.07 239.17 time (s) (2.31 + 0.54) (2.31 + 0.54 + 5.22) Memory 152.66 171.38 250.70 3088.07 consumption (MB) Table IV
COMPUTATION TIME AND MEMORY CONSUMPTION FOR THEDEBIE TEST SUITE COMPARED TO THE STATE-OF-THE-ART ANALYSIS. CACHE SIZE OF
8KB.
The basic analysis BA detects a part of the application locality captured by the cache. Nevertheless, the improve-ments in terms of precision attained by the use of the IB extension clearly outweighs the negligible extra computation time required to perform this analysis. This is an argument in favor of the inclusion of the IB extension in the default analysis framework. Higher precision can still be reached by applying the IC extension at the price of extra compu-tation time, larger than the execution time of IB, but still reasonable.
In summary, depending on the context of WCET estima-tion (early software development phases or iterative WCET-oriented compiler optimizations), and the user knowledge about the application structure, the user can selected the best trade-off between analysis precision and analysis execution
time.
VI. CONCLUSION
In this paper, we have introduced a novel fixed-point free instruction cache analysis, to abstract cache analysis from costly fixed-point computation. A basic analysis and two optional extensions have been proposed based on classi-cal graph information commonly used in compilers. This modularity allows for trade-offs between analysis tightness and efficiency, depending on the analysis context such as early software development phases, timing analysis of large pieces of software, or iterative WCET-oriented compiler optimizations.
The experimental results show that the proposed analysis yields results close to the ones obtained using a state-of-the-art analysis (average loss of precision of 0.5%).
Further-more, the analysis with all the extensions selected shows a significant reduction in terms of computation time and memory consumption; in average, the analysis is 5 times faster and consumes 4 times less memory than one state-of-the-art analysis.
In future research, we plan to improve the tightness of our method by defining additional extensions, as an example to capture reuse between calls to functions performed inside loops. We also plan to extend our analysis to support other replacement policies. We conjecture that this can be achieved by using the minimum life-span bound defined in [23]. Another direction for future work is the extension of this approach to analyze data caches and cache hierarchies, for uni-core and multi-cores architectures.
ACKNOWLEDGMENT
The authors would like to thank Andr´e Seznec and the anonymous reviewers for their fruitful comments on earlier versions of this paper.
REFERENCES
[1] R. Wilhelm, J. Engblom, A. Ermedahl, N. Holsti, S. Thesing, D. Whalley, G. Bernat, C. Ferdinand, R. Heckmann, F. Mueller, I. Puaut, P. Puschner, J. Staschulat, and P. Sten-str¨om, “The worst-case execution time problem—overview of the methods and survey of tools,” vol. 7, no. 3, 2008, ACM Transactions on Embedded Computing Systems (TECS). [2] S. S. Muchnick, Advanced compiler design and
implementa-tion, 1997.
[3] H. Theiling, C. Ferdinand, and R. Wilhelm, “Fast and precise WCET prediction by separated cache and path analyses,”
Real-Time Systems Journal, vol. 18, no. 2-3, pp. 157–179,
2000.
[4] H. Falk and P. Lokuciejewski, “A compiler framework for the reduction of worst-case execution times,” Real-Time Systems
Journal, vol. 46, no. 2, pp. 251–300, Oct. 2010.
[5] S. Malik and Y. T. S. Li, “Performance analysis of embedded software using implicit path enumeration,” Design
Automa-tion Conference, pp. 456–461, 1995.
[6] J. Engblom and A. Ermedahl, “Pipeline timing analysis using a trace-driven simulator,” in Proceedings of the 6th
International Conference on Real-Time Computing Systems and Applications, Dec. 1999.
[7] X. Li, A. Roychoudhury, and T. Mitra, “Modeling out-of-order processors for WCET estimation,” Real-Time Systems
Journal, vol. 34, no. 3, Nov. 2006.
[8] A. Colin and I. Puaut, “Worst case execution time analysis for a processor with branch prediction,” Real-Time Systems
Journal, vol. 18, no. 2-3, pp. 249–274, May 2000.
[9] Y.-T. S. Li, S. Malik, and A. Wolfe, “Efficient microarchi-tecture modeling and path analysis for real-time software,” in
Proceedings of the 16th Real-Time Systems Symposium, 1995,
pp. 298–307.
[10] ——, “Cache modeling for real-time software: beyond direct mapped instruction caches,” in Proceedings of the 17th
Real-Time Systems Symposium, Dec. 1996, pp. 254–263.
[11] T. Lundqvist and P. Stenstr¨om, “Timing anomalies in dynam-ically scheduled microprocessors,” in Proceedings of the 19th
Real-Time Systems Symposium, 1999, pp. 12–21.
[12] F. Mueller, “Static cache simulation and its applications,” Ph.D. dissertation, Florida State University, 1994.
[13] ——, “Timing analysis for instruction caches,” Real-Time
Systems Journal, vol. 18, no. 2-3, pp. 217–247, 2000.
[14] C. Ferdinand, “Cache behavior prediction for real-time sys-tems,” Ph.D. dissertation, Saarland University, 1997. [15] C. Ferdinand, R. Heckmann, M. Langenbach, F. Martin,
M. Schmidt, H. Theiling, S. Thesing, and R. Wilhelm, “Reli-able and precise WCET determination for real-life processor,” in EMSOFT ’01: Proceedings of the First International
Work-shop on Embedded Software, ser. Lecture Notes in Computer
Science, vol. 2211, Tahoe City, CA, USA, Oct. 2001, pp. 469–485.
[16] R. Heckmann, M. Langenbach, S. Thesing, and R. Wilhelm, “The influence of processor architecture on the design and the results of WCET tools,” Proceedings of the IEEE, vol.9,
n7, 2003.
[17] R. T. White, F. Mueller, C. A. Healy, D. B. Whalley, and M. G. Harmon, “Timing analysis for data and wrap-around fill caches,” Real-Time Systems Journal, vol. 17, no. 2-3, pp. 209–233, 1999.
[18] S. Chattopadhyay and A. Roychoudhury, “Unified cache modeling for WCET analysis and layout optimizations,” in
Proceedings of the 30th Real-Time Systems Symposium, 2009,
pp. 47–56.
[19] D. Hardy and I. Puaut, “WCET analysis of instruction cache hierarchies,” Journal of Systems Architecture, 2010. [20] K. Patil, K. Seth, and F. Mueller, “Compositional static
in-struction cache simulation,” in Proceedings of the 2004 ACM
SIGPLAN/SIGBED conference on Languages, compilers, and tools for embedded systems, ser. LCTES ’04, 2004, pp. 136–
145.
[21] A. Colin and I. Puaut, “A modular and retargetable framework for tree-based WCET analysis,” in Euromicro Conference on
Real-Time Systems (ECRTS), Delft, The Netherlands, Jun.
2001, pp. 37–44.
[22] B. K. Huynh, L. Ju, and A. Roychoudhury, “Scope-aware data cache analysis for WCET estimation,” in The 17th
IEEE Real-Time and Embedded Technology and Applications Symposium, 2011.
[23] J. Reineke, D. Grund, C. Berg, and R. Wilhelm, “Timing pre-dictability of cache replacement policies,” Real-Time Systems