IVERSITÉ D QUÉBEC À MONTRÉAL
ÉTUDE DE LA LIGNE PL IE- EIGE DA S LA VALLÉE DE
KANA ASKI ALBERTA
MÉMOIRE
PRÉSE TÉ
COMME EXIGE CE PARTIELLE
DE LA 1AÎTRISE E SCIE CES DE L'ATMOSPHÈRE
PAR
É ULIE POIRIER
UNIVERSITÉ DU QUÉBEC À MONTRÉAL Service des bibliothèques
Avertissement
La diffusion de ce mémoire se fait dans le respect des droits de son auteur, qui a signé le formulaire Autorisation de reproduire et de diffuser un travail de recherche de cycles supérieurs (SDU-522 - Rév.0?-2011 ). Cette autorisation stipule que «conformément
à
l'article 11 du Règlement no 8 des études de cycles supérieurs, [l'auteur] concède à l'Université du Québec à Montréal une licence non exclusive d'utilisation et de publication de la totalité ou d'une partie importante de [son] travail de recherche pour des fins pédagogiques et non commerciales. Plus précisément, [l'auteur] autorise l'Université du Québec à Montréalà
reproduire, diffuser, prêter, distribuer ou vendre des copies de [son] travail de recherche à des fins non commerciales sur quelque support que ce soit, y compris l'Internet. Cette licence et cette autorisation n'entraînent pas une renonciation de [la] part [de l'auteur]à
[ses] droits moraux nià
[ses] droits de propriété intellectuelle. Sauf entente contraire, [l'auteur] conserve la liberté de diffuser et de commercialiser ou non ce travail dont [il] possède un exemplaire.»REMERCIEMENTS
Je tiens à remercier le ConsC'il cle recherches en scicnc s naturelles et en génie elu Canada (CRSNG), les Fond de recherche atur et technologies du Québ~c (FRQ T), Envir nnement ct Changement climatique Canada et le Changing Cold Region Network (C 'R ) pour avoir contribué au financement de c projet. Merci aussi à tou les participants de la campagne de terrain Alberta Field Project. Merci à Paul Vaqu r pour m'avoir fourni des données de la campagne de terrain. Merci à mon mari Martin pour m'avoir supporté lor· cl mon retour aux 'tudcs qui aura duré cinq ans. M rci au profœscur René Laprise pour m'avoir permis de faire mes débuts en recherche lors cl stages d'été ainsi qu'à Oumarou ikiéma et Danahé Paquin-Ri ard pour leur aide précieuse durant mes premiers stages. Merci tout particulièr ment à ma directrice, la professcure Julie M. Thériault, pour m'avoir donné l'opportunité cl participer à la campagne d terrain, pour sa confiance en rn i ct aussi pour sa grande disponibilité.
LISTE DES FIGURES . . LISTE DE TABLEAUX
TABLE DES MATIÈRES
LISTE DES ABRÉVIATIO S, SIGLES ET ACRONYMES RÉS MÉ . . . . INTRODUCTIO CHAPITR I ARTICLE . . ABSTRACT . 1.1 Introduction . 1.2 Case overvicw 1.2.1 Alb-rta Field Projcct . 1.2.2 Ca ·c Study: 31 Mar h 2015 1.3 Methodology . . . . . . . . 1.3.1 Model configuration 1.3.2 S nsitivity experiments . 1.4 Impacts of mclting and sublimation
vii Xl Xlll xv 1 9 11 12 18 18
19
24 24 25 27 1.4.1 CTL simulation . . . . . 271.4.2 R lativ importance of rn lting and sublimation 30 1.4.3 Impacts of sublimation on the valley flow . . . . 32 1.4.4 Discussion on the mechanisms of the vall y flow r vcrsal 37 1.5 Impacts of accretion aloft . . .
1.5.1 Experiment with no graupcl 1.5.2 Rolc of a ·crction 1.6 Discussion . . . . . 41 41 43 48
vi
1.6.1 Atmospheric conditions during the Albrrta Field Proj ct 48 1.6.2 Rain-snow boundarics in the Kananaskis valley 49 1. 7 Con cl us ion . . . . . . . . . . . . . . . . . . . . . . .
53
1.8 Appcndix A: Paramctcrization of snow sublimation 56CONCLUSION . . 59
APPENDICE A
CONFIGURATIO DÉTAILLÉE DU MODÈLE 63
APPENDICE B
SCHÉMA MICROPHY IQUE MILBRANDT ET YAU .
67
APPENDICE C
DESCRIPTION DÉTAILLÉE D CAS D 28 MARS 2015
69
LISTE DES FIGURES
Figure Page
0.1 Emplacement de la vallée d Kananaskis en Alberta. 6 1.1 Ar a of intercst and 1 km mesh domain in WRF model. . 1G 1.2 Surfac analysis at 0000 TC 1 April 2015. source: Environment
and Climate Change Canada. . . . . . . . . . . . . . . . . . . 20 1.3 (a) urfacc temprraturc (solid line) and dcv.r point temperature
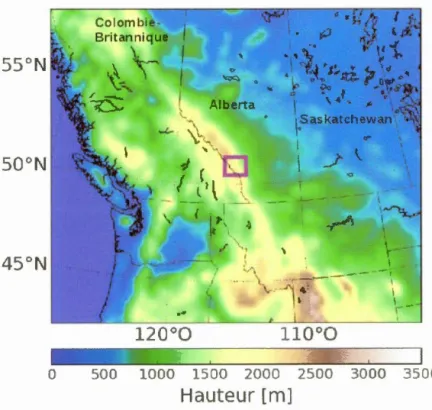
(clash cd li ne), (b) wind speed and ( c) precipitation types observee! at KES. Data arc from the data logger (orange), the Alberta En-vironment \V ath er station (purple) and visual observa ti ns (gr en). 21 1.4 Temperatur (soli lline) and dew point tempcratur (clash cl line)
v rti al profil s at 2100 UTC 31 March 2015 ab ve the KES site. Both the souncling launcllcd (blue) and the control run (black) dc-scribed in section 1.3.1 are shown. . . . . . . . . . . . 22 1.5 R-ficctivity measurcd by the Micro Rain Radar at th KES site n
31 Mar h 2015. . . . . . . . . . . . . . . . . . . . . . . . . . . 23 1.6 Pr cipitation accumulation from 1800 TC 31 March 2015 to 0000
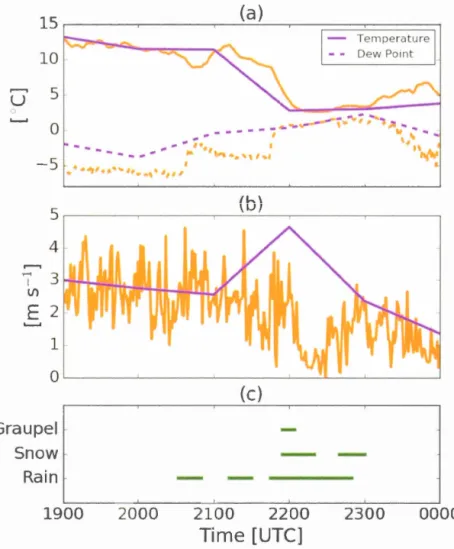
UTC 1 April 2015 for (a) rain and (b) snow and graupel. . . . . . 28 1.7 Timc evolution of (a) snow, (b) graupel and (c) rain mixing ratio
at the KE site on 31 March 2015 for th control run. The s lid linc indicates the hcight of the
o
o
c isot
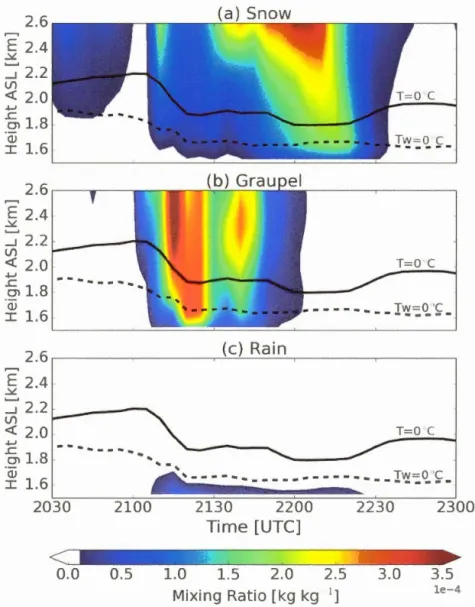
h rm and the dashed line indicates th(~ hcight whcrc the wet-bulb temperature is 0°C. . . . 29 1. Cooling rate(dT/dt)
associated with (a) mclting and (b)sublima-tion of snow and graup 1 above the KES ·itc on 31 March 2015 for the control run. The solid linc indicates the hcight of th 0°C isotherm and the dashccl linc indicat s th height where the wct-bulb tC'mp rature i ·
o
o .
The red color indicates an arca of heating duc to vapor deposition. . . . . . . . . . . . . . . . . . . . . . 31Vlll
1.9 Time evolution of (a) the precipitation rate and (b) the relative humidity at the surface, along with ( c) the tE'mperaturc, wincl specd and wind direction abovc the KES site on 31 farch 2015. Thesc rcsults arc for the control run (black line), the run without the cooling effects of tmblimation (blue line) and the run without the cooling e:ffccts of mel ting (orange li ne). The gray arca in ( c) is the region whcre the rain-snow boundary is locatecl. . . . . . . . . . . 33
1.10 Time evolution of (a) snow, (b) gra 1pel and (c) rain mixing ratio at the KES site on 31 March 2015 for the run without the cooling cffccts of sublimation. The solid line indicatcs thr hcight of the
o
o
c
isothcrm and th clash cl linc indicatcs the hcight whcrc the wct-bulb tcmperaturr is 0°C. . . . . . . . . . . . . . . . . . . . 351.11 Time evolution of the wincl direction at KE site on 31 March 2015 for the control run (black li ne) and for the data from the Alberta Environment weather stati n locatccl at KES site (purple linc). . . 37
1.12 Wind specd (w-st-east wind component) at 21GO UTC 31 March 2015 for (a) the control run and (b) the run without t.he cooling cffects of sublimation. The orange line indi ,ates the position of the
o
o
c iso
therm at 1800 UTC and the white line indicatcs its position at 2150 TC. . . . . . . . . . . . . . . . . . . . . . . . 381.13 Lower atmosphcric profiles from the KES site at rvcry 10 min from 2100 to 2230 UTC. Earlier times arc in rcd and shifts towarcls blue. (a) to
(cl
)
arc for the control simulation and ( c) to (h) arc for the run without the cooling effccts clue to sublimation. In particular, (a) and (e) is the t mperature, (b) and (f) i thr mixin ·ratio for snow plus graupel, (c) and (g) is the potential tcmpcraturr,(cl
) and
(h) is the Brunt-Vaisala frequcncy. . . . . . . . . . . . . . . . 401.14 Timc evolution of (a) the precipitation rate and (b) the relative humidity at the surfac , along with ( c) the trmpcraturc, wind spcccl and wind direction abovc the KES site on 31 March 201G. Thesc results arc for the control run (black lin ) and the run assuming no graupel formation (pink line). The gray arca in ( ') is the region wherc the rain-snow l ounclary is locatecl. . . . . . . . . . . . . . . 42
l.lo Cooling rate
(dT/dt)
associated with (a) mclting and (b) sublima-tion of snow abovc th KES ~ite on 31 March 2015 for the run assuming no graupcl formation. The ~olid linr indicatcs the h ight of theo
o
c
isothcrm and th da ·hed lin- indicat s the hcight wher.lX
th wet-bulb temperature is 0°C. . . . . . . . . 44
1.16 Hcating rate
(dT/ dt
) associa
ted with accretion ab ove the KES site on 31 March 2015 for the control run. The solid linc indicates the height of theo
o
C is therm. . . . . . . . . . 45 1.17 V< rtical profiles of (a)dT/dt
due to mdting and sublimation ordepo ition, (b) mean mass diameter
(Dm)
of snow and grau pel, and ( c) mixing ratio (Q) of snow, gr
au pel, rain and lou cl droplet at 2120 UTC 31 March 2015 above the KES ~itc for the run without the heating effect of accretion (soli cl lin ) and th control run ( dashed linc). . . . . . . . . . . . . . . . . . . 461.1 Wind dir-ction at the KES ite on 31 Mar h 2015 for the ontrol run (black line) anl th run without the heating effcct of accretion (green li ne). . . . . . . . . . . . . . . . . . . . . . . . 48
1.19 Tim. evolution of (a) snow, (b) graupel and ( ) rain mixing ratio at the KES site on 2 1arch 2015 for the control run. The solicl line indicates the hcight f th
o
o
c
isothcrm and the da hed line indicates the hcight wher th wct-bulb t-mperaturc is 0°C. . . . 11.20 Tim evolution of (a) the t mperature, (b) the r lativc humidity, ( ) the wind direction and (cl) the precipitation rate at the KES site on 2 Mar h 2015 for the control run (black line), th run without the cooling effe .ts f ·ublimation (blu linc) and th run without th cooling effccts of mel ting (orange li ne). . . . . . . . . . . . 52
1.21 Cooling rate
(dT/ dt
)
associat d with the ~ublimation f ~now for (a) the original Milbranclt and Yau schcme and (b) the modified schcme. . . . . . . . . . . . . . . . . . . . . . . . . . 58A.l Configuration du domaine dans le mo lèle num'.rique WRF où dOl est le domain- à résoluti n horizontale de 27 km (188 x 150 points de grille), d02 le domaine à 9 km (163 x 130 points de grille), d03 1 domaine à 3 km (118 x 106 points de grille) ct cl04 le domaine à 1 km (11 x 106 points cl grille). Le point rouge indique l' -mplac ment du site cl 'ob~ervation de KES. . . . . . . . . . . . . . . . . . . . . 64
x
C.1 Analyse de surface à 1200 UTC 28 mars 2015. source : Envir onne-ment et Changement climatique Canada. . . . . . . . . . . . . . . 70 C.2 Profil v rtical de la température (ligne bleue) ct de la température
du point de rosée (lignr rouge) provrnant d'un radiosondage lancé au-dessus le KES à 1900 TC 2 mars 201 r::. . • . . . 71 C.3 (a) Température à la surface, (b) humidité relative, (c) vitessr elu
vent et
(cl
) dir
ction elu vent à KES le 28 mars 2015 provenant de l'enregi treur de données (ligne· oranges) ct de la station Alberta Environnement (lignes mauves). . . . . . . . . . . . . . . . . 72 C.4 Réflectivité mesurée à partir du Nficro Rain Radar situé au site deLIST DES TABLEAUX
Tabl .au
1.1 List of the scnsitivity expcriments
Page
27
ACR ASL BAR CTL FOR GPS KES MAP MCICA MLT MRR AK ARR CAR CEP OGRP RRTMG SEL UTC WRF
LISTE DES ABRÉVIATIO S, SIGLES ET ACRO YMES
Mod 1 run without heating due to ac rction Above Sca Lcvcl
Barrier Lak . re ·earch station Control run
Fortress Mountain
Global Positioning System Kananaskis Emcrgency Services Mesas ale Alpine Pr gram
Monte Carlo Indcpendcnt Column Approximati n Madel run without cooling due to melting
Micro Rain Radar akiska ski arca
North Amcrican Regional Reanalysis National C nter for Atmospheric Research National Centers for Environmental Prediction Madel run assuming no graupel formation Rapid Radiative Transfer Madel
Madel run without ·ooling due to sublimation Univcrsal Time Coordinated
RÉS MÉ
La phas de la précipitation affecte la ressource en cau et peut mener à d' impor-tant· désastres omm . l'inondation le Calgary n 2013 où une ligne plui -neige élevée n altitude a été l'un des principaux facteurs menant à ett inondation cata::;trophique. Le changem nts cl phas cl s précipitations traversant la ligne pluie-neige peuvent avoir un impact significatif sur le· conditions environnantes. L rcfr idi ·sem nt dû à la fonte de la neige engendre de l'air froid plus dense qui descend vers le 1 as, cc qui peut affecter la dirccti n du v nt. Il a été démontré que la ligne plui -neige de::;cend sur la pente face au vent cl 'une montagne durant une t mpête. Une inv rsi n de la dir ction du v nt de montant à descendant a aussi 'té observée à cause du refroidissement dû à la fonte de la neig . La pr 'sent étud a focalisé sur l'importance relative de la sublimation et de la fonte en utili ·ant des simulations numérique::; basées sur un 'vénem .nt de précipitation particulier observé durant une ·ampagne de mesures dans la vallée de Kananaski · en Al-berta. De études de sen::;ibilité ont été effectuées p ur examiner la relation entre l'effet de la variation de tc;mpf-rature du à la sublimation t l'écoulement dans la vallée, ainsi qu l'importanc de l'accrétion et l'impact de la formation de la n ige roulée. Les résultats ont montré que des lignes pluie-neige pcuv nt être obs rvécs à cl s températures de l'air au-dessus de 0
o
c
dans la vallée de Kananaskis en Alberta à caus du climat · c. L'effet du refroidissement dû à la sublimation t à la font a affect' le taux le précipitation et a influencé le changement de direction de 1 éc ulement de montant à descendant sur la pente en amont cl la montagne. Les simulations numérique::; ont aussi montré que la formation de la n ige rou-lée durant un 'vénemcnt météorologique a influ ncé l'inversion de la direction du vent. Le réchauffement dû à l'accrétion n altitud durant la formation cl , la neige roulée a affecté le refroidissement dû à la sublimation à plus basse altitude et a au· i influencé 1 taux de précipitation à la surface. Dans l ensemble, cette étud a démontré que le refroidissem nt cl û à la sublimation et aussi la présen e de neige roulée peuvent affecter l'intensité ct aussi la durée de la pr' cipitation, ain i que la lirection cl l'é oulement clans la vallée.Mots-clés :Ligne pluie-neige, Sublimation, Accrétion, Terrain montagneux, É ou-lemcnt dans unC' vallée, Précipitation, Microphysique
I TRODUCTION
La précipitation a un impact maj ur sur la population du sud de l' Alb rta, surt ut au printemps quand la neige fond à haute altitude. La phase de la précipitation affecte la ressource en <'au ct peut mener à d'importants désastr s comme l'inon-dation de Calgary en 2013. En juin 2013, cl fortes précipitations et la fonte rapide de la neige à haute altitude ont causé d'importantes inondations clans la partie sud de l'Alberta. Lors de cet événement, les f rtes pluies ont causé-s du ruissel -lement à basse et à moyenne altitude, mais aussi du ruissellement causé par dC' la pluie sur neige à haute altitude dû à une ac umulation tardive de neige au sol (Pomeroy t al., 2016). Les conditions à l'échelle' synoptique ont aussi joué un rôle important lon; de l'in ndati n (Milrad ct al., 2015; Liu et al., 2016). La irculation atmosphériq uc autour cl 'un système de basse pression à la surface a produit de conditions de soulèvement orographique au pied des montagn-s du sud de l'Alberta durant plu· de 36 heure·. Cet air chaud et humide a mené le niveau de gel à un plu· haute altitude lans l'atmosphère (Pom roy et al., 2016). Les tempêtes de début cl 'été amènent habituellement de la neige à haute altitude, mais dans 1 cas présent, de la plui est survenue. La pluie sur n ige cau ·éc par une ligne pluie-neige plus haute que la normale a été un des nombreux fa tcurs ayant mené à cette inondation catastrophique. Cet év/ nemcnt démontre l'importan e de bien omprcnclre 1 s cara téristiqucs et le comp rtement de la ligne pluie-neige en terrain montagneux.
La lign pluie-neige ou encore r~gion de transition est la région des tcmpêt s où l'on retrouve un mrlangc de precipitation sous les formes solide et liquide. En région montagneuse, c'est la limite entr la pluie à basse altitude ct la n ige à
2
haute altitude. La largeur de la zone de transition et le type de précipitation à l'intérieur de cette limite dépendent fortement des conditions météorologiques comme la température, le vent t l'humidité relative, car ces fadeurs peuvent être modifiés par la chaleur latente associée aux changements de phase (Stewart,
1992). Les changements de phase des précipitations traversant la ligne pluie-neige
peuvent avoir un impact significatif sur les conditions environnantes. Une meilleure compréhension des processus microphysiques et des interactions complexes ayant
lieu dans la région de ligne pluie-neige est un élément clé pour une meilleure
prévision des événement::J météorologiques extrêmes en région montagneuse.
Un des principaux processus physiques dans la région d'une ligne pluie-neige est la fonte de la neige. La fonte de la neige extrait de l'énergie de l'environnement, cc qui amène un refroidissement de l'atmosphère. Wexler et al. (1954) ont rn ntré que le refroidissement dû à la fonte peut affecter l'emplacement de la ligne pluie-neige ct une région qui recevait initialement de la pluie pourrait éventuellement recevoir de la neige. La pr~cipitation associée à une ligne plui -neige est organisée en bandes alignée::J le long de la région de transition et les précipitations qui tombent à l'intérieur de cette région sont sujettes à une plus forte agrégation (Stewart, 1992). Ces particules sont asso iées à une région où la réflectivité radar est plus fort ct est connue sous le nom de bande brillante.
Le::J premières études sur la ligne pluie-neige en région montagneu::Je ont été présen-té s par Marwitz (1983, 1987) en utilisant des observations provenant cle la Sierra Nevada en Californie. Des données de radar Doppler ont démontré que la bande brillante est descendue de 400 à 600 rn à l'approche de la pente de la montagne (Man.vitz, 1983). Des données d'observations à bord d'avion ont aussi montré que l'isotherme 0
o
c
descendait de plusieurs centaines de mètres près de la pente de la montagne (Marwitz, 1987). Ccci était causé par le processus dia ba tique de la fonte et par la dynamique associée à l'écoulement orographique. Une autre étude a3
montré que la bande brillante est descendue à une plu::; basoe altitude sur lapent face au vent dans les Alpe::; t dans la Chaîne cl s Cascades en Oregon durant trois tempête::; diff'r nte::; (Medina et al., 2005). Plus ré cmment, des simulations nu-mériques ont aussi été utili ·é ,s pour étudier l'abaissement de la ligne pluie-n ige sur la pente face au vent d'une rn nt agne ( !Iincler t al., 2011). Le refroid isse-rn nt de l'air cl û à la fonte des hydrométéores gelés le refroidissement adiabatique dû au soulèvement de l'air ct la distan e cl fonte des hydrom 'téores oont trois mé anism s physiques qui ont été identifiés dans cette dernière étude pour leur influence sur la position de la ligne pluie-neige sur la pente d'une montagne.
En plus des effets thermodynamiques cl la fonte, des cff to dynamique ont aussi été observés. Steiner et al. (2003) ont démontré avec cleo mesures de radar Doppler que le mouvement de l'air clans la vallé de la rivière Tocc dans l s Alpe· italiennes s'est inversé de montant à descendant après quelques heures de pluie durant le Mesoscale Alpine Program (MAP). Cett- 'tude a ·uggéré que l refroidi sement dû à la fonte a joué un rôle important dans la production de l'écoulement vers le bas de la vallée et que l'évaporation de la pré ipitation était de plus faible imp r-tan c. M dina t al. (2005) ont aussi bscrvé cet effet dynamique avec des données radar aéri nnes montrant un faible écoulement invcr ·é deocenclant la pente dans l ·vallées profondes cleo Alpes durant l pr gramme MAP. Asen io et St in (2006) ont eff ctué des études à l'aide d'un modèle qui étaient en accord avec l'analyse de Stein r et al. (2003), montrant que l r froiclissement diabatique ass cié à la f nte des hydrométéores était fondamental dans la pr cl uction cl l 'coulement descendant durant le programm . MAP. C pendant, Zangl (2007) a suggér' av des simulations numériqur.s que le rcfroiclisoemcnt par la fonte était de plus faible importance dans la création de l'écoulement vers le bas de la vallée pour le même événement. Plus récemment, Thériault ct al. (2015) ont effectué des simulations num'riqu s ct observé un changem nt dans la direction de l'écoulement près d'une
4
montagne de la région de vVhistler, CB, quand l'effet diabatiquc c.l la fonte de la neige était considéré. Le temps avant l'inversion de l'écoulement était beau oup plus long pour des plus petits taux de précipitation. La vitesse de dcsc nt cl la ligne pluie-neige vers le bas de la montagne augmentait avec un plus fort taux de précipitation. Cette étucl a démontré que la ligne pluie-m'ige atteignait généra-lem nt la base cle la montagne avant que l'inversion de l'é-coulement ne remplisse complètement la profondeur initiale de la couche de fonte.
Dans un environnement saturé, la fonte de la neige commence quand l'envir on-nement entourant les flocons de neige atteint la température de 0 °C. Dans des conditions sous-saturées, la sublimation de la neige prend plus d'importance ct ralentit le processus de fonte. Dans cet environnement sous-saturé, la fonte de la neige ne débute pas quand les flocons de neige atteigncnt l'isotherme 0
o
c,
mais quandTw
=
0 °C. Ccci est la température elu thcrmomètrc mouillé ct tant qu'elle est égal à 0o
c
u au-dessous, de la n ige va tomber. Dans 1 s régions où l'humidité relative est basse, de la neige peut être obs<~rvéc même à de hautes températures de l'air à la surface de 4 à Go
c
(Matsuo ct Sasyo, 1981; Harder ct Pomeroy, 2013).Contrairem .nt au rcfroidiss ment dû à la fonte, il y a cu très pcu d''tudcs regar-dant les effets elu refroidissement dû à la sublimation dans les tempêtes hivernales, plus particulièrement en région montagneu e. Clough ct Franks (1991) ont exa-miné les proccssu · d'évaporation clans des régions de précipitation frontale ct stratiformc. Ils ont démontré que la sublimation des particules cl glace était un processus th rmodynamique efficac et que même dans des conditions de faible sous- ·aturation de 5 à 10 %
,
un sublimation appréciable avait tout de même li u. Park r t Thorpe (1995) ont étudié le rôle de la sublimation de la neige sur la frontogenèse ct ont démontré que l'éc ulement tram;versal frontal clans la région de sublimation était fortement modifié. Un courant dcsccnclant à méso-échclle5
était produit som; la surface ·yn ptiquc frontale. La sublimation de la neige ct de la neige roulée a joué un rôle important dans l'évolution de la band de pluie asso iéc à un front froid qui a été modélisée dans l'étude de Barth et Par~ons (1996). L'effet de la sublimation a augmenté l'intcnsit' ct la profondeur de la masse d'air froid. Ils ont aussi trouvé que le processus de sublimation contribuait plu au r froidissement que le processus de font ..
Le typ de précipitation qui tombe a un impact sur la façon dont les particules de glac sublim nt. Quand une gouttelette cl -au liquide surfondue entre n contact avec un hydrométéore gelé, la gouttelette gèle à l'impact et produit un réchauf -f rn nt cl l'envir nnement. La parti ul solide hangcra ensuite l forme à cause elu givrage. Ces particules de neige roulée ont une plus oTandc densité que la neige et donc subliment plus lentement ( Clough t Franks, 1991; Burford et Stewart, 1998). Aussi, une plu grande vitesse terminal donne aux particules de neige roulée moins de t mps pour sublimer durant la cl sccnte par rapport à la neige. La neige roulé a par con~équ nec plus de chance cl survie n traversant la ligne pluie-neige que les dendrites par exemple.
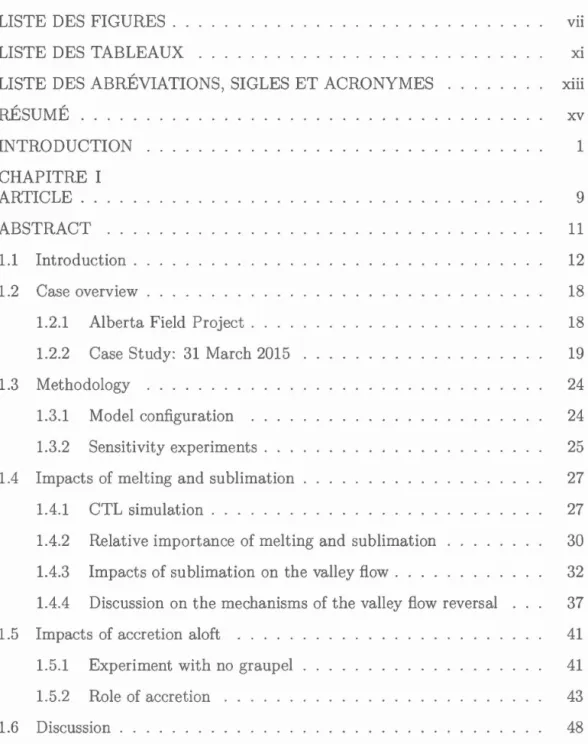
La r'gion d'intérêt de la présente étud st la vallée cl Kananaskis qui est situ'e ·ur la pente est des montagnes Rocheuses canaclienn s, 60 km à l'ou st cl Calgary en Alberta (Fig. 0.1). Comm la plupart de· régions montagneuses continental-s, le climat clans la vallée de Kananaskis varie beaucoup. Durant l'hiver, 1 climat alterne ntr des périod ~ froides et sèches, ct des périod s plus chaudes et s'ch es où le Chinook est présent, ce qui amène une large plage de températures pour cette région du sud de l'Alberta (\iVhitfield, 2014). Le Chin ok est caractérisé par un fort écoulement provenant de l'ouest qui pa~sc par-cle~su~ ks montagnes et par de l'air s c qui descend la pente est en amenant de hautes températures et un faible humidité relative dans cette région (Whitficld, 2014). L'hiver 2015 a reçu moins de pré ipitation que la normale, ce qui a mené à de plus faibles a cumulations
6 Britannique
~'"'
/ =---. ~ -J (-1
l1\t
-- - - 1 __...,., . t-, ~ 0 500 1000 1500 2000 2500 3000 3500Hauteur
[m]
7
cl ncig dans les Rocheuses canadiennes (Dcrwori:1., 2015). À cause du climat sec
présent dans la vallée de Kananaskis, la sublimation des particules de glace est ·ûrcmcnt un facteur cl minant dans cette région.
À cau cl l'importance d'améliorer notre compréh nsion cl la lign pluie-neige
dans les régions sèches, cette étude a focalisé sur l'importance relative de la s ubli-mation et de la fonte durant une étude de cas. Plus particulièrement, cette étude a
utilisé des simulations numérique::; basées sur un événement de pr 'cipitation
parti-culier observé durant une: campagne de rn sure en Alberta (Alberta Field Project) pour tenter de répondre à quelqueo-unes des questions suivantes :
E::>t-cc que la ligne pluie-n ige se retrouve à une température de 0
o
c
sur la p nte est des Roch uses canadiennes?Quelle est l'importance relative de la sublimation ct de la fonte?
Qu J ·t l'impact de la sublimation cl la neige sur l'écoulement clans la vallée?
Quelle est l'importance de l'accrétion en altitud ?
Des études cl sensibilité ont été effectuées pour examiner la relation entre le
rcfroidiss ment diabatique dû à la sublimation ct l'écoul ment dans la vallée. Aussi, l'importance de l'a crétion au-dessus de la ligne pluie-neige sur le processu de sublimation ct sur la direction cl u vent est di entée.
Le présent mémoire est organisé comme suit. Le chapitre 1 contient un arti le sei ntifiqu rédigé en anglais. La section 1.1 pr' · ntc une intr cluction au c ntexte scientifique. La sc:ction 1.2 présente une vu d' nsemblc de la ampagne de terrain
effectuée au printemps 2015 ct décrit l'étude de ca· utilisée dans cette étude. La
méth clologic utili::>éc dans la configuration elu modèle numérique et les études
de sensibilité sont expliquées dans la section 1.3. Les résultats de la simulation
contrôl-, l'importance relative de la fonte ct de la ublimation ainsi que les effets
8
et de la neige roulée sont résumés dans la section 1.4. Les effets de 1 'accrétion et de la présence de neige roulée sur le refroidissement dû à la sublimation t à la fonte ainsi que sur la dire ·ti on cl u vent s nt C'xaminés dans la section 1.5. Une
discussion est fournie à la section l.G ct les conclusion::; sont ré::mméC's à la section 1.7.
CHAPITRE I
ARTICLE
A study of rain-f:mow transitions in the Kananaskis valley, Alberta
Émilie Poirier
Université du Québec à Montréal, Montréal, Canada
.Julie M. Thériaul t
niv rsité du Qu'bec à Montréal, M ntréal, Canada
ABSTRACT
The phase of precipitation affects water resources and this can lead to major disasters such as the Calgary 2013 flooding event where an el vated rain-snow boundary was one of the main factors that led to the catastrophic flooding. Th phase changes of pr cipitation falling through a rain-snow boundary can have a
significant impact on the nvironmental conditions. Cooling by melting f snow gen rates cold dense air that maves down, which can affe t the wind direction. It has been shawn that the rain-snow transition is lowering on the windward slope of a mountain during a storm. A reversai in the wind direction from up-vall y to d wn-valley was also observed as a result of cooling by melting of snow. The present study fo used on the relative importance of sublimation and mel ting using numerical simulations ba ed on a particular pr cipitation vent observed during
the Alberta Field Project in the Kananaskis valley. Sensitivity experiments were used to examin th relationship betwe n the temperature f dba ks from s
ub-limation and th valley flow field along with the importance of accretion and the impacts of graupel formation. Th r sults show d that rain-snow boundaries can be observed at surface air temperatures above
o
o
c
in the Kananaskis valley, Alberta due to th dry climate. The cooling effect of sublimation and meltingaffected th precipitation rate and influenced the change in flow direction from upslope to downsl pe on the w st facing slope of the mountain. The numerical simulations also showed that the formation of graupel during th w ather event influ ne d the wind direction reversai. The heating due to accretion aloft during
the formation f graupel affected th cooling due to sublimation at lower alt i-tudes and also influ nced the pr cipitati n rat at the sm·fac . Overall, this study
showed that cooling due to sublimation and also the pre ence of grau pel can affect the intensity and also the duration of precipitation, along with changing the fi w direction in a valley.
Keywords: Rain-snow boundary, Sublimati n, Accretion, Complex terrain, Val
12
1.1 In troc! uction
Precipitation has a major impact on the population of southern Alberta espe ially
during the spring seas n when snow melts at higher elevation, causing runo:ff into
rivers. The phase of pr cipitation a:ffe ts water resources and this can lead to major disasters su ch as the Calgary 2013 fl.oocling event. In la te June 2013, heavy
rainfall and rapidly mclting alpin . snow causecl fl.oocling to the southcrn part of
Alberta. In this particular event, the hC'avy rain g<'nerated rainfall runo:ff at low and middle elevations, but it was supplemented by rain- n-snmv runo:ff at high elevations clue to a la te lying snowpack (Pomeroy et al., 201 G). The synoptic
scale atmospheric conditions also playecl an important role in thr fl.oocling event (Milracl et al., 2015; Liu ct al., 2016). The circulation arouncl the surface l
aw-pressure system produced upslope conditions over the southern Alberta foothills
that persistee! for more than 36 hours. This air was moist and \Varm which led
to a high freezing level in the atmosphere (Pomeroy et al., 2016). Early summer
storms usually bring alpine snowfall at high elevations, but in this 'ase rainfall occurrecl. The rain-on-snow causee! by a higher than usual rain-::mow boundary was one of the many factors that l ad to this catastrophic fioocling. This event
illutltrates the importan of understancling the ·haracteristics and behavior of the rain-snow bounclary in mountainous rC'gions.
The rain-snow bounclary or transition region itl the region of a storm character -ized by mixee! prC'cipitation. In mountainous region::l, it is the bounclary between rainfall at low elevations and snowfall at higher elevations. The width of the
tran-sition region and the precipitation type distribution within that bounclary depend
strongly on the weather conditions such as temperature, wind field and relative humidity bC'cause these could be al te red by the lat nt heat ass ciatecl with phase change::l (Stewart, 1992). The phase changes of particles falling through
therain-13
snow boundary can havr a significant impact on the cnvironmcntal conditions. Understanding the cffcct · of th microphysical proces:::;cs taking place in the vi cin-ity of a rain-snow b undary i · a key clement to a bettcr forccasting of extr me met-orological events in mountainous regi ns.
One of the key physical proccsscs within thc rain-snow l ounclary is the mclting of falling snow. M lting of sn w extra ts energy from the cnvironment, which lcads to atmosp heric cooling. W cxlcr ct al. ( 195t!) first not cd th at cooling by melting an affect the location of th . rain-:::;now boundary and an arca initially re iving rain will v ntually rccciv ·now. The pre ipitati n associatcd with a rain-sn w boundary is typically organiz-d into bandee! fcaturcs aligncd along the transition region and particle:::; falling through this region would be subjcct cl to enhanced aggregation (Stewart, 1992). Thesc particlcs ar asso iated with a r-.gion of enhanced radar rcfl.e tivity known as the radar bright band.
Some of the earliest studies on rain-snow transitions in mountainous ar as wcrc pres-nted by Marwitz (1983, 1987) using observations over the Si rra evada. Doppler radar data showccl that the bright band bcgan to increase in depth to 400-600 m whil approaching the mountain barrier (Marwitz, 19 3). Also, in situ aircraft data showed that the
o
o
c
isothcrm cl s ·ended several hundrcd m ters near the barrier as a result of the diabatic process of mel ting and the dynamics of orographie airfl.ow ( 1arwitz, 1987). Another study notee! that the bright band f 11 to a 1 wer hcight ovcr the windwarcl slopes in the Alps and the Oregon as ade Mountains during thre different alpine storms (Medina ct al., 2005). More rc -cently, numerical simulation wcrr. also uscd to stucly the lowering of the rain-snow boundary on a mountain windwarcl slopc (Mindcr ct al., 2011). The cooling of th- air by melting of frozen hydromctcors, the adiabatic cooling of rising air and the mclting distance of hydrometcors wcr identifiee! as thr c physi ·al mcchanisms infl.ucncing th location of thc rain-snow boundary along the mountainsidc.14
Besidc the thcrmodynamic effccts of mel ting, dynamical fcccll acks have also becn
observcd. teincr et al. (2003) showed with Doppler radar mea::;uremcnts that the air motion within the Tocc river valley in the Italian Alps cl uring the Mesoscalc
Alpine Program (MAP) reversecl from up-vallcy to clown-valley flow aftcr a fcw
hours of rain. This study suggcstccl that cooling by m Jting of ::;now played an
important role in gencrating the clown-valley flow and that evaporation of prec ip-itation was of le s importan ·c. Medina ct al. (2005) also obsrrvccl this clynamic effect with airbornc radar data showing a wcak and reversee! clownslopc flow in
the de p vallcys of the Alp · cluring the MAP program. Thr results of the moclcl experiments of Asencio and Stein (2006) wcr in agreement with the analysis of
Steiner ct al. (2003) that the cliabatic cooling associat .cl with the mrlting f falling
frozcn hyclrometcors was funclamcntal in gcnerating the clown-vall y flow during
thC' MAP program. I-Iowevcr, Zangl (2007) sugg steel with numeriéal simulations
that the cooling by mclting f snow was of lcss importance in creating the dow
n-vall y flow for the same event. More rcccntly, Thériault ct al. (201G) pcrformccl
numcri al simulations and obs rvcd a 'hangc in the valley flow fi le! direction near a mountain in the Whistler, BC arra whcn the diabatic cflcct of mclting snow was consiclcrcd. The timc to procluce the flow reversai was much longC'r for
lowcr precipitation rates. The spcccl of the rain-snow bounclary trav ling clown
the mountain also incrcasccl with highcr precipitation rates. This stucly showed that the rain-snow bounclary gcncrally reachcs the base of the mountain bcforc
the flow reversai ha· complctely filled up the initial drpth of the mel ting layer.
In a saturatcd environmcnt, the melting of snow starts whcn the cnvironmcnt
surrounding the snowflakcs rcach a tempcratur of 0°C. VVithin ::;ubsaturatecl co n-ditions, the sublimation of snow bccomcs of greater importance and thus slows
clown the mclting proccss. In a subsaturated environmcnt1 the mclting of snow does not start whcn the falling snowflakes reach the 0°C isothcrm, but rather whcn
15
Tw = 0°C. This is known as the wct-bulb temperature and as long as it is cqual
to 0°C or bclow, snow will fall. In rC'gions of low relative humidity, snowfalls can
be seen ev n at high surface air temperature of 4-6° (Matsuo and Sasyo, 1981;
Harder and Pomeroy, 2013).
Unlike cooling by melting, there ar f w studi s addressing the effects of cool
-ing by sublimation in winter storms, especially in mountain us regions. Clough
and Frank· ( 1991) examined the vaporative pro e ·ses in frontal and stratiform
precipitation. They show cl that sublimation of ice particles wa · an fficient
ther-m dynather-mi proces · and in low ubsaturation of 5-10%, appreciable sublimation
can still take place. Parker and Thorpe (1995) studied the rol of snow subli ma-tion on frontogenesis and show d that th- cross-frontal fiows in the vicinity of the
sublimation were strongly modified. A mesoscale downdraft was produccd bclow
the synopti frontal surface. Sublimati n of snow and graupel played an impo
r-tant role in the evolution of th narrow cold-frontal rainband that was modeled in the study of Barth and Parsons (199G), as it increas d the intensity and depth
of th cold air mass. They also found that the sublimation pr cess contributed
more to the lat nt cooling than th meltin ·· process.
The type of precipitation falling has an impact on the sublimation process. When
a supercooled liquid droplct bits a frozen hydrometeor, it freezes upon impact and
th us prod uces h ating of the nvir nment. Th . solid particle will thon change shape due to riming. Thesc graupel particles have a highcr density than snow
and thus they sublimate slow r (Clough and Franks, 1991; Burford and Stewart,
1998). Also, a higher terminal vclocity will give the graupel particles less tim
to sublimate during lcsccnt, as in the case of snow. Graupel consequently bas a
greater chan e to reach the surface while traveling through the rain-snow boundary
16 55°N 50°N 0 500 1000 15CO 2000 2500 3COO 3500 800 Height [m] 1 km Domain 1200 1600 2000 2400 2800 Height [m]
Figure 1.1 Area of interest and 1 km mesh domain in Vv'RF model.
The area of interest for this stucly is the Kananaskis valley, which is located on the ea. t rn side of the Canadian Rocky Mountains, 60 km west of Calgary, Alb rta (Fig. 1.1). Like n10st n10untain regions in continental arcë)as, the h ananaskis valley climate is highly variable. ln the winter, the limate alternates b tween colcl, dry periods and pcriods of comparatively wanu, dry, windy Chinook air, which givcs
to the general ar a of southwestern Alberta a large winter temperatur range (vVhitfield, 2014). The Chinook is characterized by a. strong westerly ftow over
the mountains and dry air descending the lccward sidc which brings both high
temperatures and low humidity to th a.rea (Whitfield 201Ll). The winter 2015 rcceived lower than average precipitation in this arca, which led to a shallovvcr
than usual snowpa ·k in the Cana.dian Rocki s (Derwori:6, 2015). Due to the dry
climate iu the Kananaskis valley, the snbliruation of icc particles is likcly to be a
dominant factor in this area.
17
within relatively lry ar as, this study focused on the relative importance of s ubli-mation and mclting during a case study. In particular, this study usecl numerical simulations based on a particular pre ipitation event observed during the Alberta Field Project, to help answer sorne nf the fnllowing ·cientifi questi ns:
Do rain-snow transitions ccur at 0° on the le side of the Canadian Rockies? What is the relative importance of ·ublimation and mclting of snow and graup l? What is the impact of snow ·ublimation on the valley fiow field?
What is the importance of accretion aloft?
S nsitivity experiments were p rform cl to examin the relation between the te m-p rature feedba ks from sublimation and the valley fiow field. Also, the impo r-tance of accr .tion abov. th rain-snow boundary on the sublimation proces · and on the wind direction is discussed.
This paper is structured as fnllows. Section 1.2 provid s an overview of th field campaign performed in pring 2015 and cl scribes th case study used in this paper. Th methodology us cl in the model configuration and the ·ensitivity experim nts is explained in ection 1.3. Results from the control simulation, the r lative importance betwe n melting and sublimation along with the eHects of suppressing diabati cooling elu to melt.ing and sublimation of snow and graup
1
are summarized in Section 1.4. The eHects of accretion and graupel on the coolingassociated with sublimation and melting along with the eHects on wind direction is examinecl in Section 1.5. A discussion is provided in Section 1.6 and finally s rn concluding remarks arr given in Section 1.7.
1
1.2 Case ovcrvicw
1.2.1 Alberta Field Pr jcct
The field campaign Alberta Field Project was a collaboration of rcsearchers in-tc'rcstccl in the stucly of spring precipitation on the castorn siclc of the Canadian Rockics. The campaign took place cluring March-April 2015 in the Kananaskis
valley, Alberta. The goal· of the fi Id campaign wcrc to study the rain-snow bounclary, the snow crystal types, along with the charactcristi .s of precipitation and the associatcd weathcr conditions in the valley.
Most of the observations werc collected at the Kananaskis Emcrgency Services (KES) site just a fcw kilomctcrs south- ast of the Nakiska ski arca ( AK) and
about 15 km south of the Barrier Lake rcscarch station (BAil) (Fig. 1.1). Dctailccl mctcorological and photographie mcasurcmcnts wcrc collcctcc.l at the main sit . Instruments pre ·cnt in ludccl a Gconor precipitation gaugc, a sounding system, an OTT Parsivel op ti cal disclromctcr and a Micro Rain Radar (MRR). Basic mc -tcorological mcasurcmcnts wcre also available (pr s ure, winds, temperature, clew point temperature). Visual observations and high-resolution snowflakcs macro -photography wcrC' taken as wcll to chara terize the type of snow as in Gibson
and Stewart (2007). Vertical profiles of basic metcorological fcaturcs werc also
obtain cl using a Kcstrel attachccl to a ski pole and a GP at t\vo othcr sites in the presence of rain-snow transitions. Thcsc vertical profile::; wcre perf rmccl at AK and also at Fortrcss Mountain (FOR). The mcthocl followcd the one uscd in Thériault ct al. (2014).
The forecasting of the different storms c.luring the fi lei ampaign was esp cially
challcnging bccaus mo 't of the precipitation falling was isolatcd cv0nts that wcrc
not nccessarily pro cl uced by typical lmv-prC's::;ure system locatccl on the lcc-side of the Rockics. Precipitation falling at the surface was very irrcgular through
19
th valley. Sometimes, an appr ciablc accumulation was obscrvcd during a storm ncar Barrier Lake, while only a trace was rcported at th KES obs rvation site. It depended highly on th direction of the mesoscale flow lcacling to up~·>lope
flow (Vaquer, 2017). Rain-sn w bounclarics wcrc also oft n obscrvcd along the mountainside.
1.2.2 Case Study: 31 March 2015
On the last day of March, a weather event associated with a rain-snow boundary along the mountainside occurrcd in the Kananaskis vall y. A 1 w pressure system moving t the east was lo 'atccl north-cast of the Kananaskis vall y at 0000 UTC 1 April 2015 (Fig. 1.2). The data loggcr and th Alberta Environment weath r stati n located 100 rn from each other at KES indicatecl a dccr a e in surface temperature starting at 2100 UTC 31 March 2015 from 12°C to 3°C (Fig. 1.3 a). An increase in the dew point temperature was also seen starting at 2000 UTC. The wind speed was b tween 2-3 m/s from 1900 to 2100 UTC and startcd to decrease un til 0000 UTC (Fig. 1.3 b). The Alberta Environment w ath er tation indicated an increase in the wind sp ed at 2200 UTC to 4.o m/s while the data logger showed lower wind sp-cd. The Alb rta Environment weath r station provided hourly data whil the data loggcr providcd 1-min data, which could cxplain the cliff rene at this time. Manual obs rvati ns at the KES site show cl light rain starting at 2030 UTC 31 March 2015, changing t a mix of rain, snow and grau pel, th en to a brief period of snow only (Fig. 1.3 c). A vertical sounding launched at 2100 UTC showed clearly ::Jubsaturated ondition near the surface at the KE site (Fig. 1.4).
During this mixed prccipitati n event, the rain-snow transition wa lo atcd at the base of the mountain. A car souncling pcrformcd at FOR indicated that the top of the rain-snow bounclary was at an alti tu le of 1830 rn ab ove sca levcl (ASL) at
20
Figure 1.2 Surface analysis at 0000 UTC 1 April 2015. source: Environment and Climate Change Canada.
15
10
u
5
0
-5
5
4 .---. ...3
1 li)E
2
1
0
Grau pel Snow Ra in(a)
-
-
-
-
-
-
-
; .. - ----
,. - - , •• ,...
1,,,
....
1900
2000
2100
2200
Time [UTC]
Temperature Dew Po1nt2300
0000
21Figure 1.3 (a) Surface temperature (solid line) and clew point temperature
(clashed line), (b) wincl speecl and (c) precipitation types ob ervecl at KES. Data are from the data logger (orange). the Alberta Environrncnt weather station (p
22 (() 0.... ...c 300 '----' 400 Q) L ::J lll ~ 500 L 0.... 600 700 800 90_250 -40 - T sounding - • Td sounding - TWRF • • Td WRF -30 -20 - 10 0 10 20 Temperature [ 'C]
Figure 1.4 Temperature (solid line) and clcw point temperature (clashccl linc) v rtical profiles at 2100 UTC 31 Mar h 2015 above the KES site. Both the souncling laun hecl (blue) and the control run (black) describecl in section 1.3.1 arc shown.
2.6~~~~~--~--~----~~~--~ 'E2.4 .Y
::; 2.2
lf) <( 2.0 4-.J ...c -~ 1.8 Q) I 1.6 2030 2100 2130 2200 2230 Time [UTC] 2300 31.5 28.0 24.5N' 21.0~ 17.5..._. Q) 14.0N 10.5a::
a::
7.0 ~ 3.5 0.0 23Figure 1.5 Refiectivity measnred by the Micro Rctin Radar at the KES site on 31 March 2015.
2115 UTC and lowered to 1750 m ASL at 2200 UTC. The KES site b ing located at an altitude of 1445 m ASL, the thickness of the rain-snow bonndary varied
between 300-4.00 m ac :ording to manual observations. The refiectivity fi·om the MRR located at KES sbowcd the presence of a bright band (maximnm rcficrtivity) at around 2200 TC (Fig. 1.5). The top of the bright band wa.s at a height of
2 km ASL, which is however, at a slightly higher altitude than in the manual
ob ervations and simulation ..
In the following sections, tlw results of the numcrical simulations for this stndy
24
1.3 Mctbodology
1.3.1 Moclcl configuration
The simulations in this stucly wcrc pcrformcd using th<' Wcather Rcsearch and Fore asting (V/RF) modcl, version 3.7.1 (Skamarock ct al., 2008). Thrcc -dimensional (3D) simulations wcrc uscc.l with initial and bounclary conditions pro -viclcd by the orth Amcrican Regional Rcanalysis ( JARR) data from the ational
Centcrs for Environmental Pre liction ( CEP) (Me::;inger ct al., 2006). Two-way nc::;ting with four ncst d grids (27 km, 9 km, 3 km and 1 km) was uscd to pcr-form high-rcsolution simulations over the Kananaskis valley. The high-rcsolution domain is shawn on Figure 1.1. The control run and the scnsitivity tests wcrc clone using tlw two-moment version of tho Milbranclt and Yau bulk microphysics schemc (Mil brandt and Y au, 2005). This micropbysics sclwmo prcc.licts the mass mixing ratio and total number concentrati n of six bydromctcor categories: cloud droplets, rain, icc crystals, snow, graupcl ancl bail. Somc modifications werc made to the Milbrandt and Yau microphysics scbcm<' to gct snow sublimation at tem -peratures abovc and below 0°C. The differences are dcscribecl in Appendix A.
Otbcr microphysical parameterizations u::;ecl in the simulations includccl the Rapid Radiative Transfcr Modcl (RRTMG) witb the Monte Carlo Incl pendent Column Approximation (MCICA) mcthod of random cloud ovcrlap schcmc (Iacono ct al., 2008) for longwave and shortwavc radiation. Also, tlw Noah Land urfac M ciel (Tcwari et al., 2004) with soil temperature and moisturc in four layer::;, fractional
snow covcr and frozcn soil physics wa · us cl. The planctary boundary lay r was parametcrizecl in the simulations with the Yonsei Univcr::;ity scheme wbich us s the non-local K approach with an explicit entrainmcnt layer and a parabolic K profile in the unstablc mixcd layer, whcre K is the vertical diffusion coefficient (Hong ct al., 2006). ,umulus parametcrization was us cl on the coarscr grid only
25
(27 km) with the Kain-Fritsch s ·herne (Kain, 2004).
To obtain a maximum number of vertical lev ls within the melting layer, G6 ver-tical levels have been usecl where the gricl spacing vari~d from 50 to 350 rn in the first 2 km and was about 3GO rn at highcr lcvels. The simulation on the coarser grids (27, 9 and 3 km) started at 1500 UTC 31 March 2015, 3 h urs prior to the high r resolution grid (1 km), which started at 1800 TC 31 Mar h 2015. The simulations were integrated for a total of, respectively, 12 h and 9 h. The time step u ·ed was 90s on the coarser grid (27 km) d creasing \vith a ratio of 3 betwe n each n st d grid to 3.33 s on the higher r solution gri l (1 km).
1.3.2 Sensitivity expcriments
':G estimate the temperature feedbacks ass ciat d with melting and ·ublimation, the ontrol simulati n (CTL) was first run while neglecting the latent heat du to the rn lting of snow and grau pel (MLT). Th -.n it was neglected for th sublimation of snow and graupel (SBL). The temperatur tendency equation from Milbranclt and Yau (2005) is: dT
dt
1 lit liQCLcs+
liQCLcg+
liQCLch+
liQCLTi+
liQCLTs +liQCLTg+
liQCLTh+
liQFZci+
liQFZTh - liQJVJ Lir - liQl'vf LsT- liQNJ LgT- liQM Lhr+
Ls ( liQJVUvi+
liQV Dvi+
liQV Dvs+
liQV Dvg ) Cpd +liQV Dvh (1.1) whereL.r
is the latent heat of fusion, L8 is the latent heat of sublimation, Cpd is the specifie heat of dry air and Q is for mixing ratio. The types of mixing ratios are26
notcd by CL for collection, F Z for freezing, ML for mel ting, U for nuclcation,
V D for diffusional growth (positive) or sublimation (negative) and the subscripts (c, 1·, i
s,
g, h,v)
rcprc nt cloud droplcts, rain, icc, snow, graupcl, bail ancl water vapor.In the MLT expcrimcnt, the sink tcnns QJI![ Lsr and Q.~![ Lg1· \Vere ncgl cted in Eq. 1.1. Accordingly, the negative portion of the tcnns QV Dvs and QV Dvg wcre also ncglectcd for the SBL cxpcrimcnt. These expcriments wcrc usccl to
show the impact of the temperature feedbacks from mcltinh or sublimation of snow and graupcl sincc thcse two microphysical pror.esses can induce a cooling of the cnvironm nt.
To asscss the impact of accretion aloft and also the impact of the prescnc J of riming (graupel) on the sublimation occurring at low r altitudes, the CTL simulation
was also run with no grau pel ( OGRP). In the last cxpcrimcnt, a simulation
was donc to determine the temperature fccdbacks associatcd with the heating duc
to ac rction ab ove the rain-snow bounclary (ACR). In this last simulation, the
lat nt beat clue to the following pro cesses was neglectcd in Eq. 1.1: coll cc ti n of
cloud clroplcts with snow or graupcl particles (QCLcs, QCLcg) and ollcction of
rainclrops with i e, snow and graupcl particles (QCLTi, QCLrs, QCL1·g). Thcsc
different pro cesses arc usecl in the scheme to pro cl ucc grau pel. In the ase of accretion, a hcating of the environment is procluced at high altitude and this expcriment will asscss the impact of the temperature feedbacks. The sink tcrms
ncglectcd from the temperature tenclency equation in the Milbrandt and Yau schcme for each cxperimcnt arc listed in Table 1.1.
27
Table 1.1 List of the s nsitivity expcrimcnts
1 Experiments 1 Sink Terms Description
CTL - contr 1 simulation
SBL QV Dvs(-), QV Dvg(-) no cooling .ffect from sublimation
MLT QMLsr Q1'v1 Lgr no cooling effcct from mclting
ACR QCLcs, QCLcg, no heating ffcct from ac retion
QCLri, QCLrs, QCLrg
OGilP - no graupel
1.4 Impa ts of melting and sublimation
1.4.1 CTL simulation
The weather conditions in the CTL simulation wer first studied and compared to orne obs rvations at thC' KES ite to cnsurc that atmospheric conditions wcre well r produced by the numcri al simulations. Figure 1.6 shows pre ipitation ac-cumulation from 1800 UTC 31 l'v1arch 2015 to 0000 TC 1 April 2015 in the Kananaskis arca. The CTL run showed accumulation of rain in th vall y and s lid precipitation (snow and graupel) at high r levations. The accumulatcd pre-cipitation simulat.cd at the KES site was slightly higher than the amount recorded in th observations. The rain gauge located at KES site indi ated pr cipitation accumulations of 1.2 mm whilc the model showcd accumulation betwccn 1.5 and 2 mm. The Kananaskis wcath r station from Environmcnt and Climate Change Canada located near Barrier Lake recordcd, however, rain accumulation of 2.4 mm for the day of 31 Mar ·h 2015 whil the model show cl n accumulation in this area. Both th vertical pr filrs from the CTL run and the sounding launched at KES at 2100 TC 31 March 2015 indicatcd that. the air was ub ·aturat.ecl n ar the surface (Fig. 1.4).
28 35.0 25.0 15.0 8.0 E 4.0 E 2.5 1.5 0.5
Figure 1.6 Precipitation accumulation from 1800 UTC 31 March 2015 to 0000 UTC l April 2015 for (a) rain and (b) snow and granpel.
\iVhile the precipitation arnount accumulated at KES was rclativcly low during
this vent, a study of the different pre ·ipitation types for the CTL run showecl a high amount of snow at high altitudes. Figure 1. 7 illustra tes the time evolution of rain, snow and graupel rnixing ratio for the CTL run at KES site. Resnlts showed that snow and graupel melted into rain starting at 2100 until 2230 UTC.
The presence of a rain-snow transition between 2100 and 2230 UTC in the CTL run is of particular interest since this transition was well-observed in the field. A
significant drop in th height of the 0°C isotherrn at aroun l 2115 UTC can be scen in the CTL run at the same timc the ra,in-snow boundary was present a,t the surfac . Figure 1. 7 also reveals that the rain-snow transition was located more
than 200 m below the~ 0°C isotherm, which confirms the presence of a non-mclting layer just a.bove t.h height where ~v
o
o
c
;-"Ls cliscussed by M<1.tsuo ancl Sasyo ( 1981 ).Both the manual observations at KES site and the CTL run confinned that snow was present at a temp rature of 3°C at aronnd 2200 t:TC. The fH.ct that snow wa.s
2.6
_§
2.4:::7
2.2 L/1 <( 2.0 .j...l ~ 1.8 Q) I 1.6L_ ____~----~~~~
~~~~~
~~----
~
2. 6 , - - - - . r - - - - ._ , -- ,_§
2.4:::7
2.2 L/1 <( 2.0 .j...l ~ 1.8 Q) I 1.6 ---. __ I~~o-ç
_
L _ _ __ _ ~~~==~~~~~----~----~ (c) Rain 2.6,---~---~~----~---~---~_§
2.4:::7
2.2 L/1 <( 2.0 T=O C.:c
O'l 1.8---- ...
~ 1.6
~----~~
~tt~
'~
,~
-~
-
~
-~
-~
-~
-~
-~
-~
-~
-
~
-
~
-
~
-
~
-
~
-
~-
~-
~-
~
-
-
-
_rw~
-
=~
-
o~;-ç~
-2030 2100 2130 2200 2230 2300 Time [UTC] 0.0 0.5 1.0 1.5 2.0 2.5 3.0 3.5 Mi xi ng Ratio [kg kg 1 ] le-429
Figure 1.7 Time evolution of (a) snow, (b) g,Tanp 'l and (c) rain mixing ratio at the KES site on 31 Ma.rch 2015 for the control nm. The solid line indicates the height of the 0°C isotherm and the dashed line indicatcs the height where the wet-bulb temperature is 0°C.
30
pr ,sent at the ::;urface at temperatures above
o
o
c s
upports t.hc theory of Mat::;uo and Sasyo (1981) that the precipitation type at thC' ::;urfa ·e depends strongly on rC'lative humidity and air temp< rature.The top of the rain-snow bounclary ::;imulated by the moclel was around 1. km ASL at 211S UTC and lowerecl to an altitude of about 1.7 km ASL at 2200 UTC.
The car ::;ouncling performecl at Fortress Mountain during this period indicatecl
a ::;imilar height of the top of the boundary. The rn a.sured width of the rn !ting layer clroppcd from 250 to 1SO rn from 2115 to 2200 UTC.
The results of the CTL run ·onfirmed that snow ca.n be SC'en at tcmperatur ::;
a.bove
o
o
c
in the Ka.nana ·ki· area and that the rain-'l10w boundary occurr cl ata warmcr temperature tha.n whcn the environment is saturated. Comparison::;
be-tween observations and the CTL run indicatecl tha.t the weather conditions in the Kanana.ski::; Valley on 31 Ma.rcl1 2015 were weil rcproducccl by the mode!, since a ra.in-snow bounda.ry was present bctwcC'n 2100 and 2230 UTC 31 March 2015, as obsC'rvc l. ow that the w athcr conditions at the KE sit arc rclativcly w Il rcp-r sented for the ase study, the remaining analy::;i::; will focu::; on the microphysical processcs in the vicinity of the transition region dcscribed above. Since snow was present a.t temperatures a.bove o
o
c and t
hat the air wa.::; ::;ubsatura.tecl, ::;ublimation may be important cl uring this timc a::; weil as rn ltin_g;, which was limitcd to a thinlayer near the surface.
1.4.2 Relative importance of melting and sublimation
To assess th relative importance of mel ting and sublimation on the cnvironmcntal
temperature, the impact of the sink tcrms in Eq. 1.1 werC' evalua.ted ::;epara.tely
( QV Dvs and QV Dvg for sublimation of ::;now and ?;rau pel; QJVI Ls1· and QM Lgr
for mel ting of sn w and grau pel). The evolution in timc of dT/ dt for ::;nblimation and mclting of snow and grauprl is rcprescntcd in Figure 1.8. The cooling cffcct
(a) Meltin 2.6~---~---~~----~~----~---~ 'E2.4 .:y_ :;'2.2 lf) <( 2.0 -1-1 .r:. .~ 1.8 Q)
:r::
'E2.4 .:y_ :;'2.2 lf) <( 2.0 -1-1 .r:. .~ 1.8 Q):r::
1.6 ~ -6 -3 T=O C '---- -~-•••• _---- -- • - __ .T,YV_=_O_ Ç _ _ T=O C 2300 0 3 6dT/dt [
.,
C/hr]
31Figure 1.8 Cooling rate
(dT
/
dt)
a.ssociated with (a) mel ting and (b) sublimationof snow and graupel above the KES ite on 31 Ma.rch 2015 for the control run. The
solid line indicates the height of the 0°C isotherm and the dashed line indicates the height where the wet-bulb temperature is 0°C. The red color inclicates an area
32
of mclting is confinecl within the melting layer near the surface, which is locatecl where the w t-bulb temperature is above 0°C. Furthermore, the cooling effect of the sublimation of graupel and snow an be ·ccn up to a hig;her altitude since that proc ss can take place at any temperatures. In particular, Figure 1.8 shows that
cooling due to sublimation of sn w and graupel is greater near the non-mclting
layer located between
T
=o
o
c
andT
w
= 0°C. This is consistent with the fact that the latent heat of :::;ublimation i:::; seven times higher than the latent heat of fusion. Results from this subsaturated case study suggestecl that :::;ublimation of snow andgraupel had a greater impact on the environmental temperature compared to the
mclting process.
1.4.3 Impacts of sublimation on the valley flow
To stucly the impacts of phase changes on the valley flow, two sen:::;itivity tests
were conducted. First, the MLT experiment was conclucted by removing the effect of melting of snow and grau pel in the temperature tenclency from the CTL run, as shown in Table 1.1. Second, the SBL experiment wa:::; conduct cl in a
similar manner by removing the effect of sublimation of snow and graupcl in the
temperature tendency.
The SBL experiment :::;hmvecl that the precipitation rate at the :::;urfacc for rain
was higher than in the CTL and MLT runs, especially at 2140 UTC (Fig. 1.9 a).
The snow and graupcl rates were, however, lower in the SBL run, except from 2130 to 2145 UTC, when the graupcl rate was higher. Relative humidity was low~r in the SBL run before 2140 UTC, but after the peak in rain precipitation,
the relative humidity wa:::; similar to the CTL and the MLT run:::; between 70-80%
(Fig. 1.9 b). The
o
o
c
iso th rm was higher in the SBL exp riment for the who leperiod while the rain-snow bounclary was present at the surface (Fig. 1.9 c). The
4 ...__ ..c
Ê
3 E ';2 ..., ro a: 1 90 80 'èf!. 70 I 60 a: 50 2.3 2.2 2.1 E ~ 2.0 _ j (./) 1.9 <t ..., ..s:: 01 <ü 1.8 I 1.7 (b) 2150 2200 Time [UTC] 33 ra1n snow graupelFigure 1.9 Tim volution of (a) the precipitation rate and (b) the relativ .
humidity at the sm·face, along with ( c) the t mp 'rature, wind speed and wind direction above the KES site on 31 March 2015. These r sults are for th control
run (black line), th ruu without th cooling effects of sublimation (blue line) and the rnn withont th cooling effecto of melting (ormge line). The gray area in (c) is the region where the rê1.in-snow boundary is located.
34
1.10 a an l b). The height where
Tw
=o
o
c
was bigher in the SBL experiment than in th CTL run cluring the timc when precipitation rcachcd the surface andmore melting resultee! near the surface producing more rain (Fig. 1.10 c).
Neglecting the c oling clue to sublimation in the 'BL run resulted in a higher temperature at bath the surface and aloft (Fig. 1.9 c), because sublimation oc
-currecl within a thicker layer compared to mclting, whi h i::; ncar the surface (Fig. 1.8). This higher temperature aloft in the SBL run increasC!d the quantity of snow and graupel and the r sults uggested that vapor deposition was more effective. In mixed phase clouds, when tho air temperature is bclow -12°C, the difference
between saturati n vapor pressure over water and saturation vapor pressure ovcr
ice incrcases with increasing temperature (Pruppacher and Klett, 2004). This is
tho basis of the vVegener-Bergrron-Findeisen mechanism. The icc crystals grow
by vap r diffusion at th- expen::;e of the supercoolccl watcr drops. Consequently, moro water vapor was available, which produced more icc crystals and eventually moro snow. This ::;now interacted with the loucl dr plet::; to form more graup l which was sccn in Fig. 1.10. Besicle the higher amount of sno\V and graupel, more ice particles and fewer cloud droplets were pres nt in the SBL run whilc there was
less wator vapor in the atm sphere just bcfor 2130 UTC. Sincc the
Tw
=o
o
c
isotherm was highC!r in the SBL experiment, mclting occurrccl on a thicker layer betwcen 2130 and 2230 TC and th us pro cl ucing a higllC'r rain rate at the
sur-face. Rcsults from thr scnsitivity experiments confirmccl that sublimation of snow
and graupcl bad a larg-r impact on metcorological parametcr::; ::;uch as tempera
-turc, relative humi lity an l precipitation rate during the presence of the rain-snow boundary ompared to melting.
Figure 1.9 c ·hows tho wincl spced, wind direction and the air temperature at the
KES site for the CTL, the MLT and the BL run::; bctwoen 2110 and 2245 UTC. The impact of sublimation and melting on the temperature and horizontal wind
2. 6. - - -
-_ê
2.4 :; 2. 21---(/) <{ 2.0 +-' .c ---- .. . ~ 1.8 ... ... -QJ I 1.6 2. 6 , - - - -- ---, E 2.4 .:::,t, :; 2. 2
f---
--t/) <{ 2.0 +-' ...c - - - - ... . ~ 1. 8 ... - ... - - .. QJ I 1.6 T=O C - - - ... - .Tlt'J
....
=O C ... 2.6,---~~----~---.---~_ê
2.4 :; 2.21---..
(/) <{ 2.0 0c
+-1 ..c ... --... .. -~ 1. 8 ... - - - .. *' .. , , ... QJ I 1.6 "' .... - .. Tlt'J....
=O C...
2030 2100 2300 0.0 0.5 1.0 1.5 2.0 2.5 3.0 3.5 Mixing Ratio [kg kg 1] le-4 35Figure 1.10 Ti me evolution of (a) snow, (b) grau pel and ( c) rê'Lin mixing ratio at the KES sit on 31 Mar h 2015 for the run without the cooling effects of
sublimation. The solid linc indicatcs the height of the