Any correspondence concerning this service should be sent
to the repository administrator:
[email protected]
This is an author’s version published in:
http://oatao.univ-toulouse.fr/26415
Open Archive Toulouse Archive Ouverte
OATAO is an open access repository that collects the work of Toulouse
researchers and makes it freely available over the web where possible
To cite this version: Zorgui, Sana and Chaabene, Siwar and
Batatia, Hadj and Chaari, Lotfi Lentigo detection using a deep
learning approach. (2020) In: International Conference On Smart
Living and Public Health (ICOST 2020), 24 June 2020 - 26 June
2020 (Hammamet, Tunisia).
LENTIGO DETECTION USING A DEEP LEARNING APPROACH
Sana Zorgui
1, Siwar Chaabene
1Hadj Batatia
2and Lotfi Chaari
21University of Sfax, MIRACL, Tunisia 2University of Toulouse, IRIT - INP-ENSEEIHT, France
ABSTRACT
Reflectance confocal microscopy (RCM) allows fast data ac-quisition with a high resolution of the skin. In fact, RCM images are becoming more and more used for lentigo diag-nosis. In this paper, we propose a new classification method to automate specific steps in lentigo diagnosis. Our method is based on a convolutional neural network (CNN) on In-ceptionV3 architecture combined with data augmentation and transfer learning. The experimental validation showed the ef-ficiency of our model by reaching an accuracy of 98.14%.
Index Terms— RCM, Lentigo detection, CNN classifica-tion, InceptionV3.
1. INTRODUCTION
Reflectance Confocal Microscopy (RCM) [1] is a modality in-creasingly used in medical imaging. In vivo RCM technique is easy to use during the patient examination and acquires high resolution skin images in a short time. This modality can be used to help dermatologists diagnose different skin diseases. However, it takes a long time for dermatologists to make full use of the possibilities of this technique for diag-nostic purposes. Our work aims to develop a new tool to auto-mate certain diagnostic steps required using deep learning [2]. On the other side, the lentigos are age spots that mainly ap-pear on the hand or on the areas most frequently exposed to the sunlight. On the surface, they appear as a darker spot. Inside the skin layers, it is mainly at the level of the dermis-epidermis junction that the differences can be visible [3]. Therefore, the distinction of lentigos can be made using the RCM images. Several deep learning architectures, especially convolutional neural network (CNN) [4] show great potential in medical imaging classification. In this paper, we propose a new 3D RCM image (2D + depth) classification method for lentigo detection. The method is based on a CNN on InceptionV3 architecture [5]. Until now, little works have been proposed for lentigo/healthy classification of RCM im-ages. In [6], the authors perform a two-dimensional wavelet decomposition. Then a generalized Gaussian distribution was applied to the wavelet coefficients in order to perform a quantitative analysis assisted by a support vector machine (SVM) to classify RCM images obtaining an accuracy of 84.4%. Another approach in [7] explores a new unsupervised
Bayesian algorithm for the joint reconstruction and classifica-tion of RCM images. The resulting algorithm for healthy and lentigo classification reached an accuracy percentage of 97%. Beside, the paper [8] automatically diagnosed lentigo by us-ing three separate feature extraction methods like Wavelets, Haralick and CNN by Transfer Learning. The healthy/lentigo classification results reached an accuracy of 76%.
The present paper is organized as follows. Section 2 presents the problem formulation of lentigo diagnosis. Section 3 detailed the proposed lentigo detection method. Section 4 presents the experiment validation of our method. Finally, conclusion and some perspectives are drawn in Section 5.
2. RELATED WORK
2.1. Lentigo detection
Lentigo is a lesion that occurs in the dermal epidermal junc-tion between the dermis and the epidermis involving a high concentration of melanocytes in the dermal papillae walls. Most forms of lentigo are benign [9] like lentigo simplex as Fig. 1 (a) and solar lentigo as Fig. 1 (b). They are usually removed for cosmetic purposes. However, certain types such as lentigo maligna [10] as Fig. 1 (c) may be harmful and must be removed.
(a) (b) (c)
Fig. 1: Lentigo simplex (a), Solar lentigo (b) and Lentigo maligna (c).
Usually, lentigo is diagnosed using dermatoscopy [11]. Sadly, non-pigmented melanocytes with this modality can go com-pletely unnoticed leading to complications in identifying the lesion contours with precision. Hispathology [12] is also used to confirm the diagnosis, but it can be inconvenient due to the fact that it is an in vitro technique involving performing a biospy from the pigmented areas. For these reasons, the RCM modality emerged to solve the problems encountered
before. Therefore, this modality allows the expert to carry out a real-time 3D data acquisition and to facilitate the full observation of the biological structures in deformation over time. Due to all of these reasons, our approach is based on images acquired thanks to this modality.
In [6, 7], the authors propose two RCM lentigo detection methods based on the statistical and Bayesian models re-spectively. The methods have proved complicated and hard to implement. They require manual procedures like feature selection and data preparation. To this regard, we propose here a method for RCM image classification using a CNN architecture. Indeed, CNNs have proven their capacity to ef-ficiently solve several complex problems in medical imaging.
2.2. Convolutional neural networks
The CNN [4] is a deep learning architecture that is primar-ily used for image classification and object detection. Fig. 2 displays a general CNN architecture, where one can easily identify the following layers:
Fig. 2: The CNN architecture model.
• The convolutional layers: a key component of a CNN architecture, used for automatic feature extraction.
• The rectified linear units (ReLU): used after each con-volutional layer. Each layer combines nonlinear layers and rectification layers to add nonlinearity to the sys-tem.
• The pooling layers: used for feature selection by maxi-mum or/and average pooling.
• The fully connected layers: also known as dense lay-ers receiving the flattened (1D) feature map. Usually, the final fully connected layer has the same number of output nodes as the class numbers.
• The Softmax function: calculates the probabilities of each target class over all possible classes. This function helps determine the target class for the given inputs.
3. PROPOSED METHOD FOR LENTIGO DETECTION
The proposed method consists of classifying RCM images into healthy/lentigo classes using an InceptionV3
architec-ture. Our lentigo detection method combines the InceptionV3 model with other known deep learning techniques like trans-fer learning [13] and data augmentation [14]. Fig. 3 presents the different steps used in the proposed lentigo detection method. The following subsections give detailed descriptions of each step.
Fig. 3: Pipeline of the proposed method.
3.1. Data Preparation
The input RCM images for the training procedure combines two sets such as a 73% traning set and a 14% validation set. The remaining 13% is dedicated to the prediction phase. In order to avoid overfitting, a validation set is added to our train-ing phase because the non linear InceptionV3 model will pos-sibly achieve 100% training accuracy and overfit.
3.2. Data Preprocessing
In the first step of the preprocessing procedure, the RCM im-ages of the training set are resized to fit in the InceptionV3 network. A normalization step is added to help the CNN bet-ter process the input images, in order that all feature values have the same range and the system needs only one global learning rate multiplier. Afterwards, the data augmentation step is proposed to improve our classification results. This step prevents accuracy decay and overfitting. In [15] the au-thors demonstrate the importance of data augmentation as a regulazier in the CNN classification model.
3.3. InceptionV3 model
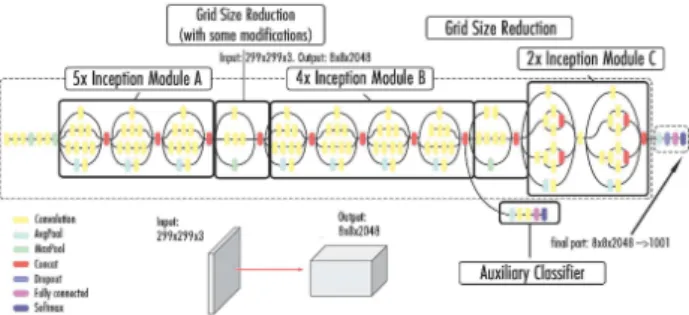
As shown in Fig. 4, the InceptionV3 model consists of a com-bination of three main modules.
Fig. 4: Architecture of the Inceptionv3 model.
The first one (Module A) uses two smaller convolution layers (3 × 3) to decrease the computational cost by reducing the number of parameters to improve performance. Module B divides each convolution layer of n × n size to two layers of 1 × n and n × 1 dimensions to have a less complex network. Finally, Module C reduces the representational bottleneck by expanding the filters in order to evade information loss.
More upgrades are also proposed by the InceptionV3 net-work other than the smart factorization methods such as:
• RMSProp optimizer allows a faster convergence of the model thus allowing a higher learning rate.
• BatchNorm reduces the covariance shift and allows each network layer to learn a little independently of the others.
• Label Smoothing is a regularizing component applied to the loss formula to prevent overfitting.
3.4. Transfer Learning
As shown in Fig. 3, transfer learning [16] is proposed in order to ensure better performance of the model. The model needs lots of labeled images to be capable of solving complex prob-lems. This has proved to be challenging especially when the available dataset is small. Transfer learning is a deep learning method, in which a model developed for a task is reused for a second task. This technique uses pre-trained models as a starting point for other medical imaging tasks given the vast computational and time resources required to develop CNN models on these problems.
3.5. Prediction Model
In the prediction phase, the RCM images test set are resized and provided to the trained CNN. Our system calculates a pre-diction score for each test image after resizing it and compares it with the threshold T equal to 0.5. The threshold value is chosen that way due to the fact that we are performing a bi-nary classification. The classification condition is as follows: if the predicted score (PS) value of the image test is lower than T then this RCM image is classified as lentigo and conversely.
4. EXPERIMENTAL VALIDATION
This section evaluates the validation of the proposed lentigo detection method on real RCM data. In our work, the dataset is provided from Lab. Pierre Fabre.
In this experiment, the data include 428 RCM images which high spatial resolutions and annotation on each image into two healthy and lentigo classes. The images were acquired with a Vivascope 1500 apparatus. Each RCM image shows a field of view of500 × 500 µm with 1000 × 1000 pixels. A selection of 45 wemen aged 60 years were recruited. All participants have offered their informed consent to the RCM skin test. We split these data into three main sets:
• A 314 images training set divided into two classes of 160 healthy images and 154 lentigo images.
• A validation set of 60 images, divided equally between two classes of lentigo and healthy. The validation set has been added to evaluate our training procedure. The main objective is to prevent over-fitting.
• A 54 RCM images testing set divided equally for healthy and lentigo classes.
Our classification method based on the InceptionV3 network is build using the Keras library. The InceptionV3 model is configured to accept the greyscale RCM images. As initial-ization, all RCM images were resized into new dimensions of 299 × 299 pixels and rescaled to help CNN processing. The parameter values of data augmentation step are presented in Tab 1.
Table 1: Data augmentation parameters.
Parameter value Shear 0.2 Zoom 0.2 Rotation degree 20° Horizontal translation 0.2 Vertical translation 0.2
The shear, zoom and translation ranges vary from 0 to 1. We choose the value of 0.2 for each to enrich the dataset without altering the image main features and confusing the system. The rotation range varies to0° from 180° and a small rotation angle was proposed for the same reasons.
Fig. 5 displays the accuracy curves of the training and vali-dation sets, as well as the training loss. The accuracy curves suggest that our system converged after 40 epochs. The sys-tem reached an accuracy value of 94% for training and 69% for validation. Hence, the reported values indicate that our system learns well without over- or under-fitting.
Fig. 5: Proposed method accuracy graph and loss graph for training and validation sets after each epoch.
The performance of the proposed method is indicated by the test set according to the ability to correctly diagnose the pro-vided skin tissues. The reported values in Tab. 2 indicate the performance of our classification method. Therefore, 53 out of 54 images test set were correctly classified with an accu-racy of 98,14%.
Table 2: Confusion matrix.
Lentigo Sane Lentigo 27/27= 100% (TP) 1/27= 3,7% (FN)
Sane 0/27= 0% (FP) 26/27= 96,3% (TN)
In Tab. 2, TP, TN, FP and FN represent respectively true posi-tives, true negaposi-tives, false positives and false negatives. Based on the confusion matrix, Accuracy, Precision, Specificity, Re-call and F-score values are reported in Tab 3. All the men-tioned measures indicate a good performance of the proposed method with values equal or very close to one.
Table 3: Quantitative evaluation of the proposed method per-formance. Accuracy (TP+TN)/(TP+TN+FP+FN) 0.98 Precision (P) TP/(TP+FP) 1 Specificity TN/(FP+TN) 1 Recall (R) TP/(TP+FN) 0.96 F-score (2 × P × R)/(P+R) 0.97
Fig. 6 presents four correct classification examples of RCM images from the test set. The reported values shown with each test image indicate the prediction score (PS). The displayed images correspond to different PS ranges. We can notice that
the model performs well both for images with PS close to 0 or 1, but also for images with PS close to 0.5 (images (b) and (d)). Health y (PS ≥ 0.5) (a) PS=0.997 (b) PS=0.613 Lentigo (PS < 0 .5) (c) PS=0.008 (d) PS=0.308
Fig. 6: Correct classification examples of RCM images for Healthy and Lentigo patients classified by the proposed method.
Fig. 7 shows the only image wrongly classified using our pro-posed method. This image shows some type of skin deforma-tion similar to the changes the skin undergoes due to lentigo. Hence, the network interpreted it as a lentigo lesion.
Fig. 7: The only false classification (PS=0.0005).
For the sake of further evaluation, we compare the accuracy of the test with related works that used the same dataset. The reported values in Tab. 4 show that our model outperforms in comparison with the other methods. Specifically, we compare our results with those reported in [6] where the authors used
a Statistical model combined with an SVM classifier and [7] where the authors use an unsupervised Bayesian approach.
Table 4: Comparison performance with state of the art meth-ods.
Lentigo detection method Accuracy Halimi et al 2017 [6] 84.4% Halimi et al 2017 [7] 97.7% Proposed method 98,14%
5. CONCLUSION
In this paper, we proposed a new method to classify RCM im-ages into healthy and lentigo skins. This method is based on the InceptionV3 CNN architecture. The network was trained with a dataset of 374 images and tested on 54 images of dif-ferent stacks and depths. The suggested CNN method shows huge potential and very promising results. In future work, we will focus on applying the proposed approach to larger datasets and comparisons to other deep architectures.
Acknowledgements
The authors would like to thank Gwendal JOSSE et Jimmy Le Digabel from Lab. Pierre Fabre for prividing data.
6. REFERENCES
[1] M.Rajadhyaksha, M.Grossman, D.Esterowitz, R.H.Webb, and R.R.Anderson, “In vivo confocal scanning laser microscopy of human skin: Melanin provides strong contrast,” Journal of Investigative Dermatology, vol. 104, pp. 946–952, 04 1995.
[2] L.Geert T.Kooi, E.Bejnordi, B.Ehteshami, A.A.A.Setio, F.Ciompi, M.Ghafoorian, V.D.Laak, A.W.M.Jeroen, B.V.Ginneken, and C.S´anchez, “A survey on deep learning in medical image analy-sis,” Medical Image Analysis, vol. 42, pp. 60–88, 2017.
[3] P. Calzavara-Pinton, C. Longo, M. Venturini, R. Sala, and G. Pellacani, “Reflectance confocal microscopy for in vivo skin imaging,” Photo-chemistry and photobiology, vol. 84, pp. 1421–1430, 2008.
[4] R.Yamashita, M.Nishio, R.Do, and K.Togashi, “Convolutional neu-ral networks: an overview and application in radiology,” Insights into Imaging, vol. 9, pp. 611–629, 06 2018.
[5] C.Szegedy, V.Vanhoucke, S.Ioffe, J.Shlens, and Z.Wojna, “Rethinking the inception architecture for computer vision,” computing research repository (CoRR), 2015.
[6] A.Halimi, H.Batatia, J.Digabel, G.Josse, and J.Y.Tourneret, “Statisti-cal modeling and classification of reflectance confo“Statisti-cal microscopy im-ages,” Computational Advances in Multi-Sensor Adaptive Processing (CAMSAP), pp. 1–5, Dec 2017.
[7] A.Halimi, H.Batatia, J.Digabel, G.Josse, and J.Y.Tourneret, “An unsu-pervised bayesian approach for the joint reconstruction and classifica-tion of cutaneous reflectance confocal microscopy images,” European Signal Processing Conference EUSIPCO, pp. 241–245, Aug 2017.
[8] R.Cendre, A.Mansouri, Y.Benezeth, F.Marzani, P.Jean, and E.Cinotti, “Two schemes for automated diagnosis of lentigo on confocal mi-croscopy images,” International Conference on Signal and Image Pro-cessing (ICSIP), pp. 143–147, 07 2019.
[9] O. `Eve, “Les produits d´epigmentants : le point en 2011,” p. 78, Sep 2011.
[10] L.M.Cohen, “Lentigo maligna and lentigo maligna melanoma,” Jour-nal of the American Academy of Dermatology, vol. 33, no. 6, pp. 923 – 936, 1995.
[11] L.A.Bollea-Garlatti, G.N. Galimberti, and R.L. Galimberti, “Lentigo maligna: Keys to dermoscopic diagnosis,” Actas Dermo-Sifiliogr´aficas (English Edition), vol. 107, no. 6, pp. 489 – 497, 2016.
[12] W. K. Andersen, R. R. Labadie, and J.Bhawan, “Histopathology of solar lentigines of the face: A quantitative study,” Journal of the Amer-ican Academy of Dermatology, vol. 36, no. 3, pp. 444 – 447, 1997. [13] R.Ribani and M.Marengoni, “A survey of transfer learning for
convolu-tional neural networks,” Conference on Graphics, Patterns and Images Tutorials, pp. 47–57, 2019.
[14] C.Shorten and T.M.Khoshgoftaar, “A survey on image data augmenta-tion for deep learning,” journal of Big Data, vol. 6, pp. 60, 2019. [15] A.H.Garc´ıa and P.K¨onig, “Further advantages of data augmentation on
convolutional neural networks,” International Conference on Artificial Neural Networks, pp. 95–103, 09 2018.
[16] J.Yosinski, J.Clune, Y.Bengio, and H.Lipson, “How transferable are features in deep neural networks?,” computing research repository (CoRR), pp. 3320–3328, 2014.