DYNAMIQUE DE BOIS MORT EN RÉTENTION FORESTIÈRE LINÉAIRE DE LA FORÊT BORÉALE AMÉNAGÉE DU NORD-OUEST DU QUÉBEC
MÉMOIRE
PRÉSENTÉ
COMME EXIGENCE PARTIELLE
DE LA MAÎTRISE EN BIOLOGIE
PAR
CARINE CÔTÉ-GERMAIN
Avertissement
La diffusion de ce mémoire se fait dans le respect des droits de son auteur, qui a signé le formulaire Autorisation de reproduire et de diffuser un travail de recherche de cycles supérieurs (SDU-522 - Rév.0?-2011 ). Cette autorisation stipule que «conformément
à
l'article 11 du Règlement no 8 des études de cycles supérieurs, [l'auteur] concèdeà
l'Université du Québecà
Montréal une licence non exclusive d'utilisation et de publication de la totalité ou d'une partie importante de [son] travail de recherche pour des fins pédagogiques et non commerciales. Plus précisément, [l'auteur] autorise l'Université du Québec à Montréalà
reproduire, diffuser, prêter, distribuer ou vendre des copies de [son] travail de rechercheà
des fins non commerciales sur quelque support que ce soit, y compris l'Internet. Cette licence et cette autorisation n'entraînent pas une renonciation de [la] part [de l'auteur]à
[ses] droits moraux nià
[ses] droits de propriété intellectuelle. Sauf entente contraire, [l'auteur] conserve la liberté de diffuser et de commercialiser ou non ce travail dont [il] possède un exemplaire.»Mon parcours de maîtrise a été parsemé de défis et de surprises, autant au mveau académique que dans ma vie personnelle. Trois personnes ont joué un rôle essentiel dans l'aboutissement de ce projet à des niveaux complètement différents. L'arrivée de ma fille a causé de grands remous émotionnels et un certain ralentissement académique, mais m'a ausst fait énormément grandir. Elle m'a pourvu d'une meilleure confiance et d'une meilleure organisation, qualités essentielles pour l'aboutissement de ce projet de recherche. Merci Aria d'être arrivée dans ma vie à ce moment précis, malgré les apparences, tu as assurément choisi le meilleur temps. Merci aussi à mon complice de vie, Gabriel, qui a été un inébranlable support au travers les hauts et les bas de ces dernières années transformatrices. Merci pour tous ces repas cuisinés avec amour lors de mes semaines chargées, pour ton aide, tes conseils, et surtout, tes encouragements. Tu as été un allié indispensable. Finalement, un grand merci à mon directeur, Pierre, pour ton côté humain et hautement compréhensif. Malgré deux importants « changements de plans » (la maternité et le déménagement à l'autre bout du pays), tu es demeuré accommodant et je t'en suis très reconnaissante. Merci pour ta confiance en moi, ton support et ta vision scientifique perspicace. J'ai adoré ta façon de travailler, ton laisser-aller un peu déstabilisant au départ nous permet de nous dépasser et de gagner une expérience plus riche de nos projets de recherche.
Plusieurs autres personnes ont participé de façon importante à 1 'aboutissement de ce document par leurs précieuses connaissances et leurs judicieux conseils. D'abord mon co-directeur, Brian Harvey qui a grandement nourri mes réflexions lors de l'analyse
de mes données. Merci à Alain Leduc pour ton temps et ta grande perspicacité. Merci aux experts de la dendrochronologie, Igor Drobyshev pour la rapidité de tes réponses à mes nombreux courriels, tes conseils et ton expertise; et Virginie-Arielle Angers pour tes idées, tes conseils et ton expérience. J'avais une vague impression de marcher dans tes pas... Merci aussi à Daniel Kneeshaw qui a révisé ma proposition de recherche et qui, fidèle à lui-même, a bousculé mes réflexions et apporté une nouvelle perspective. Merci aussi à tous les professionnels de recherche du CEF qui ont apporté leur précieuse aide à mon projet : Daniel Lesieur, Mélanie Desrochers, Luc Lauzon et François Rousseu.
Finalement, un énorme merci aux aides de terrains et de laboratoire. D'abord Suzie Dubuc, merci pour ton souci du détail, ton dévouement et d'avoir été ma correspondante à distance à l'étape des travaux de laboratoire en dendrochronologie. Ton aide a grandement facilité mon travail alors que j'étais dans les comtés nordiques ! Merci aussi à Anne-Marie Béland, ton sourire et ton humour inébranlable tapissent mes souvenirs de terrain, à Réjean Deschênes, ton expertise et tes histoires auront profondément changé ma façon de faire du terrain, merci aussi pour tes nombreuses attentions. Merci à Audrey Sigouin, Louis-Joseph Drapeau, Frédéric Charron et Thomas Charron.
LISTE DES TABLEAUX ... ix
RÉSUMÉ ... xi SUMMARY ... xiii
INTRODUCTION GÉNÉRALE ... 1
CHAPTER 1 DEADWOOD DYNAMICS IN LINEAR RETENTION IN MANAGED BOREAL FORESTS IN NORTH WESTERN QUEBEC ... 9
1.1 Introduction ... 9
1.2 Methods ... 12
1.2.1 Study Area ... 12
1.2.2 Data Collection ... 14
1.2.3 Volume calculation ... 16
1.2.4 Statistical analyses ... 16
1.3 Results ... 20
1.3.1 Recent deadwood recruitment drivers ... 20
1.3.2 Effects of retention width ... 22
1.3.3 Spatial distribution of standing and downed deadwood ... 22
1.3.4 Long-term sustainability for deadwood recruitment.. ... 23
1.4 Discussion ... 25
1.4.1 Spatial distribution and vertical structure ... 26
1.4.2 Retention width and core mortality ... 27
1.4.3 Temporal evolution ... 28
1.4.4 Conclusion and management implications ... 30
1.5 References ... 31
CHAPTER Il TREE MORTALITY, DEGRADATION AND DECOMPOSITION PATTERNS FOR TREMBLING ASPEN AND BLACK SPRUCE IN RIPARIAN BUFFERS OF MANAGED BOREAL FOREST LANDSCAPES IN NORTH-WESTERN QUEBEC. ... 55
2.2 Methods ... 58
2.2.1 Study area and species ... ,. ... 58
2.2.2 Data collection ... 60
2.2.3 Statistical analyses ... 62
2.3 Results ... 66
2.3.1 General mortality patterns ... 66
2.3.2 Survival curves ... 67
2.3.3 Decomposition rates ... 67
2.3.4 Degradation stage and density loss ... 68
2.4 Discussion ... 69
2.4.1 Sn ag survival ... 70
2.4.2 Decomposition rates ... 72
2.4.3 Degradation classes, wood density, and time since death ... 72
2.4.4 Conclusion ... 74
1.5 References ... 76
CONCLUSION GÉNÉRALE ... 97
Figure
Page
1.1 Location of study a rea and sample sites ... 43
1.2 Distribution of sample sites with time since harvest (TSH) and
retention type in both bioclimatic domains ... 44
1.3 Deadwood recruitment vs time since harvest (TSH) in
mixedwood and coniferous forests ... 44
1.4 Effect of linear retention width on deadwood recruitment in the
center plot of retention stands for both bioclimatic domains ... 45
1.5 Recent snag volume as a proportion of recent deadwood across linear retention strips in cutblock separators and riparian buffer strips of harvested landscapes in boreal mixedwood and coniferous forests in
northwestem Québec ... 46
1.6 Volume proportion of large (dbh 2: 20cm) standing dead poplar
(trembling aspen and balsam poplar) on total living tree volume ... 47
1.7 Tree diametrical distribution of each linear retention habitat
sampled in the boreal mixedwood managed forest landscape ... 48
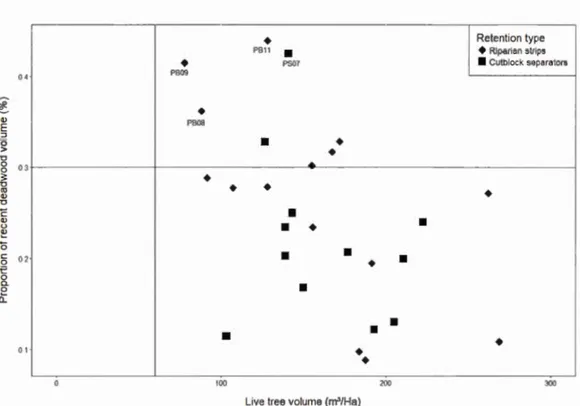
1.8 Relationship between the proportion of recent deadwood volume (ratio of recent deadwood volume to initial stand volume) and living tree volume m linear retention habitats sampled in the black spruce-feathermoss
forest.. . ... 49
1.9 Tree diametrical distribution of each linear retention habitat
2.1 Location of study a rea and sample sites ... 89
2.2 Mortality count per year for trembling as pen and black spruce ... 90
2.3 Survival curves for trembling aspen in mixedwood forest and
black spruce in coniferous forest. ... 91
2.4 Wood density and time since death relative to degradation stage
distributions for trembling as pen ... 92
2.5 Wood denstiy and time since death relative to degradation stage
Tableau
Page
1.1 Mean (range) of sample site characteristics. Initial stand volume,
!SV; stand age, SA; site width, SW; recent deadwood volume, ROY ... 51
1.2 Discrete characteristics of sample plots with detailed classification and number of observations for each class. Beaver occurrence, 80; Plot
location, PL*; Organic layer thickness, OL; Orientation, OR ... 52
1.3 Best mode! parameter estimates describing deadwood recruitment in mixedwood and coniferous forests with confidence intervals (CI) and degree
of significance (P-value ) ... 53
2.1 Sample site characteristics ... 94
2.2 Degradation classification system with description of each stage ... 95
2.3 Description of dated dead stems. Ti me since death (TSD) mean and
standard error (SE), and number of sam pies of each species ... 96
2.4 Decomposition rate in snags for trembling aspen and black spruce
gouvernements à modifier les pratiques sylvicoles pour conserver une structure de bois mort adéquate au maintien de la faune et de la flore qui y sont associées. Pour ce faire, la forêt boréale du Québec est généralement aménagée par des coupes équiennes avec une rétention d'habitats résiduels entre les aires de récoltes principalement de forme linéaire (séparateurs de coupe et bandes riveraines). L'objet de cette étude est donc d'évaluer la dynamique de bois mort dans ces forêts résiduelles dans le but de (i) caractériser le recrutement de bois et ses facteurs explicatifs sous-jacents au cours de son évolution depuis la coupe Uusqu'à 30 ans), (ii) évaluer la durabilité des habitats linéaires et le potentiel de recrutement de bois mort à long terme et (iii) d'évaluer les patrons de dégradation pour deux espèces d'arbre dominantes dans leurs écosystèmes respectifs (peuplier faux-tremble et épinette noire). L'étude a été réalisée en forêt boréale au nord de I 'Abitibi-Témiscamingue. On y a mesuré la structure verticale et horizontale dans 26 séparateurs de coupe et 29 bandes riveraines répartis sur deux sous-domaines bioclimatiques (Sapinière à bouleau blanc et Pessière à mousses de 1 'Ouest) et couvrant une chronoséquence de temps depuis la coupe de 3 à 30 ans. De plus, des galettes de chicots et de billes au sol de peupliers faux-tremble (PET) et d'épinette noire (EPN) ont été prélevées. La dernière année de croissance de ces galettes a été déterminée par une analyse dendrochronologique. Les résultats montrent que les arbres en bordures de coupe (<6 mètres) sont grandement perturbés par l'ouverture, tandis qu'une largeur minimale de 100 mètres pour les séparateurs de coupe assure une forêt d'intérieur de qualité apte à soutenir un apport continu de bois mort semblable à celui des forêts matures qui forment des massifs. En général, les rétentions étudiées n'étaient pas dans un état de détérioration (disponibilité d'arbres morts sur pied) et démontraient une certaine durabilité à long terme en matière de recrutement de bois mort sur pied. Les patrons de dégradation du peuplier faux-tremble et de l'épinette noire ont montré une certaine vulnérabilité à la coupe forestière, mais la longévité de chicots est similaire aux données reportées dans les études en forêt naturelle pour la même région. Dans l'ensemble, nos résultats indiquent que les aménagements forestiers auraient avantage à élargir les habitats résiduels pour répondre efficacement aux objectifs de conservation de la biodiversité, notamment celle associée au bois mort.
Mots-Clés : Recrutement d'arbres morts sur pied, trajectoires de dégradation du bois, peuplier faux-tremble, épinette noire, rétention forestière linéaire, forêt boréale mixte, forêt boréale résineuse, aménagement durable des forêts, structure de la végétation, conservation de la biodiversité.
for their life cycle. This central ecological role is an incentive for forest managers to leave linear retention forests and riparian strips between large cutblocks to mitigate impacts of timber harvesting on biodiversity. Our objective was to assess deadwood dynamics in these linear retention forests by (i) characterizing deadwood recruitment and underlying .factors across stand evolution after harvest (up to 30 years), (ii) evaluate the sustainability of these linear retention habitats and their potential for deadwood recruitment in the long-term, and (iii) determine degradation pathways of two dominant tree species (trembling aspen and black spruce). The study was undertaken in the boreal forest of eastern Canada (Abitibi region, Québec). We measured the vertical and horizontal forest structure in 26 cutblock separators and 29 riparian strips in two bioclimatic domains (the black spruce-feathermoss forest and the balsam fir-white birch mixedwood forest) in a post-harvest chronosequence (3 to 30 years). In addition, we collected cross-sections from snags and logs on trembling aspen and black spruce to determine the last year of growth by dendrochronological analysis. Results show that trees close to harvest edges ( < 6 meters) are strongly disturbed by the opening; however, habitat quality (standing deadwood availability) and sustainability (standing deadwood recruitment) in 100 meter-wide cutblock separators are in li ne with interior forest conditions. A key finding of this study is that linear retention habitats maintained structural attributes 30 years after harvesting, thus providing important biological legacy habitats to regenerating forest landscapes where deadwood recruitment was persistent. For both tree species, degradation patterns of standing dead stems were slightly more vulnerable in linear retention habitats than in continuous unharvested forests. However, the longevity of snags was similar to those in natural unmanaged forests. Overall, we conclude that forest management should increase linear retention width in order to increase the efficiency of biodiversity conservation measures in managed forest landscapes.
Keywords: Standing deadwood recruitment, deadwood degradation pathways, boreal mixedwoods, black spruce forest, trembling aspen, sustainable forest management, linear retention habitats, forest structure, biodiversity conservation.
n'est plus à prouver, puisqu'au cours des trois dernières décennies les recherches sur ses fonctions écologiques se sont multipliées (Harmon et al. 1986, Franklin et al.
1987, Stokland 2001, Boucher et al. 2006, Drapeau et al. 2009b, Nappi and Drapeau 2009, Lassauce et al. 201 1 ). L'apport structurel et alimentaire du bois mort ainsi que
son rôle dans plusieurs processus biogéophysiques sont maintenant fortement
documentés (Hannon et al. 1986). Une panoplie d'organismes forestiers s'installent
et se succèdent à différentes étapes de la décomposition de l'arbre (Franklin et al.
1987). Les champignons sont parmi les premiers colonisateurs avec une proportion de
cellules fongiques pouvant atteindre 35% de la biomasse d'un tronc mort (Swift
1973). Les insectes saproxyliques arrivent aussi très tôt dans la décomposition de
l'arbre. Ils se définissent comme organisme dépendant, pour une partie ou la totalité de son cycle de vie, du bois mort ou sénescent ou encore d'un autre organisme qui en dépend (Speight 1989), et représentent 20 à 25% des espèces forestières (Elton 1966, Siitonen 2001 ). Les vertébrés sont aussi de grands utilisateurs de bois mort et sénescent. C'est le cas notamment des oiseaux cavicoles qui représentent une large proportion de la faune aviaire et qui ont fait l'objet de nombreuses études (Villard 1994, Eberhardt 1999, Martin and Eadie 1999, lmbeau and Desrochers 2002, Drapeau et al. 2009b, Nappi and Drapeau 2009, Ouellet-Lapointe et al. 2012, Cadieux and Drapeau 20 17). Parmi eux, les pics sont reconnus à la fois comme des espèces clés et parapluies (Roberge et al. 2008) car ils créent des gites pour de nombreux utilisateurs de cavités : canards nicheurs, passereaux, oiseaux de proies et mammifères (Martin and Eadie 1999). Leur maintien dépend fortement de la disponibilité de bois sénescent et mort sur pied à différents stades de dégradation essentiels à l'ensemble
de leurs activités vitales comprenant leur alimentation, leur habitat et le
2009b, Nappi and Drapeau 2009). Le bois mort au sol, quant à lui représente une structure importante pour plusieurs petits mammifères et amphibiens et reptiles en tant que corridors de déplacement et de connectivité des habitats (Kimmins 2001 ). Certains végétaux comptent aussi parmi les utilisateurs de bois mort et sénescent, les troncs morts (au sol ou debout) représentent l'élément structurel le plus important pour les cryptogames menacés en milieu forestier (Berg et al. 1994). Une centaine d'espèces de mousses, hépatiques et lichens ont été identifié seulement sur l'épicéa commun en Suède (Kruys et al. 1999). Certaines espèces de plantes vasculaires, comme le bouleau jaune et le thuya occidental ont une plus grande facilité à germer et à croître sur les troncs et souches en décomposition qui deviennent une source de nutriments (Harmon et al. 1986, Franklin et al. 1987, Houle and Payette 1990; Robert et al. 2012). La disponibilité en bois sénescent et mort concerne donc l'ensemble des groupes d'organismes retrouvés en milieux forestiers. En plus de la quantité, la qualité de cette ressource doit être considérée dans les stratégies d'aménagement afin de maintenir l'ensemble des organismes associés au bois mort.
La production de bois mort est intimement liée à la dynamique de mortalité des arbres ce qui est liée au régime de perturbation spécifique à une région donnée. Certaines perturbations comme les feux ou les épidémies d'insectes peuvent générer une abondance de bois mort sur un très vaste territoire (Blais 1983, Morin et al. 1993, Bergeron et al. 2001, Perron 2003). En contrepartie, si les intervalles entre ces perturbations sont plus longs que la longévité des arbres, ces peuplements sont soumis à des perturbations secondaires comme le vent, la suppression, les insectes ou la sénescence naturelle. Ces perturbations sont plus petites et plus locales. Elles génèrent une dynamique de trouées liée à l'ouverture du couvert forestier par pied d'arbre (Kneeshaw and Bergeron 1998, McCarthy 2001, Pham et al. 2004). Ces dynamiques ont une influence dans l'espace déterminant une distribution spatialement agrégée ou dispersée du bois mort, mais aussi dans le temps puisque la cause de mortalité est un facteur déterminant dans la longévité des chicots (Taylor
and Mac Lean 2007, Parish et al. 201 0). Les pnnc1paux facteurs influençant la mortalité des arbres sont l'âge du peuplement et des arbres individuels, la densité et la productivité du site, les espèces présentes et leur taille (Bull et al. 1980, Franklin et al. 1987, Sturtevant et al. 1997, Hély et al. 2000, Stokland 2001, Ferguson and Archibald 2002, Parish et al. 201 0). Les arbres d'une forêt jeune et équienne peuvent mourir par suppression qui résulte de la compétition entre les tiges pour les ressources et crée généralement une grande densité de chicots de petits diamètres (Hély et al. 2000, Parish et al. 201 0). Au fur et à mesure que la forêt vieillit, les taux de mortalité diminuent et les causes se complexifient (Franklin et al. 1987). En général, la densité d'arbres morts sur pied diminue avec le temps, mais la proportion de gros chicots augmente (Cline et al. 1980). Ainsi, au cours des successions végétales, la structure de la forêt se diversifie par la création d'une ca nopée à plusieurs étages et la disponibilité de bois mort sous diverses formes (Cline et al. 1980, Harper and Macdonald 2002, Pham et al. 2004). De la sorte, les vieilles forêts fournissent des habitats uniques car elles sont fortement associées aux arbres et chicots à grand diamètre dont plusieurs animaux cavicoles dépendent (Cline et al. 1980, Harmon et al. 1986, Sturtevant et al. 1997, Clark et al. 1998, Lee 1998, Siitonen et al. 2000, Ferguson and Archibald 2002). De plus, les forêts inéquiennes ont généralement l'avantage de produire du bois mort de façon constante dans toutes les classes de diamètre et de dégradation (Lee 1998, Stokland 2001 ).
En Amérique du Nord, l'aménagement écosystémique, un concept visant à s'inspirer des perturbations naturelles afin de réduire les écarts entre la forêt aménagée et la forêt naturelle, est de plus en plus préconisé (Gauthier et al. 2008). Toutefois, la mise en œuvre de cette approche dans la planification forestière n'en est qu'à ses débuts et ce, même si plusieurs études ont démontré des différences majeures entre les forêts sous l'influence de perturbations naturelles et les forêts aménagées (Franklin et al. 2000, Bergeron et al. 2007, Cyr et al. 2009, Dragotescu and Kneeshaw 20 12), notamment dans la proportion de forêts âgées. Des études en forêt naturelle de l'est
du Canada ont montré que les cycles de feux sont en moyenne plus long que 100 ans et que la structure d'âge des forêts est constituée de plus de 50% de peuplements centenaires et plus de 15% sont bicentenaires (Bergeron et al. 2001). L'aménagement équiens en forêt boréale québécoise, quant à lui, prévoit une révolution forestière de 100 ans ou moins. L'objectif sylvicole consiste à réduire la structure d'âge des peuplements à des forêts qui ne dépassent pas l'âge de maturité commerciale (100 ans) pour être récoltés. Cette approche d'aménagement, fondée sur une normalisation de la structure d'âge des forêts, entraîne une diminution considérable de la proportion de peuplements matures et surannés dans les paysages aménagés (Bergeron et al. 2002, Cyr et al. 2009). Or, comme déjà mentionné, les vieilles forêts sont fortement associées à la disponibilité d'arbres et chicots à grand diamètre essentiels à plusieurs organismes forestiers (Cline et al. 1980, Harmon et al. 1986, Sturtevant et al. 1997, Clark et al. 1998, Lee 1998, Siitonen et al. 2000). Ce rajeunissement du paysage menace donc les organismes associés au bois mort via la perte de diversité dans la structure verticale et horizontale (Boucher et al. 2006, Drapeau et al. 2009b).
Le gouvernement du Québec oblige les compagnies forestières à laisser des lisières boisées d'un minimum de 20 mètres de largeur en bordure de lacs et rivières (bandes riveraines) et de 60 à 100 mètres de largeur entre les aires de coupe (séparateurs) (Quebec government, 2015). Ces rétentions linéaires servent d'habitats refuges pour les organismes dépendants des forêts âgées car ils peuvent représenter les seuls habitats de ce type de couvert forestier sur plusieurs centaines de km2 (Franklin 1993, Franklin et al. 2000). L'importance écologique de ces peuplements résiduels nécessite qu'on leur accorde une attention particulière afin de s'assurer que les éléments structurels retrouvés en forêt naturelle soient bien représentés dans les forêts aménagées pour permettre le rétablissement de l'écosystème. Or, les ouvertures créées par la coupe forestière engendrent un effet de bordure sur les peuplements en périphérie. Bien que les rétentions linéaires peuvent faciliter la connectivité des habitats servant à la dispersion des espèces dans les paysages fragmentés par la coupe
-(Andren 1994, Franklin et al. 2000, Debinski and Holt 2000, Bennett 2003), la quantité de forêt d'intérieur y est réduite en raison du ratio élevé périmètre/superficie (Mascarua L6pez et al. 2006, Harper et al. 20 16). L'un des impacts majeurs de 1 'effet de bordure consiste en une augmentation du taux de mortalité des arbres dans les forêts résiduelles, celui-ci peut être multiplié par un facteur de 2 à 4 selon les espèces, au cours des années suivant la récolte (Darveau et al. 1994, Esseen 1994, Bladon et al. 2008).
La dynamique du bois mort, sujet d'actualité dans le domaine de la biologie de la conservation, permet de comprendre la complexité de cet élément à diverses échelles spatiales et temporelles. Cette compréhension est essentielle, d'abord parce qu'elle permet une meilleure évaluation de la biodiversité potentiellement présente en paysage aménagé, mais aussi pour aider les forestiers et gestionnaires gouvernementaux responsables de la planification forestière qui s'inquiètent de plus en plus de la disponibilité du bois mort sur leur territoire d'affectation (Drapeau et al. 2002, MFFP 2005, Angers 2009).
À l'échelle du peuplement, l'étude de la dynamique du bois sénescent et mort consiste à mesurer, quantifier et caractériser l'apport en bois mort, sa répartition structurelle, sa diversité en stade de décomposition et le potentiel de recrutement, ainsi que les facteurs influençant ces processus. Elle permet d'évaluer la structure horizontale et verticale d'un peuplement sur une échelle spatiale ainsi que d'émettre des prévisions à plus ou moins long terme sur son évolution. À l'échelle de l'arbre, les patrons de mortalité et de dégradation des arbres sont propres à chaque espèce et permettent une évaluation plus fine de la dynamique opérée dans les écosystèmes (Alban and Pastor 1993, Garber et al. 2005, Brais et al. 2006, Aakala et al. 2008, Angers 20 Il). Ces patrons de dégradation se dessinent par la cause de mortalité préférentielle, la longévité des chicots, le taux de décomposition du bois et le parcours des tiges au travers des classes de dégradation. La longévité des chicots
traduit le temps de rétention de cette structure éphémère et influence la densité retrouvée dans les peuplements (Keen 1929, 1955, Cline et al. 1980, Lee 1998, Everett et al. 1999, Storaunet and Rolstad 2002, Garber et al. 2005, Angers et al. 201 0). La décomposition des tiges est un processus lent et difficile à mesurer car elle dépend de plusieurs facteurs biotiques et abiotiques (Erickson et al. 1985, Harmon et al. 1986, Alban and Pastor 1993). Calculer la perte de densité du bois mort permet une certaine évaluation de son temps de rétention dans l'écosystème (Johnson and Greene 1991, Alban and Pastor 1993, Krankina and Harmon 1995, Harmon et al. 2000, Brais et al. 2006). Ces processus sont fortement influencés par la cause de mortalité et leur position dans l'écosystème (Johnson and Greene 1991, Storaunet and Rolstad 2002, Garber et al. 2005).
Les études de la dynamique du bois mort en forêt naturelle de 1 'Ouest du Canada sont nombreuses (Spies et al. 1988, Johnson and Greene 1991, Clark et al. 1998, Lee 1998, Huggard 1999). Il en est de même pour la forêt boréale de 1' Est non aménagée (Paré and Bergeron 1995, Hély et al. 2000, Brais et al. 2005, Boulanger and Sirois 2006, Aakala et al. 2007, 2008, Angers et al. 201 0). Quelques études ont été effectuées en forêt aménagée (Cline et al. 1980, Garber et al. 2005, Parish et al. 201 0), mais très peu en forêt boréale aménagée de l'Est du Canada (Ferguson and Archibald 2002, Mascarua L6pez et al. 2006, Moussaoui et al. 20 16).
La forêt boréale du Québec est aménagée depuis plus de trente ans au moyen de grandes agglomérations de coupes équiennes séparées par des habitats linéaires de forêts résiduelles. La présente étude vise à évaluer la dynamique du bois mort dans ces habitats résiduels linéaires dans les domaines bioclimatiques de la forêt mixte de sapinière à bouleau blanc et de la forêt coniférienne de la pessière à mousses de l'Ouest du Québec.
Cette étude vise à approfondir nos connaissances sur la qualité, la quantité et la diversité du bois mort dans les séparateurs de coupe et les bandes riveraines au sein des agglomérations de coupes. De plus, une approche de chronoséquence permet d'évaluer la dynamique temporelle du bois mort dans les habitats linéaires en substituant le temps par l'espace et en échantillonnant des rétentions créées le long d'un gradient qui va de 3 à 30 ans après la coupe. Notre analyse s'effectue donc à deux échelles, il y a d'abord une caractérisation à l'échelle des peuplements de la structure du couvert forestier dans les habitats résiduels. Nous analysons ensuite à l'échelle de l'arbre, la dynamique du bois mort au moyen d'une approche dendrochronologique par le prélèvement de galettes d'arbres sur les chicots et les billes au sol. Ce mémoire est divisé en deux chapitres ; nos objectifs pour le premier chapitre sont : ( 1) de caractériser le recrutement de bois dans les peuplements résiduels en termes de qualité et quantité au cours de son évolution post-coupe, en démontrant les principaux facteurs en jeux, et (2) d'évaluer la durabilité des habitats linéaires en ce qui concerne la structure du couvert forestier et le potentiel recrutement de bois mort. Dans le deuxième chapitre, nous évaluons la dynamique du bois mort pour deux espèces d'arbre dominant dans leur domaine bioclimatique respectif (peuplier faux-tremble en forêt boréale mixte et épinette noire en pessière à moussses).
FORESTS fN NORTHWESTERN QUEBEC
1.1 fNTRODUCTION
Most of the commercial boreal forest in Canada is under an even-aged harvesting regime with a dispersed forest retention (Bergeron and Harvey 1997, Drapeau et al. 2009a, Gauthier et al. 2009, 20 15a). This management regime leads to landscape rejuvenation with the overrepresentation of regenerating stands and the concurrent reduction of mature and old-growth forests ( Drapeau et al. 2000, 2016, Bergeron et al. 2002, Gauthier et al. 2009) in comparison with the natural disturbance regime under which the boreal forest has evolved (Johnson and Van Wagner 1985, Delong and Tanner 1996, Bergeron et al. 200 l, 2002, 2004a, 20 17). The reduction of old forests and the concomitant simplification of stand structure in managed forests (less heterogeneity in the vertical and horizontal structure, fewer large old trees, decaying trees and deadwood) are among the persistant concerns with regard to biodiversity conservation (Franklin et al. 2002, Boucher et al. 2006, Drapeau et al. 2009a, Stokland et al. 2012, Kuuluvainen et al. 2015). Coarse woody debris, including large standing or downed dead trees, are key attributes found in old-growth forests, critical for numerous organisms (Cline et al. 1980, Harmon et al. 1986, Berg et al. 1994, Sturtevant et al. 1997, Lee 1998, Siitonen 2001, lm beau and Desrochers 2002, Ferguson and Archibald 2002, Drapeau et al. 2009b, Stokland et al. 20 12).
In managed boreal forest landscapes, habitat retention can serve as a lifeboat for organisms associated with old forests. That may represent the last remaining fragment of old stands across severa! hundreds of square kilometers (Franklin 1993, Franklin et
al. 2000). This retention may take the form of islands and patches in the middle of a large aggregated clearcuts or be organized in linear retention strips (riparian buffers along watersways and cutblock separators of different widths between clearcut areas).
ln Québec, linear retention has become the most prevalent mode of forest retention in
managed forest landscapes since the 1980's (Quebec government, 20 15). Linear
retention provides a levet of connectivity (travet corridors) between unharvested
habitats, thus assisting dispersal for sorne species throughout fragmented landscapes
(Andren 1994, Franklin et al. 2000, Debinski and Holt 2000, Bennett 2003). Conversely, linear retention is likely to be more vulnerable to edge effects due to their
high perimeter-area ratio and general absence of core habitat (Mascarua L6pez et al.
2006, Harper et al. 20 16). The extent of edge influence is significant in linear habitats in the eastern black spruce forest in that it can affect the entire habitat when the
residual forest is too narrow (Mascarua L6pez et al. 2006).
Edge-effects in linear retention could thus alter the long-term capacity of these
habitats for biodiversity throughout the reconstruction phase of forest cover in
cutover areas. Tree dynamics may be altered first by strongly increasing the mortality rate of stems in the initial years after harvest (Darveau et al. 1994, Esseen 1994, Harper et al. 2005, Bebber et al. 2005, BI adon et al. 2008, Lavoie et al. 20 12) and second, by modifying the factors driving tree mortality and degradation, such as
humidity, wind exposition, temperature variations, and soit disturbance (Erickson et
al. 1985, Chen et al. 1995, Harper and Macdonald 2002). Other factors that influence tree mortality are stand age, tree density, tree species and size (Bull et al. 1980, Franklin et al. 1987, Sturtevant et al. 1997, Hély et al. 2000, Stokland 2001, Ferguson and Archibald 2002, Parish et al. 201 0). Along ri parian forests in boreal mixedwood forests, beaver activity can strongly affect deciduous tree survival. Tree mortality degradation processes can be altered by felling or flooding of live trees that do not show any sign of senescence (Naiman et al. 1986, Nummi and Kuuluvainen 20 13). Linear retention strips are generally vulnerable to uprooting due to increased wind
exposure. Levels of downed woody debris tend to be greater at the edges of linear
habitats compromising standing dead wood recruitment (Ruel et al. 2001, La voie et
al. 20 12). Furthermore, uneven-aged forest tends to produce deadwood continually across diameter and degradation classes (Lee 1998, Stokland 2001). Deadwood
dynamics in a territory with even-aged management is not likely to follow such a
pattern; thus, sustainability of deadwood recruitment is not ensured. Persistence of
vertical and horizontal structure in linear retention may be jeopardized. ln addition to
directly affecting existing stand structure of living trees, a pulse in deadwood
recruitment following the creation of linear retention may reduce future recruitment.
Severa! studies have examined deadwood in dispersed and grouped forest retention in
clearcut landscapes (Cline et al. 1980, Bebber et al. 2005, Bladon et al. 2008, Lavoie
et al. 2012, Urgenson et al. 20 13), and in linear retention (Mascarua L6pez et al.
2006, Braithwaite and Mallik 20 12). A better understanding of live and dead tree
dynamics, key drivers of vertical and horizontal heterogeneity of forests in linear
retention, is critical for evaluating whether these habitats can provide old forest
conditions with regards to standing decaying and dead wood over the long-term for organisms that are dependent on tree decay processes (Thorpe and Thomas 2007,
Moussaoui et al. 20 16). To do so we will evaluate how deadwood recruitment in
linear retention changes over time after harvesting.
We use a chronosequence approach to measure changes in stand structure and
deadwood recruitment in linear retention (cutblock separators and riparian buffers)
created over a period of 35 years. These habitats are situated in managed boreal
mixedwood and coniferous forest landscapes in northwestem Quebec characterised
by aggregated clearcuts. More specifically we (!) measure the main factors driving
deadwood recruitment, (2) document the vertical and horizontal structure of
deadwood components in these linear retention strips, and (3) evaluate the
sustainability of these habitats for long-term recruitment of standing deadwood of quality (dbh and decay classes) for biodiversity. We hypothesize that tree mortality
will be higher near the edges of linear retention, and that the orientation of retention strips will influence tree mortality. We predict that riparian buffers will be more
resistant to edge effects particularly with regards to uprooting, and that the
complexity of the vertical structure and long-term ability of these habitats to maintain old forests attributes will be higher than in cutblock separators.
1.2 METHODS
1 .2.1 Study Area
The study was conducted over a vast territory of the managed boreal forest in
northwestern Quebec in Abitibi and south of Nord-du-Quebec (78°30' - 79°30' W,
48° 00' - 50°00'N) (Figure 1.1) where two sub-bioclimatic domains meet: a
mixedwood ecosystem in the south, the balsam fir-white birch forest, and a
predominantly coniferous ecosystem in the north, the black spruce-feathermoss forest
(Saucier et al. 2003). The study region is located in the Northern Clay Belt, a major
physiographic region created by proglacial lake depositions of lakes Ojibway and
Barlow during the last glacial period (Vincent and Hardy 1977, Harvey and Leduc
1999). The region is characterized by a relatively flat topography; mean temperature
varies between 0°C and 2.5°C, annual precipitations between 800 and 900 mm and
the growing season lasts from 150 to 160 days (Harvey and Leduc 1999).
Following a maJor disturbance such as fire, the balsam fir-white birch forest is
initially dominated by shade-intolerant deciduous species such as trembling aspen
(Populus tremuloides) and white birch (Betula papyrifera) on mesic sites. Coniferous
species, balsam fir (Abies balsamea), white spruce (Picea glauca), black spruce
(Picea mariana) and northern-white cedar (Thuja occidentalis) gradually recruit into
the canopy as stands age (Bergeron and Dubuc 1989, Harvey et al. 2002). Natural
budworm and tent caterpillar (Morin et al. 1993, Cooke and Lorenzetti 2006). The fire cycle in the mixedwood part of the study area vary from 100 to more than 1000 years (Bergeron et al. 2001, Gauthier et al. 20 15b ); last major fi res occurred in 1760 and 1923 (Bergeron 1991, Dansereau and Bergeron 1993). Spruce budworm (Choristoneura fumiferana (Ciem.)) outbreaks are not as harmful as in the east of the province but are still a threat to balsam fir and, to sorne extent, black and white spruce (Bouchard et al. 2005). The last outbreak in this region occurred between 1972 and 1996 (Bouchard et al. 2005; Morin et al 1993). The forest tent caterpillar
(Malacosoma disstria (Hbn.)) affects growth and survival of trembling aspen and
other deciduous species. Outbreaks occur approximately every 10 years in this region, with the last major epidemie taking place in the late 1990's - early 2000's (Cooke and Lorenzetti 2006). Signs of an outbreak started to appear towards the end of our sampling season.
The black spruce-feathermoss forest is dominated by black spruce and jack pine
(Pinus banksiana) with a lower occurrence of balsam fir and intolerant deciduous
species (Gauthier et al. 2000). Fire cycle in this region vary from 600 to 800 years (Gauthier et al. 20 15b ), and mean area burnt is larger in the coniferous forest than the mixedwood forest (Bergeron et al. 2004b ). After fi re, wh en present in the buried forest, jack pine dominates the regenerating stand in association with black spruce (Harper et al. 2003). As stands age, paludification occurs on lowlands and flat sites. The process is an accumulation of organic matter associated with slow drainage, and resulting in limited access to nutrients in the mineral soil (Simard et al. 2007). These conditions provide competitive advantages black spruce that dominates stands (Gauthier et al. 2000). The relatively low presence of balsam tir diminishes the importance of spruce budworm in the black spruce forest, and hence, in the absence of fire, secondary disturbances such as wind-related death, diseases and senescence tend to influence stand dynamics and structure (Kneeshaw and Bergeron 1996, Gauthier et al. 2000, Harper et al. 2002).
The boreal forest is generally managed in an even-aged regime in which retention habitats such as island patches, riparian strips, and cutblock separators are left in or around large harvest blocks. Our study concentrates on these last two types of retention. According to Québec forest regulations, riparian strips must be at least 20
meters wide whereas cutblock separators can vary between 60 to 1 00 meters wide,
depending on the size of neighbouring even-aged eut areas (Quebec governernent,
20 15). The oldest cutover areas found with 1 inear retention in our study region were between 30 and 40 years old in the rnixed and coniferous forests, respectively (Figure
1.2).
1.2.2 Data Collection
Sites were selected a pnon us mg A reGIS software and digital forest inventory provided by the government of Quebec ( 1 :20 000). Site selection was based on tree species composition (trembling aspen as dominant in the mixedwood forest; black spruce as dominant species in the coniferous forest), soit type, drainage, canopy cover (2::60%) and stand age (2::80 years old). Further selection criteria were retention type (riparian strip or cutblock separator) and time of harvest of adjacent cuts. In the
balsam tir-white birch mixedwood bioclimatic zone, we sampled 14 cutblock
separators and 14 riparian strips, white 12 cutblock separators and 15 riparian strips were sampled in the black spruce-feathermoss zone. Sites were also selected to encompass the entire period in which aggregated clearcuts and linear retention were part of Quebec's management regime (Figure 1.2) (Quebec governrnent, 20 15). Each site was sam pied using three or four rectangular plots of 6 rn X 70 rn aligned parai lei to the linear retention, one along each edge and one or two in the middle of the strip depending on the width of the retention. Each plot was separated by 30 meters to ensure plot independence. Typically, riparian strips had one plot in the middle, one plot along the harvest edge and one plot along the stream side edge, whereas the
cutblock separators had two plots in the middle and one plot on each edge side of clearcuts.
Data collection on trees was conducted in the summer of 2015 and consisted of characterizing the structure of live trees, standing dead trees and downed coarse woody debris (CWD). For each standing stem (alive or dead) with a diameter at breast height greater than 9 centimeters (merchantable size), we noted tree species, diameter at breast height (dbh) and degradation stage based on lmbeau and Des rochers' (2002) classification system for conifers and an adapted version for deciduous trees. In addition, for standing dead trees, we noted height with a clinometer, stem state (whole or broken), abundance of branches and twigs and bark cover by visual inspection and wood penetrability by inserting a knife into the wood in severa( locations around the bole between 1 and 1.3 rn using the approach proposed by Angers et al. (20 12a).
Downed coarse woody debris data was collected the same summer following to the line-intercept method (Harmon and Sexton 1996). Line intercepts ran the full length of sample plots and were positioned parai lei to the retention strip on the inner side of edge plots or in the middle of center plots. The total length per site of line intercepts was 21 0 meters in ri parian strips and 280 meters in cutblock separators. Ali downed deadwood ~9 cm crossing the intercept was measured. Downed tree characteristics measured were: diameter at intercept (used for volume calculation), tree species, decay class using Desponts et al. (2002) classification system, length, state (uprooted, broken or beaver-related death), azimuth, wood penetrability, % bark cover and abundance of branches and twigs. Leaning dead trees were considered as downed deadwood if they formed an angle lower than 45° with the ground (Harmon and Sexton, 1996). Beaver marks on dead trees were also noted.
To determine the exact stand age, we sampled cores below one meter in 5 dominant trees per site in coniferous study sites and of 10 dominant trees per site in mixedwood sites. We also measured the organic layer thickness (cm) and the width of linear retention in the middle of every plot (m) (Table 1.1 ).
1.2.3 Volume calculation
Live stand volume was calculated using Fortin et al. (2007) mode!. To do so, we used Poulin and Messier (2006) equation for a dbh-height relationship because only dbh was measured in the field. Parameters for most species were established by previous
studies (Poulin and Messier 2006, Fortin et al. 2007, Ste-Marie 2009). However,
some less common species have never been subject to allometric studies, and in those
cases, we used the parameters of the most similar species (for instance, trembling
aspen's parameters were used for balsam aspen). Standing deadwood volume was
calculated depending on tree degradation class. Less degraded trees (classes 4 and 5) generally retain their branches and full height, therefore volume was calculated as for living trees (Fortin et al. 2007). For the more degraded dead trees (classes 6, 7 and 8),
the volume was calculated using a cylinder volume equation. Volume of downed
deadwood was calculated following the equation from Harmon and Sexton ( 1996):
(Diameter at intercept)2
v
=
9.869----'---'----'----.,..-8 · (Length of li ne sam pied)
1.2.4 Statistical analyses
Separate analyses were conducted on data from each bioclimatic zone. Recent
deadwood recruitment was characterized by summing earl y decay classes, of standing ( 4 and 5) and downed wood (9 and 1 0) (Table 1. 1 ). Angers et al. (20 12a) showed that decay class was a fairly good indication of time since death for the studied species. Because initial stand volume (ISV) represents living tree volume at the time of
creation of the linear retention, it is calculated by summing current living volume and recent recruitment deadwood volume. Ali statistical analyses were performed using R software (R core Team 2014).
1.2.4.1 Recent deadwood recruitment drivers
Model selection based on Akaike's information criterion was conducted to determine the factors associated with deadwood recruitment (Burnham and Anderson 2002). Stand age, initial stand volume (ISV) and the presence of beaver activity are important factors driving tree mortality (Sturtevant et al. 1997, Hély et al. 2000, Ferguson and Archibald 2002, Nummi and Kuuluvainen 2013, Moussaoui et al. 20 16); therefore, these factors were part of our basic model, a linear mixed effect model fit by maximum likelihood (Aitchison and Silvey 1957, Pinheiro et al. 2008). Sites were included as random effects due to our nested sampling design. Assumptions of normality and homoscedasticity were verified graphically; normality of random effects was also verified with a Shapiro test on intercepts. An extreme value (one plot) was identified in the mixed wood forest dataset and was thus removed with respect to these statistical assumptions. Square-root transformation was performed on the response variable to improve the residuals distribution. The additional factors tested in model selection were retention type, time since harvest (TSH), site width (SW), orientation (OR), plot location (PL: harvest edge, center, or stream side edge) and organic layer thickness (OL). Assumptions were again verified graphically to ensure the validity of every mixed effect linear model used in this analysis. The independence of the explanatory variables was verified using Pearson correlation. We built the best model by stepwise model selection, and model comparisons were made using the second-order Akaike information criterion (AICc) (Burnham and Anderson 2002). At first, we added every additional factor to our basic model separately, making six new models. If one factor improved the basic model (lower AICc), we made a second model selection with that new model and added a
second additional factor. We repeated these steps until adding a factor or interaction did not improve the mode!. A mode! was considered to improve the basic mode! if it diminished the A!Cc by 2 or more. The best mode! for each forest type was then examined to assess the effect of each variable on deadwood recruitment with unconditional 95% confidence intervals and P-value.
1.2.4.2 Effects of retention width
White tree mortality along edges of linear retention habitats has been documented (Mascarua L6pez et al. 2006), and is unlikely to differ with width of linear retention, this may not be the case for deadwood recruitment at the center of linear retention strips. A linear mixed effect mode! (Pinheiro et al. 2008) was used with the data subset containing only the middle plots to evaluate the influence of retention width influence on deadwood recruitment in the middle of our linear retention strips. Site was included as a random effect since two plots were sampled in the middle of each cutblock separator. Assumptions of normality and homoscedasticity were verified graphically, the normality of random effects was also verified with a Shapiro test on intercepts. A log transformation on recent deadwood volume, the response variable, was performed to improve the residuals distribution (log ( 1 +y)).
1.2.4.3 Spatial distribution of standing and downed deadwoods
Vertical and horizontal deadwood structure was assessed using the recent snag volume as a proportion of recent deadwood volume. Differences in the spatial distribution of snags were assessed by comparing the proportion measured in the middle and at the edges using ANOVA. Harvest edges were compared with the center of cutblock separators, whereas comparisons were made among stream side edge, harvest edge and center of ri parian buffer strips.
To evaluate the sustainability of standing deadwood recruitment in linear retention strips, we used Moussaoui et al (20 16) graphie approach of dead versus 1 ive volume in order to compare our sites with threshold values found in nearby natural forests.
1.2.4.5 Poplar in southern boreal mixedwood forests
Assessment of the sustainability of standing dead tree recruitment in the mixedwood
forest focused on poplar species (primarily trembling aspen, but including sorne
balsam poplar) in the form of standing dead trees with a large dbh (~20 cm), since
those are a deadwood component of primary importance for the cavity-using
community (Cadieux 20 Il, Ouellet-Lapointe et al. 2012, Nappi et al. 20 15). A
descriptive graphie analysis was performed using proportion of standing dead poplar
trees ~ 20cm dbh over the total number of poplar trees with dbh ~ 20cm. We
eliminated sites containing less than ftve large aspen stems to evaluate tree dynamics in aspen-dominated stands specifically. Rather than applying a threshold, we used range values (mean ± standard deviation) found in natural forests in the same study area (Y. Bergeron 's permanent plot data base in Lake Du parquet Forest). Mean (and sd values) proportion of standing dead poplar in natural forest stands was calculated from this database using aspen-dominated sites where stand age varied between 71 and 145 years old. This range was used as our "natural variability" and was plotted on
the descriptive graphie with our sample sites for comparison. Those that were found
outside of this natural variability showing an overproduction of deadwood could be
an indication of the next cohort taking over the stands (Bergeron and Dubuc 1989),
whereas sites below this natural variability would be deprived of this important
deadwood component, which is large standing dead trees. Investigation of the
diametrical distribution was also completed to better understand the stand stage and project future deadwood recruitment.
Live tree volume was plotted on the y-axis with a lower threshold of 100m3/ha under
which the mixedwood forest canopy is considered open and unproductive. Any site
below that threshold would not likely provide much deadwood in the long-term.
1.2.4.6 Black spruce in northern coniferous forests
The proportion of recent deadwood (recent deadwood volume relative to initial stand
volume) expected in the natural forest was calculated by incorporating black spruce
mortality rate and deadwood retention time of black spruce trees in the first degradation stages for the coniferous forest. Black spruce has a relatively constant mortality rate of 1-2 % per year (Lussier et al. 2002, Bouchard et al. 2005, Aakala et
al. 2007) and a persistence time in the first degradation stages ranging between 5 and
15 years (Angers et al. 20 12a). A proportion of recent deadwood volume exceeding a
maximum threshold of 30% would thus indicate long-term recruitment of dead trees in linear retention strips is not sustainable (Moussaoui et al. 20 16). Moreover, recent deadwood volume proportions exceeding this threshold value could potentially indicate a collapse of the linear retention towards an open canopy. Live volume threshold for the coniferous forest was set to 60 m3/ha (Moussaoui et al. 20 16). Mature stands dominated by black spruce with lower timber volumes generally have
open canopies and low productivity.
1.3 RESULTS
1.3.1 Recent deadwood recruitment drivers
Parameters included in the mode! selection analyses involved continuous (Table 1.1) and discrete (Table 1.2) variables. Stand age varied from 67 to 124 years old in the mixedwood forest and from 89 to 176 years old in the coniferous forest. Initial stand
volume and recent deadwood volume were higher in riparian buffer strips than in
was mainly below 10 cm in the mixedwood forest, and between 10 and 20 cm in the coniferous forest. Beaver occurrence was only observed in mixedwood riparian strips (Table 1.2). Retention type, orientation, and organic layer thickness did not have a significant influence on deadwood recruitment.
ln mixedwood linear retention sites, PL and TSH significantly improved our basic
model (Table 1.3). Recent deadwood volume was significantly lower in the center
(-2.55 ± 1.64) and along stream side edges (-2.04 ± 1.08) than along harvested edges.
Deadwood recruitment increased significantly with ti me since harvest (0.1 0 ± 0.08)
although high variability was observed in the first 20 years following harvesting (Figure 1.3). Linear regression slope was strongly influenced during the first two
decades whereas older sites did not appear to follow the same trend; i.e. lower
deadwood recruitment in third decade. Beaver occurrence and initial stand volume
also significantly increased recent deadwood volume as expected. ln contrast, stand age within the range covered in this study did not show a significant effect, indicating that our preliminary site selection design controlled weil for stand age differences (Table 1.1 ).
In the coniferous forest, beaver occurrence was not included in the base model due to
a weak occurrence white the other two base model parameters (stand age and initial stand volume) both increased significantly recent deadwood volume white. The best model in the coniferous forest included plot location as the only additional factor with a significant effect (Table 1.3). The center of linear retention habitats had lower recent deadwood volume than harvest edge ( 18.96 ± 9. 70) for both retention types, and than stream side edge (8.69 ±5.76) for riparian strips. An interaction between plot
location and initial stand volume (ISV) showed a significant decrease in ISV variable
effect on deadwood recruitment along stream side edge (ISVstream side edge = -0.03
deadwood recruitment, although a highly variable distribution pattern in the first two decades similar to that in the mixedwood forest was evident (Figure 1.3).
1.3 .2 Effects of retention width
Plots in the center of retention strips were at vanous distances from the edge, depending on site width. Riparian buffer strips were generally narrower with the center plot around 10 m from the eut; centers of cutblock separa tors ranged between 30 and 70 m from harvested edges. Site width had a significant effect on deadwood recruitment in the center of linear retention strips in mixedwood forests (P-value < 0.0001 ). Cutblock separators wider than 100 m showed a reduced recent deadwood volume at their center, whereas narrower sites (<SOm) had about twice as much the recent deadwood volume in their center (Figure 1.4). ln the coniferous forest, the range of site width was lower with the maximum around 100 m (Table 1.1 ). The effect of retention width was marginal (P-value = 0.0634), but the trend was similar to that of mixedwood but with a softer slope. Recent deadwood volume was in general lower in coniferous forest (Figure 1.4).
1.3.3 Spatial distribution of standing and downed deadwood
In mixedwood retentions, cutblock separators showed a significantly higher proportion of snags in the center (mean = 0.43) than along harvested edges (mean = 0.13) (P-value = 0.00278) (Figure 1.5). However, variability was greater in the center of cutblock separators. Converse! y, no significant difference in the spatial distribution of standing and downed deadwood was apparent across riparian buffer strips in mixedwood forests (Figure 1.5). Although mean recent deadwood volume was slightly higher in this retention type compared to cutblock separators (Table 1.1 ), snag proportion was low on both edges (harvest, 0.079 and stream side, 0.16) and in the center (0.091 ), indicating a greater abundance of downed deadwood.
ln coniferous forests, both retention types showed a significantly higher contribution of snags to recent deadwood volume in the center than along the harvest edges (Figure 1.5). However, the difference was stronger in cutblock separators than in riparian strips (P-value = 00029, and P-value = 0.0426 respectively). The proportion of snags in stream side edges was similar to what is found in the center of riparian strips. The contribution of snags to overall deadwood recruitment was highest in the center of cutblock separa tors (snag mean proportion of 0.61 ); followed by the center of riparian strips (0.28), cutblock separator harvest edges (0.25), riparian edges (0.25), and harvest edges of ri parian strips (0.12).
1.3.4 Long-term sustainability for deadwood recruitment
1.3.4.1 Poplar in southern boreal mixedwood forests
Sites in the mixedwood forest presumably had enough living tree volume to ensure the maintenance of closed canopy conditions since standing live tree volumes were above the threshold of 100 m3/ha (Figure 1.6). lndeed, most sites contained high living tree volumes with values over the 200m3/ha. Many sites were within the range of natural variability of large standing dead poplar tree proportions (trembling aspen and balsam poplar). Few sites were above this natural variability (MS04, MS06, MS 10 and MS Il). The ir tree diametrical distribution showed living pop lars were still present and mainly in larger diameter classes whereas small diameter classes were essentially represented by coniferous species (Figure 1. 7). MS04 and MS Il a Iso showed a limited amount of small diameter trees whereas MS 10 and MS06 had a good understory of conifer established in the stand. Six sample sites were removed from this analysis because they had Jess than 5 dominant aspen trees.
Severa( sites could, however, be considered outside of the natural variability range for the proportion of large standing dead poplar trees (MB02, MB06, MB08, MSOI and
MS07, Figure 1.6). Ail showed a tree diametrical distribution in which poplars were present in every diameter class (Figure 1. 7). MS07 was composed essentially of the initial cohort of poplars in every class, whereas other sites had a certain amount of coniferous stems in smaller diameter classes which would indicate a transition phase towards eventual conifer canopy dominance. MB02, MSO 1 and MS07 had severa! aspen stems in the larger diameter classes. Younger stands with low values of large deadwood stems certainly show a long-term potential for both closed canopy and future deadwood recruitment.
1.3.4.2 Black spruce in northern coniferous forests
Ail sites showed standing live tree volumes above the threshold of 60 m3/ha indicating they ali have a fairly closed canopy. Regardless of time since harvest, canopy closure in these linear retention habitats was not altered when compared to natural forests. The majority of sites were also under the threshold value of 30% for the proportion of recent deadwood for a stand to maintain its recruitment in the future (Figure 1.8). Tree mortality due to the edge creation was not excessive in linear retention compared with continuous natural forest stands.
Among sites with a recent deadwood proportion over the 30% threshold, most were close to the li ne (PB Il, PS07, PB09 and PB08, Figure 1.8) and their sustainability for deadwood production could be of concern. Tree diametrical distribution showed a truncated normal distribution in most of the sites, thus, ostensibly, ensuring tree recruitment in a longer term (Figure 1. 9). However, sites with higher proportions of deadwood showed low tree recruitment. PB08 and PB09 were the most threatened riparian strips in terms of continuous deadwood recruitment with the lowest living tree volume and a low number of stems in every diameter class (Figures 1.8 and 1.9).
1.4 DISCUSSION
Our ftrst objective intended to determine the main factors influencing tree mortality in Québec's forest retention system of linear habitats in aggregated even-aged harvested landscapes. Besides our base model parameters (stand age, initial stand
volume, and the presence of beaver activity), the spatial location within linear
habitats and time since harvest influenced signiftcantly deadwood volume in the mixedwood ecosystem. Contrary to other studies, we did not find any influence of orientation of the linear retention in the landscape (DeWalle 1983, Ruel 1995). Linear retention strips encountered important tree mortality after their creation by even-aged harvests, regardless of wind direction. Contrarily to our prediction, we did not ftnd
signiftcant differences in deadwood volume between cutblock separators or riparian
buffers suggesting that both habitats maintained old forest decaying and deadwood attributes through time. One difference observed between retention types was the absence of influence of initial condition in riparian buffers. ln fact, initial stand conditions are reported as being a major factor driving deadwood volume after harvest (Riopel et al. 2010, Moussaoui et al. 20 16), but they did not have an important influence on mortality in stream side edges of riparian strips in the
coniferous forest. Recent deadwood volume did not vary with live tree density
indicating that trees in this situation were not vulnerable to greater opening.
ln contrast to mixedwood forests, stand age in coniferous forests covered a range
wide enough to detect an age effect. A priori determination of stand age in coniferous
forest is Jess precise than in the mixedwood forest, mainly due to Jess sharp transition between successional stages (Bergeron and Dubuc 1989, Gauthier et al. 2000, Pothier et al. 2004).
1.4.1 Spatial distribution and vertical structure
Wind damage of trees was gradually reduced with distance from clearcut edge.
Higher recent deadwood volume measured in harvest side forest edges corroborated
other edge effect studies (Burton 2002, Harper et al. 2002, 2004, Mascarua L6pez et al. 2006, Braithwaite and Mallik 2012, Dupuch and Fortin 2013). Such mortality can be caused by a drastic change in abiotic factors, particularly wind exposure,
decreased humidity combined with greater evapotranspiration and increased light
penetration (Ranney et al. 1981, Kapos 1989, Chen et al. 1992, Esseen 1994, Murcia
1995, Laurance et al. 1998). We also observed low recruitment of un broken standing
dead trees along clearcut edges. Mortality mostly occurred by uprooting or stem
breakage, providing an over-representation of downed deadwood. Wind damage was
Jess evident in the center of linear retention strips, especially in cutblock separators with larger retention widths (60 - 100 rn), th us allowing for a longer retention of standing deadwood. Low occurrence of snags across riparian buffers reported by Harper ( 1999), Harper and Macdonald (200 1 ), and Mascarua L6pez et al. (2006) has
been attributed to the adapation of stands to openings created by local natural
disturbances occurring in riparian ecotones. However, results from our study differ in that riparian buffers had a slightly higher amount of deadwood volume than cutblock separators (Table 1.1 ). However, centers of ri parian strips in the mixedwood ecosystem did not show a higher proportion of snags suggesting a relatively
homogeneous effect of wind ex po sure throughout the retention strips.
The coniferous forest seemed to be better adapted to openings since snags proportion
was generally greater in strip centers than edges for both retention types. This could be due to the biology of the dominant tree species: according to Angers et al, (20 1 0),
trembling aspen and balsam tir are more susceptible to stem breakage when exposed
to strong winds, whereas black spruce and jack pine snags tend to stay intact for a longer period. Susceptibility to pathogens can also explain the greater occurrence of
downed dead wood in mixedwood forests. For instance, balsam fir is vulnerable to but and root rots (Whitney, 1989), thus more susceptible to uprooting (Lavoie et al.
20 12). Whereas trembling aspen is susceptible to hearth rot, which promotes stem
breakages (Hale and Pastor 1998, Siitonen 2001) Therefore, such vertical deadwood
structure is more fragile in the mixedwood forest ecosystem. We did not include
standing broken stems in this analysis as they are classified in advanced degradation stages and could have been present before the eut. However, this type of deadwood can contribute to vertical structure, and therefore increase the availability of standing
dead trees in the mixedwood ecosystem.
1.4.2 Retention width and core mortality
The center of wider linear retention habitats (cutblock separators) had less recent
deadwood volume. This relationship was signiticant in the mixedwood forest where
the range of widths was larger than in the coniferous forest. There was a reduction in
mortality until width was at !east 100 meters (see Figure 1.4), which means a
minimum distance of 50 meters from the harvest area. This corroborates Harper and
Macdonald (2002) findings for the aspen-dominated boreal forest where higher
deadwood volume was observed within 5 to 40 meters from harvest edges, and
Burton's (2002) study in the sub-boreal forest of western Canada, where edge effect on tree mortality reaches 55 to 60 meters. The convergence of results among regions suggests that linear retention in the Canadian mixedwood boreal forest should be at !east 1 00 meters wide to ensure a core area with structural features of interior forests.
ln the coniferous forest, these trends were similar although not significant. This could be caused by the absence of very large cutblock separators, our largest sample sites
were about 100 meters wide. However, tree mortality and accumulation of deadwood
as a result of edge creation have been reported to extend to a shorter distance of 5 to