Development of nanostructure photocatalysts based
perovskite and carbon nitride materials for CO2
reduction and H2 production using solar energy
Thèse
Nhu Nang Vu
Doctorat en génie chimique
Philosophiæ doctor (Ph. D.)
Development of nanostructure photocatalysts based
perovskite and carbon nitride materials for CO
2reduction and
H
2production using solar energy
Thèse
Nhu-Nang Vu
Sous la direction de :
Trong-On Do, directeur de recherche
Serge Kaliaguine, codirecteur de recherche
Résumé
Cette thèse passe en revue la production de carburant à partir d’énergie solaire de H2O et de
CO2 à l'aide d'un photocatalyseur, ce qui est considéré comme l'une des solutions les plus
prometteuses pour la lutte contre le réchauffement climatique et la crise du carburant. Cette thèse propose quatre nouvelles approches pour développer des photocatalyseurs nanostructures efficaces pour la réduction photocatalytique du CO2 et la production de H2.
L’absorption de la lumière, la séparation des charges et les réactions de surface sont des aspects critiques qui ont un impact énorme sur la photoréduction du CO2 et la production
photocatalytique de H2. Le g-C3N4 et les matériaux pérovskites sont des candidats appropriés
pour ces processus, car ils offrent des caractéristiques structurelles et des propriétés exceptionnelles. Un grand nombre de photocatalyseurs nanostructures sont actuellement développés pour la photoréduction du CO2 et la production photocatalytique de H2. Les
nanostructures 2D et les nanocomposites hétérostructures sont largement étudiés en raison de leurs excellentes propriétés telles que la séparation efficace et la longue durée de vie des porteurs de charge. De manière prometteuse, les nanostructures 2D et les nanocomposites des matériaux g-C3N4 et pérovskites présentent d'excellentes performances
photocatalytiques, selon la littérature scientifique.
Des nanofeuilles de pérovskite HCa2Ta3O10 réduites et des nanocomposites à
hétérostructures g-C3N4/CdS sont des photocatalyseurs développés pour la photoréduction
du CO2 sous la lumière du soleil. Les nanofeuilles de pérovskite HCa2Ta3O10 réduites sont
préparées à partir de la pérovskite en couches CsCa2Ta3O10 par une méthode d'échange d'ions
simple couplée à un traitement sous H2. Elles présentent une surface très élevée et une
meilleure absorption de la lumière solaire. Leur large bande interdite est considérablement rétrécie par une introduction considérable de Ta+4 et de lacunes d'oxygène. En tant que
support des nanoparticules de Pt et CuO, les nanofeuilles réduites présentent une activité photocatalytique de réduction du CO2 améliorée avec formation principale d'éthanol. Le
nanocomposite g-C3N4/CdS hétérostructure est synthétisé par une méthode avancée
développée par notre groupe en utilisant les gazes NH3 et H2S sous une haute pression créée
la structure C3N4 modifiée. Le nanocomposite synthétisé comporte un C3N4 poreux lié aux
nanoparticules CdS via le pont C-S-Cd. La structure est particulière avec la présence de nanoparticules de CdS qui favorise une photoréduction améliorée du CO2 sous la lumière du
soleil avec une sélectivité élevée de production de CO.
Les nanofeuilles et nanofragments de g-C3N4 sont synthétisés par de nouvelles approches en
tant que photocatalyseurs pour la production de H2. Le complexe supramoléculaire de
mélamine et d’acide cyanurique (MCS) avec une structure lamellaire condensée est synthétisé pour la première fois dans un autoclave à haute pression en tant que précurseur riche en N. La structure particulière du complexe MCS permet la formation directe de nanofeuilles g-C3N4 avec une surface spécifique élevée et une absorption de lumière
significativement améliorée dans la région visible par le processus de traitement thermique à basse température. Les nanofeuilles telles que préparées peuvent générer un taux de production de H2 élevé en utilisant le spectre lumineux étendu à 550 nm avec une efficacité
quantique élevée de 3,5%. Il est intéressant de noter que la préparation du complexe MCS induit une haute pression de NH3 et H2O, qui peut fracturer sélectivement la structure de
C3N4 pour former des nanofragments avec une cristallinité élevée et des groupes fonctionnels
abondants (-OH et -NH2). Les nanofragments préparés présentent des caractéristiques
supérieures telles que la séparation et le transfert rapides des charges avec un excellent entraînement de charge, un niveau de bande de conduction élevé et une meilleure adsorption et activation des protons. Ils présentent une production photocatalytique exceptionnelle de H2 sous la lumière du soleil, avec un rendement quantique de 12,3% à 420 nm.
Abstract
The thesis, herein, reviews solar-fuel production from H2O and CO2 using photocatalysts,
which is considered as one of the most promising solutions to tackle global warming and fuel crisis. Importantly, this thesis provides four novel approaches to develop efficient nanostructured photocatalysts for both photocatalytic CO2 reduction and H2 production.
Light-harvesting, charge separation, and surface reactions are critical aspects that have an enormous impact on the CO2 photoreduction and photocatalytic H2 production. g-C3N4 and
perovskite materials are suitable candidates for these processes as they offer outstanding structural features and properties. A large number of nanostructured photocatalysts are currently developed for both CO2 photoreduction and photocatalytic H2 production. 2D
nanostructures and nanocomposite heterostructures are widely studied because of their excellent properties such as efficient separation and long lifetime of charge carriers. Promisingly, 2D nanostructures and nanocomposites of the g-C3N4 and perovskite materials
exhibit excellent photocatalytic performance, according to literature studies.
Reduced HCa2Ta3O10 perovskite nanosheets and g-C3N4/CdS heterostructure nanocomposite
are developed photocatalysts for the CO2 photoreduction under sunlight. Reduced
HCa2Ta3O10 perovskite nanosheets are prepared from the layered perovskite CsCa2Ta3O10 by
a simple ion-exchange method coupled with the H2 treatment. They exhibit very high surface
area and improved sunlight absorption. Their wide-bandgap is significantly narrowed by a considerable introduction of Ta+4 and oxygen vacancies. By the support of deposited Pt and CuO nanoparticles, the reduced nanosheets exhibit an enhanced photocatalytic CO2 reduction
activity with the primary formation of ethanol. g-C3N4/CdS heterostructured nanocomposite
is synthesized by an advanced method developed by our group employing an in-situ-created high-pressure of NH3 and H2S. It fractures the carbon nitride framework, simultaneously
creating CdS nanoparticles (NPs) on the surface of the modified C3N4 structure. The prepared
nanocomposite contains a porous C3N4 structure in intimate contact with CdS nanoparticles
via the C-S-Cd bridge. The distinctive structure with the presence of CdS nanoparticles favors an enhanced sunlight-driven photoreduction of CO2 with high selectivity toward CO.
g-C3N4 nanosheets and nanofragments are synthesized by novel approaches as photocatalysts
for the H2 production. Highly condensed lamellar melamine–cyanuric acid supramolecular
(MCS) complex is synthesized, for the first time, in an autoclave at high pressure as the N-rich precursor. The distinctive structure of the MCS complex allows the direct formation of g-C3N4 nanosheets with high specific surface area and significantly enhanced light
absorption in the visible region under low-temperature thermal treatment. The as-prepared nanosheets can generate a remarkable H2 productionrate under the light spectrum extending
to 550 nm with a high quantum efficiency of 3.5%. Interestingly, the preparation of the MCS complex induces a high-pressure of NH3 and H2O, which can fracture the C3N4 framework
selectively to form nanofragments with high crystallinity and rich functional groups (-OH and -NH2). The prepared nanofragments display superior features such as rapid charge
separation and transfer with excellent charge drive, high conduction band (CB) level, and improved proton adsorption and activation. They exhibit an outstanding photocatalytic H2
Table of content
Résumé ... iii
Abstract ... v
Table of content ... vii
List of figures ... xii
List of Tables ... xxi
List of abbreviations ... xxii
Acknowledgments ... xxiv
Foreword ... xxv
Introduction ... 1
1.1. General introduction ... 2
1.2. Objectives of the thesis ... 4
1.3. Outline of the thesis ... 5
Chapter 2: Literature review ... 7
2.1. Fundamentals of photocatalysis on semiconductors ... 8
2.2. Band structure of photocatalysts ... 9
2.3. Charge separation and transfer... 11
2.3. Surface reaction ... 13
2.3.1. CO2 reduction ... 13
2.3.2. H2 evolution... 18
2.3.3. Oxidation reaction ... 20
2.4. Perovskite and carbon nitride (g-C3N4) materials for the CO2 photoreduction and the H2 production ... 22
2.4.3. g-C3N4 material ... 27
2.5. Recent advances in nanostructure design of photocatalysts for CO2 photoreduction and H2 production ... 33
2.5.1. Current approaches for nanostructure design of photocatalysts ... 33
2.5.2. Nanostructure design for the CO2 photoreduction ... 38
2.5.3. Nanostructure design for the photocatalytic H2 production ... 74
2.6. Photoreactors for CO2 photoreduction and photocatalytic H2 production ... 106
2.7. Summary and outlook ... 111
Chapter 3: Characterizations ... 113
3.1. Introduction ... 114
3.2. X-Ray diffraction ... 114
3.3. Electron microscopy ... 115
3.4. X-ray photoelectron spectroscopy ... 116
3.5. Fourier transform infrared (FT-IR) spectroscopy ... 118
3.6. Nitrogen physisorption analysis ... 118
3.7. Ultraviolet-Visible (UV-Vis) spectroscopy ... 121
3.8. Photoelectrochemical analysis ... 122
3.9. Gas chromatography ... 123
Chapter 4: Reduced Cu/Pt-HCa2Ta3O10 perovskite nanosheets for sunlight-driven conversion of CO2 into valuable fuels ... 125
Résumé ... 126
Abstract ... 127
4.1. Introduction ... 128
4.2.1. Synthesis and characterization ... 129 4.2.2. Photocatalytic activity ... 138 4.3. Mechanism of CO2 photoreduction ... 143 4.4. Conclusion ... 147 4.5. Experimental ... 148 4.5.1. Synthesis of catalyst ... 148 4.5.2. Characterization ... 149 4.5.3. Photocatalytic test ... 149 Acknowledgements ... 150 4.6. Supplementary Information ... 151
Chapter 5: Synthesis of g-C3N4/CdS nanocomposite with chemically bonded interface for enhanced sunlight-driven CO2 photoreduction ... 156
Résumé ... 157 Abstract ... 158 5.1. Introduction ... 159 5.2. Experimental Section ... 161 5.2.1. Materials ... 161 5.2.2. Synthesis of bulk g-C3N4 ... 161 5.2.3. Synthesis of g-C3N4/CdS nanocomposite ... 161
5.2.4. Synthesis of complex co-catalyst ... 162
5.2.5. Characterization ... 162
5.2.6. Photocatalytic test ... 162
5.3. Results and discussion ... 163
Acknowledgment ... 181
5.5. Supporting information ... 181
Chapter 6: Synthesis of g-C3N4 Nanosheets Using Highly Condensed Lamellar Crystalline Melamine-Cyanuric Acid Supramolecular Complex for Enhanced Solar Hydrogen Generation ... 189
Résumé ... 190
Abstract ... 191
6.1. Introduction ... 192
6.2. Results and discussion ... 194
6.2.1. Formation of the highly lamellar melamine–cyanuric acid supramolecular complex ... 194
6.2.2. Thermal polycondensation of MCS to carbon nitride nanosheets and their post‐ calcination in the air ... 200
6.2.3. Photocatalytic hydrogen production... 213
6.3. Conclusion ... 217
6.4. Experimental Section ... 218
6.4.1. Materials and reagents ... 218
6.4.2. Synthesis of carbon nitride nanosheets ... 218
6.4.3. Characterization ... 219
6.4.4. Photocatalytic test ... 219
6.4.5. Photoelectrochemical measurement ... 220
Acknowledgment ... 221
6.5. Supporting information ... 221
Chapter 7: Selective fragmentation through C-N bond cleavage of carbon nitride framework for enhanced photocatalytic hydrogen production ... 232
Abstract ... 234 7.1. Introduction ... 235 7.2.1. Materials ... 237 7.2.2. Synthesis of photocatalyst ... 237 7.2.3. Material characterization ... 238 7.2.4. Photocatalytic evaluation ... 238 7.2.5. Photoelectrochemical characterization ... 239
7.3. Result and discussion ... 239
Acknowledgment ... 256
7.5. Supporting information ... 256
General conclusion and Future outlook ... 265
8.1. General conclusion ... 266
8.2. Future outlook ... 268
References... 271
List of publications and presentations ... 329
Publications ... 329
List of figures
Figure 2.1. Schematic illustration of photocatalysis over the semiconductor. ... 8
Figure 2.2. The sunlight spectrum and solar energy distribution. Heat Island Group, Lawrence Berkeley National Laboratory Heat Island Group, Lawrence Berkeley National Laboratory. ... 10
Figure 2.3. Schematic of charge separation and transfer in a photocatalyst... 12
Figure 2.4. Surface reduction of CO2 in the presence of water as an electron donor. ... 14
Figure 2.5. Three proposed mechanisms for CO2 reduction. ... 15
Figure 2.6. (a) Monodentate and (b) bidentate modes of the CO2 molecule with surface atoms of metal oxide photocatalyst. ... 17
Figure 2.7. Hydrogen evolution occurring on the surface of an electrode in acidic media. 19 Figure 2.8. Crystal structure of perovskite materials with ABO3 formula (Yellow sphere: A-site, red sphere: oxygen; B-site located in the center of the dark green octahedron). ... 23
Figure 2.9. Structure of several typical layered perovskite materials, (a) Aurivillius, (b) Ruddlesden Popper, (c) (111) layered, and (d) (110) layered perovskites (red spheres: oxygen; blue spheres: A‐site element; gray octahedron: B‐site element). ... 25
Figure 2.10. Band structures of various perovskite and oxynitride (N-doped) perovskite photocatalysts in comparison with reduction potentials of CO2 and H2O reduction... 26
Figure 2.11. (a) Layered structure of g-C3N4 with sheets constructed by polymeric integration of tri-s-triazine (melem) units, (b) Hydrogen bonds of nearby blocks within the basal plane of C3N4 sheet... 27
Figure 2.12. UV-Vis spectrum of g-C3N4 prepared from dicyanamide. Inset shows a photo of the prepared g-C3N4. ... 29
Figure 2.13. (a) Synthetic procedure for the in-plane (Cring) copolymerized C3N4, (b) Charge carrier transfer in (Cring) copolymerized C3N4, Lpc and τn: diffusion length and lifetime. ... 31
Figure 2.14. Impact of particle size on electron-hole separation. ... 33
Figure 2.15. Schematic illustration of electron transfer in co-catalyst deposited photocatalyst system. ... 35
Figure 2.16. Band structure and the electron-hole separation in heterostructural photocatalyst. ... 36
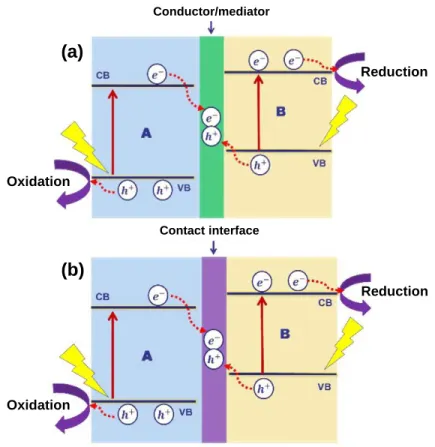
Figure 2.17. Schematic diagram of charge separation and transfer in a Z-scheme system: (a)
Z-scheme structure containing conductor/mediator and (b) direct Z-scheme structure. ... 37
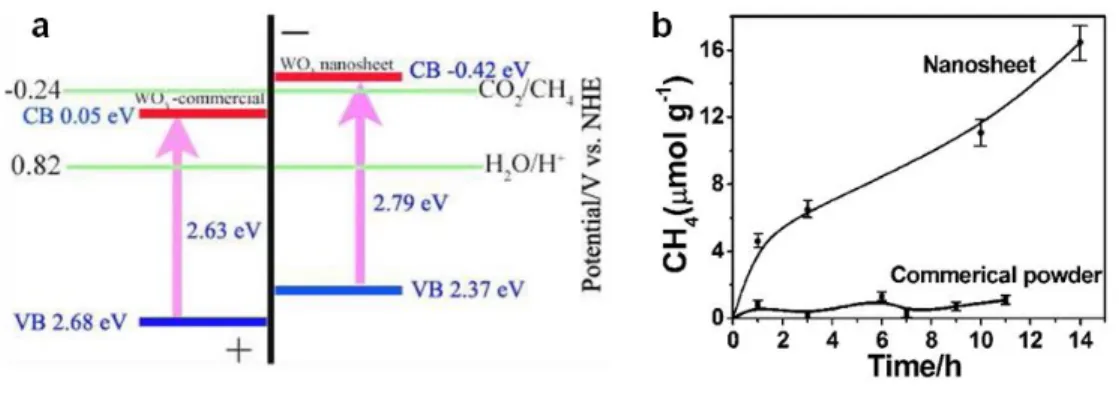
Figure 2.18. (a) Calculated band positions of WO3 nanosheets and commercial WO3,
relative to the redox potential of CO2/CH4 in the presence of water; (b) CH4 generation over the
nanosheets and commercial powder as a function of visible light irradiation time (λ > 420 nm). ... 39
Figure 2.19. Schematic illustration of the photocatalytic process for H2 evolution and
CO2 reduction on the In2O3–g-C3N4 nanohybrids. ... 41 Figure 2.20. (a) Schematic illustration of the synthetic process of hierarchical
NC@NiCo2O4 double-shelled nanoboxes. (I) PDA coating, (II) annealing under an
N2 atmosphere and acid etching, and (III) growth of NiCo2O4 nanosheets; (b–d) FESEM and
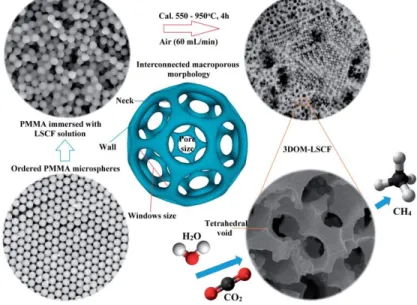
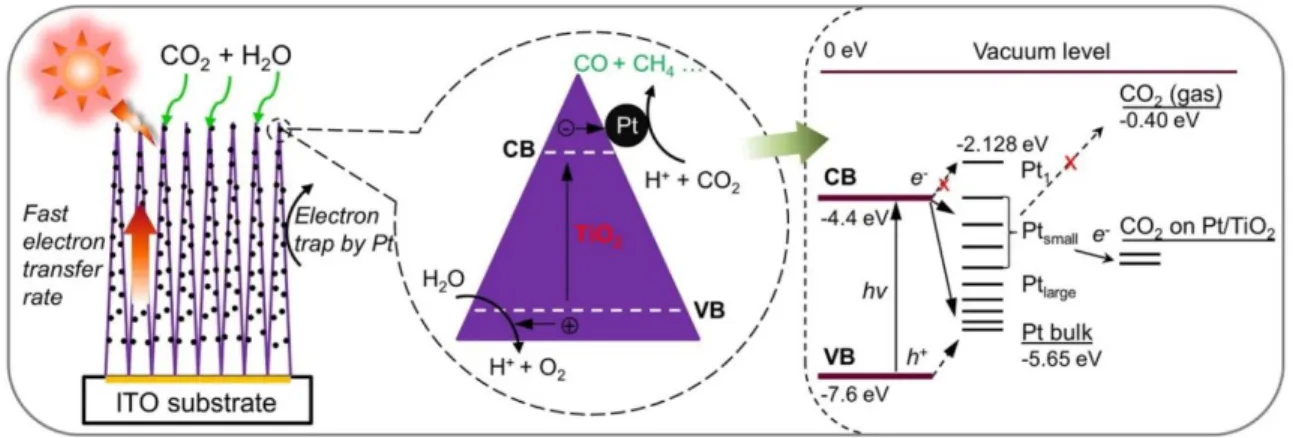
(e–g) TEM images of hierarchical NC@NiCo2O4 double-shelled nanoboxes. ... 44 Figure 2.21. Schematic illustration of the synthesis route of the 3DOM-LSCF catalyst. ... 46 Figure 2.22. Schematic diagram of CO2 photoreduction mechanism by using Pt-TiO2
nanostructured films. The magnified circle (center) shows the electron-hole generation and transfer inside a TiO2 single crystal. The right side of the figure illustrates the energy levels
of the Pt-TiO2–CO2 system. ... 51 Figure 2.23. (a) UPS-determined work functions of GO and Cu/GO hybrids and (b)
band-edge positions of pristine GO and Cu/GO hybrids in comparison with CO2/CH3OH and
CO2/CH3CHO formation potential. (c) Schematic photocatalytic reaction mechanism.
Samples Cu/GO-1, Cu/GO-2, Cu/GO-3 contains Cu contents of 5, 10, and 15 wt%, respectively. ... 55
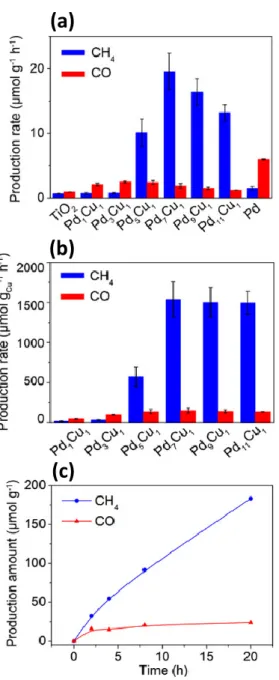
Figure 2.24. (a) Average production rates of CH4 and CO in photocatalytic CO2 reduction
by bare TiO2, Pd/TiO2, and Pd-Cu/TiO2 with various Pd-Cu molar ratio, (b) Average
production rates of CH4 and CO calculated by the amounts of Cu atoms, (c) Time-dependent
production of CH4 and CO in photocatalytic CO2 reduction with H2O by Pd7Cu1/TiO2. .... 60 Figure 2.25. The photocatalytic CO2 reduction over core–shell-structured Pt@Cu2O loaded
TiO2. ... 61 Figure 2.26. Schemes of (a) the MnOx@TiO2@CuPt alloy mesoporous hollow sphere
structure and (b) the mechanism of the photocatalytic CO2 reduction. ... 64 Figure 2.27. Mechanism of CO2 capture and reduction on the surface of Pr/Pt-Ga2O3
photocatalyst. ... 66
Figure 2.28. Schematic illustration of the process of charge transfer and CO2 reduction in
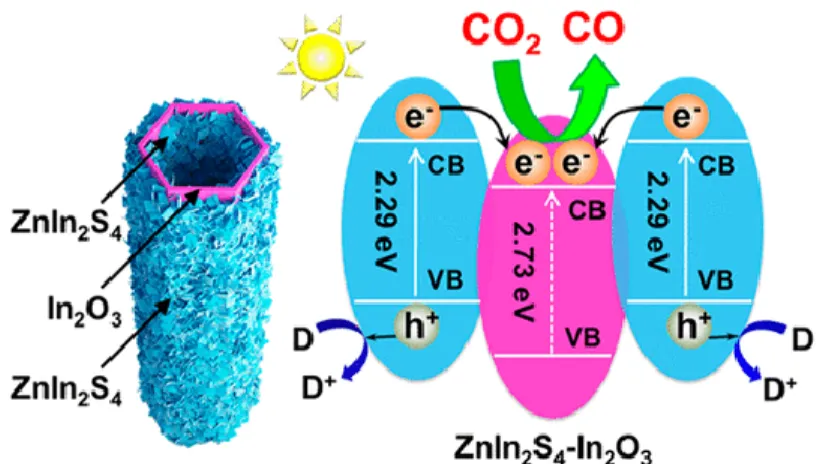
Cu2ZnSnS4/TiO2 heterostructures. ... 67 Figure 2.29. Sandwich-like hierarchical tubular heterostructure and the electron separation
Figure 2.30. (A) Morphology of BVO/C/Cu2O NWAs; (B) Structural effect on the
photocatalytic CO2 reduction activity (the inset shows SEM images of the Cu2O mesh and
Cu2O NWAs); (C) Schematic of electron transfer in BVO/C/Cu2O NWAs. ... 70 Figure 2.31. Schematic of the charge transfer and separation in the CdS–WO3 Z‐scheme
photocatalytic system under visible light irradiation. ... 71
Figure 2.32. SEM image (a, b) and schematic illustration (c) of the sandwich like G/TiO2 316.
... 73
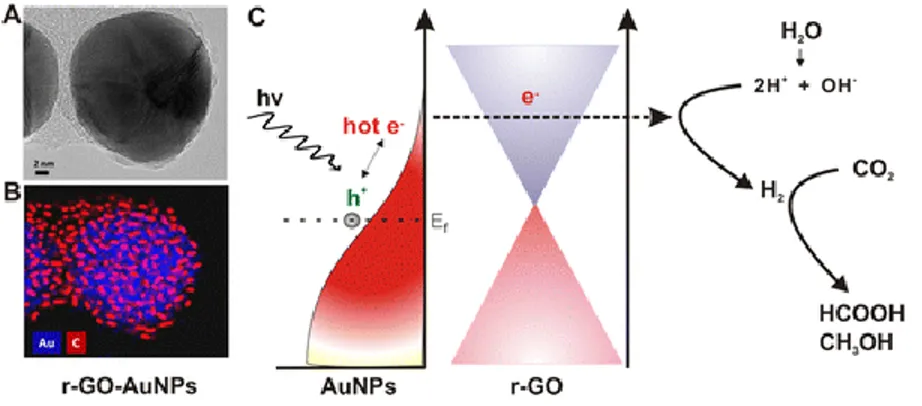
Figure 2.33. Schematic of graphene-coated gold nanoparticles for CO2 photoconversion. (A)
HR-TEM image. (B) Energy-dispersive X-ray mapping image of r-GO–AuNPs (Au (blue), carbon (red)). (C) Schematic representation of hot-electron generation and the role of the graphene layer as an efficient electron acceptor and transporter in generating hydrogen and subsequent conversion of CO2 into formic acid (HCOOH) and methanol (CH3OH). ... 74 Figure 2.34. Formation of the surface heterojunction and the charge transfer in the TiO2 NSs
with co-exposition of (001) and (110) facets. ... 75
Figure 2.35. De-polymerization mechanism of the C3N4 framework during the alkali etching.
... 78
Figure 2.36. (a) Synthetic procedure for the preparation of the surface-disorder-engineered
TiO2 photonic crystal (PC), (b) Reflectance spectra of the TiO2 PCs (solid lines) and
absorbance spectrum of the reference anatase TiO2 (dashed line), (c) Hydrogen evolution rate
of TiO2 PCswith varied void sizes. ... 80 Figure 2.37. The reduction of Ni(NO3)2 on the TiO2 surface followed by the H2 production
under the light illumination. ... 84
Figure 2.38. (a) TEM image of Ni(OH)2 modified CdS NRs, (b) Comparison of the
photocatalytic activity with different contents of Ni(OH)2 (0 – 100 %) for the photocatalytic
H2 production. ... 86 Figure 2.39. (a) The procedure for gas‐phase sulfidation and (b) The rate of H2 evolution
over g-CN loaded with different amounts of MoS2 or Pt. ... 89 Figure 2.40. (a, b) TEM (c), and HRTEM images of CuS/ZnS photocatalyst with CuS
content of 2 %, (c) Mechanism of the photocatalytic H2 production with photoinduced
interfacial charge transfer (IFCT). ... 91
Figure 2.41. (a) TEM image of La-doped NaTaO3 single-particle (NaTaO3:La), (b)
Mechanism of surface reactions in the presence of NiO NPs. ... 93
Figure 2.42. Surface reactions on Rh/Cr2O3 core-shell, Rh, and Cr2O3 NPs loaded
(Ga1−xZnx)(N1−xOx). ... 94 Figure 2.43. Schematic formation of the hollow Fe2O3–TiO2–PtOx nanocomposite. ... 96
Figure 2.44. Schematic illustration of the charge transfer in CdS–TiO2–Ni nanocomposite in
the photocatalytic H2 production. ... 97 Figure 2.45. (a) Preparation of the SrTiO3:La, Rh/Au/BiVO4:Mo sheet by the particle
transfer method, (b) Mechanism of the overall water splitting over Ru-SrTiO3:La,
Rh/Au/BiVO4:Mo-RuOx, (c) Dependence of the overall water splitting photoactivity on the
annealing temperature... 100
Figure 2.46. (a) TEM image of TiO2/NiS core-shell nanocomposite, (b) Charge transfer and
separation following the Z-scheme mechanism in the TiO2/NiS nanocomposite. ... 102 Figure 2.47. Charge transfer mechanism in the CdS/ ZnO/GO ternary system. ... 105 Figure 2.48. (a) Design of optical fiber reactor consisting of TiO2-coated optical fibers and
(b) light transmission of an optical fiber coated with TiO2 layer. ... 108 Figure 2.49. Design of honeycomb monolith reactor with the light propagation in a monolith
channel. ... 109
Figure 2.50. Design of polymeric membrane reactor for the H2 generation. ... 110 Figure 3.1. Schematic illustration of Bragg’s law………...115 Figure 3.2. Process of the electron emission and transmission upon the interaction of electron
beam with solid matter. ... 116
Figure 3.3. Photoemission process of core-level electrons in 1s orbital. ... 117 Figure 3.4. Representative illustration of the isotherm plot types. ... 119 Figure 3.5. (A) UV-Vis spectrum and (B) Kubelka–Munk function curve with the estimated
bandgap of g-C3N4. ... 121 Figure 3.6. (A) Basic setup for a photoelectrochemical (PEC) analysis, (B) Typical Nyquist
plot (Metrohm – Autolab EIS-001)... 122
Figure 4.1. XRD pattern of (a) bulk CsCa2Ta3O10, (b) Cal-CNP, (c) R-Pt/Cu-CNP………131 Figure 4.2. (a) The physical appearance of nanosheet suspension of TBA-CNP, (b) TEM
images of Cal-CNP, (c-d) HRTEM and (fast Fourier transformed) FFT pattern of perovskite nanosheets. ... 132
Figure 4.3. TGA curve for TBA-CNP sample ... 133 Figure 4.4. (a) TEM with corresponding SAED pattern of R-Pt/Cu-CNP (Red arrows
indicate the possible location of either Pt-rich particles and Cu-rich particles); (b) HRTEM image of R-Pt/Cu-CNP, EDS of Cu-rich nanoparticles (c) and Pt-rich nanoparticles (d); (e) HRTEM image of a Cu-rich particle. (Ni from TEM grid). ... 134
Figure 4.5. (a) HRTEM image of R-Pt/Cu-CNP and (b) EDS analysis of an alloy Pt-Cu
nanoparticle. ... 135
Figure 4.6. UV-Vis spectra of (a) Cal-CNP, (b) Cal-Pt/Cu-CNP (*) and (c) R-Pt/Cu-CNP. ... 136
Figure 4.7. High resolution XPS of (A) Ta 4f and (B) O 1s; (a) Cal-CNP, (b) R-Pt/Cu-CNP
and (c) In-situ R-Pt/Cu-CNP (**). ... 138
Figure 4.8. Relative CO2 concentration (C/C0) evolution as function of photoreaction time,
(a) R- Pt/Cu-bulk Ca2Ta3O10, (b) R-Pt-CNP, (c) R-Pt/Cu-CNP... 140 Figure 4.9. Product evolution and reaction rate for R-Pt/CNP: (a), (c); for R-Pt/Cu-CNP: (b)
and (d). (▲ CH3OH, ■ C2H5OH). ... 141 Figure 4.10. Product evolution of R-Pt/Cu-CNP catalyst for three cycles. (▲CH3OH, ■
C2H5OH). ... 142 Figure 4.11. Schematic diagram of CO2 photoreduction mechanism over R-Pt-CNP system.
... 145
Figure 4.12. Schematic diagram of CO2 photoreduction mechanism over R-Pt-CNP system.
... 146
Figure S4.1. Illustrated diagram for the synthesis of reduced Pt/Cu-Ca2Ta3O10
nanosheets………...151
Figure S4.2. In-situ closed system for photocatalytic test of CO2 conversion, A - designed
system (1-substrate coated photocatalyst, 2-light filter, 3-circulation pump, 4-water container, 5-GC six-port gas sampling valve, 6-GC column and 7-GC detectors, 8-Valves), B - real system. ... 151
Figure S4.3. Isotherm plot of (a) TBA-CNP, Sarea=314 m2/g; (b) Cal-CNP, Sarea=210 m2/g;
(c) R-Pt/Cu-CNP, Sarea= 205 m2/g. ... 152 Figure S4.4. XPS survey spectra and high-resolution XPS spectra of (a) Cal-CNP, (b)
R-Pt/Cu-CNP, (c) In-situ R-Pt/Cu-CNP. ... 152
Figure S4.5. High-resolution XPS spectra of Cu and Pt in R-Pt/Cu-CNP. ... 153 Figure S4.6. EDX mapping of Ca, Ta, Cu, Pt and O in R-Pt/Cu-CNP. ... 154 Figure 5.1. FTIR spectra of (a) the bulk g-C3N4 (CN), (b) sample CN-12 obtained after the
autoclave treatment without CdS (CN-12), (c) sample CN-CdS obtained after the autoclave treatment containing CdS and (d) pristine CdS (p-CdS) obtained after the autoclave treatment
(without g-C3N4)………..165
Figure 5.3. Representative TEM images of (A) CN-12, (B) p-CdS, and (C, D) CN-CdS, (E)
High resolution TEM (HR-TEM) image of CN-CdS, and (F) Energy-dispersive X-ray spectroscopy (EDS) of CdS NP (Cu from the TEM grid). ... 167
Figure 5.4. (A) C1s high-resolution XPS (HR-XPS), (B) N1s HR-XPS, (C) S3p HR-XPS
and (D) Cd3d HR-XPS spectra of CN-CdS. ... 169
Figure 5.5. UV-vis spectra of the bulk CN, CN-12, p-CdS, and CN-CdS. ... 174 Figure 5.6. (A) CO and H2 production rates of CN-12, CN-CdS and CdS, and (B) CO, and
H2 production rates of CN-CdS for four cycles. ... 175 Figure 5.7. (A) Transient photocurrent and (B) Electrochemical impedance spectroscopy
(EIS) Nyquist plots of CN-12/FTO, CN-CdS/FTO, and CdS/FTO. (Inset Randles circuit used for EIS characterization; Rs – solution resistance; Rct – polarization resistance; Cct –
double-layer capacitor). ... 177
Figure 5.8. Photoreduction mechanism of CO2 over CN-CdS. ... 178 Figure S5.1. Schematic formation of g-C3N4/CdS nanocomposite inside the autoclave
containing thiourea at 200oC. The beneath process displays the polycondensation of thiourea to melamine that releases NH3 and H2O………...182 Figure S5.2. Schematic illustration of the photocatalytic system for the CO2 photoreduction.
... 182
Figure S5.3. CO and H2 production rates of CN-CdS at various reaction conditions and
Mix-CN-CdS*. ... 186
Figure 6.1. The schematic formation of cyanuric acid (2) and melamine (3) during the
condensation of urea (1)………...194
Figure 6.2. (A) Melamine-cyanuric acid supramolecular complex (MCS) structure, (B)
FT-IR spectrum, (C) 13C MAS NMR and (D) X-Ray diffraction pattern of CN sample. ... 195 Figure 6.3. (A) SEM and (B) TEM images of the CN sample. ... 198 Figure 6.4. (A) Full‐spectrum survey and high resolution (B) C 1s, (C) N 1s, and (D) O 1s,
XPS spectra of the CN sample. ... 200
Figure 6.5. (A) FTIR spectra and (B) 13C MAS NMR spectra of (a) CN‐A, (b) CN‐AA, and
(c) bulk g‐C3N4. ... 201 Figure 6.6. X‐ray diffraction patterns for (A) CN‐A, (B) CN‐AA, and (C) bulk g‐C3N4. 203 Figure 6.7. (A) C 1s and (B) N 1s high‐resolution XPS spectra of (a) CN‐A, (b) CN‐AA, and
Figure 6.8. TEM images of (A) CN‐A and (B) CN‐AA. (C) High‐magnification TEM image
of CN‐AA nanosheets with in‐plane nanoholes. ... 209
Figure 6.9. (A) UV/Vis absorption spectra and (B) band‐gap estimation based on the
absorption edge of CN‐A, CN‐AA, and bulk g‐C3N4. ... 211 Figure 6.10. Hydrogen production rates of the CN‐A, CN‐AA, and bulk g‐C3N4 samples
under (A) full solar light spectrum and (B) visible light (λ>420 nm). (C) UV/Vis absorption spectrum and quantum efficiency of CN‐AA at various wavelengths. (D) Hydrogen production stability of CN‐AA for four cycles. ... 214
Figure 6.11. (A) Transient photocurrent response and (B) EIS plots of CN‐A/FTO, CN‐
AA/FTO, and bulk g‐C3N4/FTO in 0.5M Na2SO4 solution exposed to full sunlight spectrum
(150 W Xe lamp). Inset shows the Randles circuit used for EIS characterization. (Metrohm-Autolab application note EIS04), in which Rs: solution resistance, Rct: polarization resistance
and Cct: double layer capacitance. ... 217 Figure S6.1. (A) FT-IR spectra and (B) X-ray diffraction patterns of CN-200-A (*)…...221 Figure S6.2. (A) and (B) TEM images of CN; (C) SEM and (D) TEM images of CN-A-200.
... 222
Figure S6.3. The planarization of MCS sheets under high pressure ... 223 Figure S6.4. (A) FT-IR spectra and (B) XRD patterns of samples (a) CN-A1, (b) CN-A2 and
(c) CN-A obtained by Ar heating treatment of CN in various of time of 4h, 2h and 1h, respectively. ... 224
Figure S6.5. (A) FT-IR spectra and (B) XRD patterns of (a) CN-A and (b) CN-400-A. . 224 Figure S6.6. (A) XPS survey and (B) O1s high resolution XPS spectra of (a) A, (b)
CN-AA and (c) bulk g-C3N4. ... 225 Figure S6.7. (A) Isotherm plots and isotherm adsorption plots in range of 0.05-0.6 (inset
graph) of CN-A and CN-AA and the bulk g-C3N4samples; (B) NLDFT pore size distribution
of CN-A and CN-AA. ... 225
Figure S6.8. The Mott-Schottky plot of (A) CN-A, (B) CN-AA and (C) the bulk g-C3N4
... 226
Figure S6.9. Schematic diagram of the band structure of CN-A, CN-AA, and the bulk
g-C3N4. ... 226 Figure S6.10. Photocatalytic hydrogen evolution of CN-AA sample using (a) both Pt (4%)
and TEA; (b) Pt (4%), none of TEA; (c) TEA, none of Pt and (d) none of both Pt and TEA under irradiated solar light. ... 227
Figure 7.1. Schematic formation of C3N4 nanofragments from the bulk g-C3N4 inside the
autoclave containing urea at 205oC. The under process shows the polycondensation of urea
that releases NH3 and H2O………240
Figure 7.2. (A) FT-IR spectra and (B) 13C NMR spectra of (a) the bulk g-C
3N4 (CN) and (b)
sample obtained after a reaction time of 36h (CN-A). ... 241
Figure 7.3. X-ray diffraction patterns of (a) CN and (b) CN-A samples... 242 Figure 7.4. TEM images of CN (A); CN-A (B) and (C); High-resolution TEM (HR-TEM)
image of CN-A (D). ... 243
Figure 7.5. (A) FT-IR spectra and (B) X-ray diffraction patterns of (a) CN-A, samples
obtained after thermal treatment for 4 hours under air (CN-AAi) (b) and under argon atmosphere (CN-AAr) (c). ... 246
Figure 7.6. (A) C1s high-resolution XPS (HR-XPS) spectra, and (B) N1s HR-XPS spectra
of (a) the bulk (CN) and (b) CN-A. ... 248
Figure 7.7. (A) UV-vis absorption spectra and (B) Kubelka–Munk function curves of CN
and CN-A. ... 250
Figure 7.8. Band alignment diagram of CN and CN-A versus the NHE (pH=7). ... 252 Figure 7.9. (A) H2 production rate of CN and CN-A samples and (B) H2 production of
CN-A for three cycles. ... 252
Figure 7.10. (A) Transient photocurrent and (B) Electrochemical impedance spectroscopy
(EIS) Nyquist plots of CN/FTO and CN-A/FTO. (Inset Randles circuit used for EIS characterization; Rs – solution resistance; Rct – polarization resistance; Cct – double-layer
capacitor). ... 255
Figure S7.1. Schematic illustration of the photocatalytic system for the hydrogen evolution
study………256
Figure S7.2. (A) TEM image of a CN-A nanofragment; (B), (C) and (D) Energy-dispersive
spectroscopic (EDS) element mapping of Carbon, Nitrogen and Oxygen. ... 257
Figure S7.3. Isotherm plots and measured specific surface area of CN and CN-A. ... 258 Figure S7.4. (A) FT-IR spectra and (B) X-Ray diffraction patterns of the bulk (CN) and
samples obtained after 12 (CN-12), 24 (CN-24), 36 (CN-A) and 48 h (CN-48) of autoclave treatment. ... 258
Figure S7.5. (A) XPS survey of (a) the bulk (CN) and (b) CN-A; and (B) HR-XPS O1s
spectrum of CN-A. ... 259
Figure S7.6. Schematic illustration of the hydrogen bond network between functional groups
Figure S7.7. Schematic illustration of planarization of C3N4 sheets and their fragmentation
under high-pressure atmosphere of NH3. ... 260 Figure S7.8. Mott-Schottky plots collected at various frequencies of (A) the bulk (CN) and
(B) CN-A. ... 260
Figure S7.9. Hydrogen production rate of samples (A) obtained after the thermal treatment
of CN-A under different conditions; (B) obtained after different synthesizing time. ... 261
List of Tables
Table 2.1. Photocatalytic CO2 reduction yields obtained by various single component
co-catalysts. ... 47
Table 4.1. Physicochemical properties of the various samples………129 Table 4.2. Photocatalytic activity of sunlight-driven CO2 conversion for variously reduced
photo-catalysts ... 139
Table S4.1. Results of sunlight-driven CO2 conversion using various photocatalyst……..154 Table 6.1. The atomic fraction of C, N, and O measured by XPS quantitative
analysis………205
Table S6.1. The position of diffraction peaks and corresponding d values of prepared
samples………227
Table S6.2. The peak position and the relative peak-area ratio (Ni/Nall), (Ci/Call) and (Oi/Oall)
at % of N, C and O species in different groups of prepared samples. N1 (N=C-N), N2
(N-(C)3) and N3 (NH2); C1 (C=N), C2 (C-NH2), C3 (C=O) and Cref (referent carbon); O1 (O=C)
and O2 (O-H). ... 228 Table S6.3. Specific surface area and NLDFT pore volume of prepared samples. ... 229 Table S6.4. Summary of recent work in carbon nitride materials for photocatalytic hydrogen
evolution ... 229
Table 7.1. The elemental percentage of C, N, and O quantified by XPS
analysis………247
Table S7.1. The position of diffraction peaks and corresponding d values of prepared
samples………261
Table S7.2. The peak position and the relative peak-area ratio (Ni/Nall), (Ci/Call) and (Oi/Oall)
at % of N, C and O species in different groups of prepared samples. N1 (N=C-N), N2
(N-(C)3) and N3 (NH2); C1 (C=N), C2 (C-NH2), C3 (C-OH) and Cref (referent carbon)... 262 Table S7.3. Summary of recent work in bulk-modified carbon nitride materials for
List of abbreviations
A Acceptor
BET Brunauer-Emmett-Teller
CB Conduction band
D Donor
DFT Discrete Fourier transform
EA Ethylamine
EM Electron microscopy
EPR Electron paramagnetic resonance FID Flame ionization detector
FTIR Fourier transform infrared spectroscopy
G Graphene
GC Gas chromatography
GO Graphene oxide
LDH Layer double hydroxide MOF Metal organic framework
NF Nanofragment
NHE Normal hydrogen electrode NMR Nuclear magnetic resonance
NP Nanoparticle
NS Nanosheet
PCET Proton-coupled electron transfer PEC Photoelectrochemical
PL Photoluminescence
QE Quantum efficiency
QY Quantum yield
RGO Reduced graphene oxide SEM Scanning electron microscopy TCD Thermal conductivity detector
TEA Tetrabutylammonium
TEAOH Tetrabutylammonium hydroxide TEM Transmission electron microscopy TEOA Triethanolamine
UV-vis Ultraviolet-visible
VB Valence band
XPS X-ray photoelectron spectroscopy XRD X-ray diffraction
Acknowledgments
Firstly, I would like to thank Professor Trong-On Do to give me the great opportunity of pursuing a research career at Université Laval. I would like to thank him again, and Professor Serge Kaliaguine for their excellent supervision and guidance throughout my entire Ph.D. program.
I would like to give special thanks to Dr. Chinh-Chien Nguyen, a former member of Prof Do’s group. He taught and helped me a lot in both my life and my study since the first day I arrived in Canada. He also gave me prestigious advice. Five articles published together are the result of our great collaboration. I am sincerely grateful generous help of other members, Dr. Mohammad Reza Gholipour, Dr. Amir Enferadi Kerenkan, Mathieu St-Jean, Manh-Hiep Vu, Duc-Trung Nguyen, Arnaud Gandon, Rokesh Karuppannan, Jorge Becerra Sanchez, Vishnu Nair Gopalakrishnan, Toan-Anh Quach, Pejman Monazzam. I learned a lot from them.
I would like to thank Mr. Alain Adnot, Mr. Jean Frenette, Mr.Richard Janvier, all the professors, and other staff of the Département de Génie chimique for their excellent assistance and cooperation. I am also grateful to the technicians, Mr. Jean-Nicolas Ouellet, Mr. Jérôme Noël, and Mr. Marc Lavoie, for their advice and instructions in the laboratory works and equipment operation.
I wish to give my acknowledgment to the Natural Science and Engineering Research Council of Canada (NSERC) through Collaborative Research and Development (CRD), Strategic Project (SP), Discovery Grants, and Exp Inc for their financial support.
Finally, I am most grateful to my lovely wife, Mrs. Bich-Van Tran for accompanying me all the time. Her unconditional love and invaluable support help me get over all hard moments and challenges to success today. I also thank my friends for their help during my stay in Canada.
Without all of you, it would be impossible to complete my Ph.D. study and this thesis.
Foreword
The present PhD thesis consists of eight chapters. It is constructed based on the combination of scientific articles whose first author is also the author of this thesis. All the articles have been published or submitted at the time of the thesis submission.
The introduction and chapter 2 are partially included in the review article “Critical Aspects and Recent Advances in Structural Engineering of Photocatalysts for Sunlight-Driven Photocatalytic Reduction of CO2 into Fuels” published by Nhu-Nang Vu, Serge Kaliaguine,
and Trong-On Do in Advanced Functional Materials, 2019, 29, 1901825.
Chapter 4 reports the study “Reduced Cu/Pt–HCa2Ta3O10 Perovskite Nanosheets for
Sunlight‐Driven Conversion of CO2 into Valuable Fuels” published by Nhu-Nang Vu,
Chinh-Chien Nguyen, Serge Kaliaguine, and Trong-On Do in Advanced Sustainable
Systems, 2017, 1, 1700048.
Chapter 5 reports the study “Synthesis of g-C3N4/CdS nanocomposite with an intimate
interface for enhanced sunlight-driven CO2 photoreduction” submitted by Nhu-Nang Vu,
Serge Kaliaguine, and Trong-On Do.
Chapter 6 reports the study “Synthesis of g‐C3N4 Nanosheets by Using a Highly Condensed
Lamellar Crystalline Melamine–Cyanuric Acid Supramolecular Complex for Enhanced Solar Hydrogen Generation” published by Nhu-Nang Vu, Chinh-Chien Nguyen, Serge Kaliaguine, and Trong-On Do in ChemSusChem, 2019, 12, 291-302.
Chapter 7 reports the study “Selective Fragmentation through C–N Bond Cleavage of Carbon Nitride Framework for Enhanced Photocatalytic Hydrogen Production” published by Nhu-Nang Vu, Chinh-Chien Nguyen, Serge Kaliaguine, and Trong-On Do in ACS Sustainable
Introduction
This part introduces the biggest challenges of modern science towards the energy supply and the environmental pollution, simultaneously drawing attention to solar-energy conversion using H2O and CO2 as compelling solutions. It also presents two efficient photocatalyst
candidates for the process of solar-energy conversion, including g-C3N4 and perovskite
1.1. General introduction
Developing energy supply and solving environmental pollution are the two most significant challenges of modern science in the 21st century. At present, our energy resources mainly
originate from fossil fuels, such as coal, oil, and natural gas, occupying 80% of the total world energy supply 1. The growth of the global population and high dependence on fossil fuel are
causing the depletion of those energy resources. Furthermore, the combustion of fossil fuels also releases many pollutants such as CO2, SO2, NOx CO, and other volatile organic
compounds, involving a series of disastrous environmental problems such as water contamination, air pollution, especially, global warming due to greenhouse effect which is seriously threatening human life. Therefore, the development of clean, renewable, and cheap energy sources is urgently needed to get over the challenges of energy and the environment.
Considering such essential factors as the economy, the environment, human health, yield, among all current renewable sources (solar energy, wind, geothermal heat, tides, biomass, hydroelectricity, etc.), solar energy is recognized as the most feasible energy source because it is free, abundant, non-polluting, endless and thus satisfies long-term energy demand 2. In the recent few decades, solar energy has been utilized very commonly in actual life, for example, for electric power generation, lighting, thermal, pumping, telecommunication networks, remote terminal, and surveillance units. In this context, the conversion of solar energy into chemical energy via photocatalytic processes has been especially significant.
Sunlight-driven fuel production from H2O and CO2 using photocatalysts is currently of great
interest for converting solar energy. It offers a compelling friendly, and environmentally solution for the production of sustainable renewable energy sources as well as for advancing the CO2 recycling 1, 3. In this system, a photocatalyst converts sunlight energy into chemical
energy, which then favors the reduction of H2O to hydrogen and the reduction of CO2 to
valuable compounds such as methane, methanol, ethanol, etc. These products, which are so-called solar fuels, are fully capable of replacing conventional fuels because of their exceptional properties. For example, H2 has a high specific energy density of 120 kJ g-1, and
it is pollutant-free with water as the by-product of combustion. Methane has a high specific energy density of 55 kJ g-1 with a low amount of CO2 released.
There are, however, various drawbacks that limit the efficiency of the photocatalytic process. The photocatalytic H2 production suffers from major material-relating disadvantages such as
weak light absorption and low charge separation and some others such as back oxidation reaction and mass transfer limitation. Apart from these fundamental drawbacks, CO2
photoreduction is held back by other particular disadvantages resulting from the CO2
molecules. Firstly, the CO2 molecule is exceptionally stable, thus requiring a massive amount
of energy for its reduction. Only a small number of recently developed photocatalysts can adapt to this requirement of energy. Secondly, CO2 molecules exist mostly in the gaseous
form, so that its interaction with the photocatalysts is highly difficult, resulting in a low reduction efficiency. Currently, even though many materials can achieve excellent CO2
absorption, most of the time, they have no photocatalytic activity. Thirdly, the CO2 reduction
is very complicated, involving complex pathways with various intermediates. The control of product selectivity is thus difficult. Additionally, this hinders the studies of the mechanism, which is so beneficial to photocatalyst development. Last, the CO2 reduction competes with
other more favorable processes, for example, water reduction, leading to small efficiency.
The need to achieve an efficient photocatalytic process has promoted the development of various photocatalyst materials. Graphitic carbon nitride (g-C3N4) is among the most widely
developed material for the entire photocatalytic domain 4-6. The significant advantages of
g-C3N4 are metal-free composition, simple preparation, excellent thermal, and chemical
stability 7-8. Additionally, the sizable conjugation of g-C
3N4 induces a narrow bandgap (2.7
eV) with a proper conduction band (CB) level for the reduction of CO2 and H2O under visible
light 7-8. Inorganic perovskite material is another active photocatalyst material for the CO2
photoreduction and the H2 production 4, 9-10. This material possesses a robust structure with
high stability and crystallinity, which is favorable for the charge carrier transfer and selective intercalation of reactants 11-13. Despite the excellent features, g-C3N4 and perovskite materials
exhibit a moderate photocatalytic performance due to the low surface area and the fast charge recombination. For perovskite material, its particular wide bandgap (>3 eV) only allows UV light absorption, hindering the solar energy harvesting 4.
The effort to improve the photocatalytic performance of both materials has driven research interest in the engineering of their structures. Among various strategies, tremendous attention
has been given to nanostructure design owing to unique features in the structure of both materials. The g-C3N4 offers excellent features for the nanostructure design, such as the
sheet-like structure, the intra-layer ordered patterns of the melon units maintained by hydrogen bonds (H-bonds), and covalent C-N bonds with thermal breakage capability 7-8. To date, C3N4 nanorods (NRs), nanotubes (NTs), nanofragments (NFs), and especially
nanosheets (NSs) are the most extensively designed nanostructures of the g-C3N4 material 14.
Layered perovskite material similarly has the layered structure, which is capable of exfoliating to NSs through ion exchange 15. The nanostructure design of both materials delivers significant advantages such as enlarging surface area with more active sites exposed, short transfer pathway for charge carriers, flat band structure with an upward shift of CB, and high capability of integration 4, 16-19. Unfortunately, the nanostructure design of each material remains having particular drawbacks that may have negative impacts on the photocatalytic performance. For the g-C3N4 material, the bulk exfoliation can result in the decline of the
light absorption 20-21, the introduction of undesired structural defects, and the demolition of the C3N4 structure 22. For perovskite material, the exfoliation lacks the controllability of
thickness, size, and shape of the NSs 23. The wide-bandgap property the NSs preserved from the mother layer material is another obstacle. Up to date, these drawbacks are still enormous challenges for the development of efficient perovskite and C3N4 material based
photocatalysts.
1.2. Objectives of the thesis
Generally, the goal of the present thesis is to contribute to the development of nanostructure photocatalysts using advanced strategies of the structural engineering for the CO2
photoreduction and the H2 production under sunlight.
The first objective is to provide detail review of the critical aspects of the photocatalytic processes of CO2 reduction and H2 production, and of current advances in the nanostructure
design of photocatalysts for these processes. Promising materials and their nanostructure designs are proposed.
The second objective – the most important objective is to report efficient nanostructure photocatalysts which were developed by our group from the perovskite and g-C3N4 materials
using novel approaches. It includes two photocatalyst groups: reduced HCa2Ta3O10 perovskite nanosheets and g-C3N4/CdS heterostructure nanocomposite for the
CO2 photoreduction; g-C3N4 nanosheets and g-C3N4 nanofragments for the photocatalytic H2
production.
The final objective is to suggest a new photocatalyst type for efficient photocatalytic processes of the CO2 reduction and H2 production under sunlight.
1.3. Outline of the thesis
Introduction:This part synchronously gives the general introduction, states the objectives and highlights the outline of the present thesis.
Chapter 2:
Chapter 2 provides a background of the present thesis by presenting fundamentals of the CO2
photoreduction and the photocatalytic H2 production, previous photocatalyst materials with
detail features, and current advances in the nanostructure design of photocatalysts for two these two processes.
Chapter 3:
In this chapter, fundamentals of essential experimental techniques employed in the present thesis are described, including X-ray diffraction (XRD), Electron microscopy techniques consisting of scanning electron microscopy (SEM), transmission electron microscopy (TEM), X-ray photoelectron spectroscopy (XPS), Fourier transform infrared (FT-IR) spectroscopy, Nitrogen physisorption analysis, Ultraviolet-visible (UV-Vis) spectroscopy, Photoelectrochemical analysis (PEC) and gas chromatography (GC).
Chapter 4:
Chapter 4 reports the preparation of reduced perovskite HCa2Ta3O10 nanosheets with an
improved visible light absorption from the layered perovskite CsCa2Ta3O10 via the
surface as co-catalysts, simultaneously assisting the hydrogen treatment. The reduced NSs are used for the sunlight‐driven conversion of CO2 with water vapor into valuable fuels.
Chapter 5:
Chapter 5 reports the synthesis of g-C3N4/CdS heterostructure nanocomposite with an
intimate contact interface using the high-pressure NH3 and H2S created by the
polycondensation of thiourea. The impacts of the high-pressure condition on the formation of heterostructure the nanocomposite, the structure of each component, and the structural formation mechanism are demonstrated. The photocatalytic activity of the g-C3N4/CdS
heterostructure nanocomposite is evaluated for the sunlight‐driven reduction of CO2 in the
liquid phase.
Chapter 6:
Chapter 6 reports the direct and low-temperature synthesis of g-C3N4 nanosheets using
melamine-cyanuric acid supramolecular (MCS) complex as the precursor. The MCS complex is synthesized from the urea by a self-created high pressure in the autoclave. The enhancement of the NS properties is illustrated. The photocatalytic hydrogen production of the obtained NSs is investigated under sunlight.
Chapter 7:
Chapter 7 reports the preparation of g-C3N4 nanofragments with enriching functional groups
via the fragmentation of the C3N4 framework using the condition created by the MCS
complex synthesis above. Advanced features of the NF structure and the fragmentation mechanism are revealed. The photocatalytic hydrogen production of the obtained NFs is also investigated under sunlight.
Conclusion and outlook:
In this part, all works done in the present thesis, including literature reviews and research results in chapters 4-7, are summarized. Moreover, efficient photocatalyst type - plasmonic photocatalyst with advanced architecture design is suggested for the CO2 photoreduction and
Chapter 2: Literature review
This chapter provides fundamentals of CO2 photoreduction and photocatalytic H2 production,
including critical aspects of light-harvesting, charge separation and surface reactions. This chapter also highlights detail features of g-C3N4 and perovskite materials (structure and
advantages), which make these two materials precious for both CO2 photoreduction and H2
production. Moreover, the current advances in nanostructure design of photocatalysts with corresponding state-of-art systems are reviewed and discussed for these processes.
2.1. Fundamentals of photocatalysis on semiconductors
In artificial photocatalysis, a semiconductor, known as a photocatalyst, converts light into valuable energy through electron photo-excitation across their band gaps, which is then used to favor the surface reaction of chemical compounds. The principle of photocatalysis over a semiconductor is shown in Figure 2.1. This process includes three main steps: light absorption, charge separation, and transfer, and the surface catalytic reaction. Under the light irradiation, the electrons are excited from the valence band (VB) to the conduction band (CB) and leaving holes in the VB. These photo-generated electrons and holes then migrate to the surface of photocatalyst before initiating surface reactions of chemical compounds. The surface reactions are divided into the reduction reaction of the acceptors (A) involving the participation of electrons and the oxidation reaction of the donors (D) at holes, respectively, as shown in Figure 2.1.
Figure 2.1. Schematic illustration of photocatalysis over a semiconductor.
The efficiency of the photocatalytic process is usually expressed by quantum yield (QY) which is defined as the ratio of the number of reacted electrons to that of absorbed photons in a photoreaction as Equation 2.1:
Number of reacted electrons
QY (%) = × 100 (2.1)
However, this equation could not be applied in numerous cases, such as in the reactions involving the multi-photon process, a radical chain reaction in the presence of oxygen 24.
Moreover, it is impossible to measure the number of absorbed photons due to light scattering in solid materials. Therefore, an apparent quantum yield (AQY) is defined to represent the efficiency of a photocatalytic process as Equation 2.2.
Number of reacted electrons
AQY (%) = × 100 (2.2)
Number of incident photons
2.2. Band structure of photocatalysts
The band structure is the first important issue in the photocatalytic field. Firstly, the bandgap of the photocatalyst is an essential factor in determining the light absorption of a photocatalyst. A semiconductor only generates holes and electrons under the light source, which has photon energy equal to or higher than its bandgap. The sunlight includes photons with various wavelengths (λ). They are divided into three different types: the ultraviolet light with λ<400 nm and the corresponding photon energy (Ephoton) being smaller than 3.1 eV; the
visible light with λ ranging from 400-700 nm corresponding to 1.7 Ephoton 3.1 (eV) and the infrared irradiation (λ>700 nm and Ephoton <1.7 eV). In sunlight, the UV proportion is
attributed to only 5%, while the visible light and the infrared irradiation portion accounts for 95 % of total solar energy, as shown in Figure 2.2 25.
Figure 2.2. The sunlight spectrum and solar energy distribution 25. Heat Island Group,
Lawrence Berkeley National Laboratory Heat Island Group, Lawrence Berkeley National Laboratory.
The matching of bandgap smaller than 3 eV will, therefore, be a goal in targeting high efficient solar energy harvesting. Doping is the most common strategy to match the bandgap of semiconductors due to the formation of additional electronic states in the band structure, thus enhancing visible light absorption. Additionally, other approaches, such as multi-component solid solution and facet engineering, have also been developed to narrow the bandgap and extend visible light absorption 16.
Secondly, the band position of a photocatalyst also relates to its capability to produce H2 and
reduce CO2. In detail, to achieve the photocatalytic H2 production, the bottom of the CB must
be higher than the reduction potential of H2O (-0.42 V, vs. NHE, pH = 7), which is shown in Equation 2.3 26. For the photocatalytic CO2 reduction, the bottom of the CB must be located
at a more negative potential than the reduction potential of CO2. Equations 2.4 – 2.8 list the
potentials (vs. NHE, pH = 7) of CO2 reduction to several products such as formic acid, carbon
monoxide, formaldehyde, methanol, and methane 27. For example, to reduce CO2 to CH4, the
CB band of photocatalyst must be more negative than -0.24 V (vs. NHE, pH = 7).
+ - 0 2 0 2 0 2 2 2H + 2e H E = -0.42 V (2.3) CO + 2H + 2e HCOOH E -0.61 V (2.4) CO + 2H + 2e CO + H O E -0.53 V 0 2 2 0 2 3 2 0 2 4 2 (2.5) CO + 4H + 4e HCHO + H O E -0.48 V (2.6) CO + 6H + 6e CH OH + H O E -0.38 V (2.7) CO + 8H + 8e CH + 2H O E -0.24 V (2.8)
The top of the VB must exceed the oxidation potential of the electron donor, such as water, methanol, ethanol, etc. The shift of CB band position to more negative potentials promotes the photocatalytic reaction thermodynamically. For the CO2 photoreduction, this shift,
however, leads to the formation of various products, thus resulting in a decrease of the selectivity toward desired products. Co-catalyst decorating is an excellent strategy to address this issue.
2.3. Charge separation and transfer
The charge separation and transfer is the second crucial issue in determining the efficiency of a photocatalyst. During the migration to reactive sites on the photocatalyst surface, photo-generated electron and hole pairs can suffer several unexpected processes, including volume and surface recombination, which thus reduce the photocatalytic efficiency, as shown in
Figure 2.3 28. These recombinations may relate to undesired defects in crystalline structures such as lattice disorder, dangling bond, interstitial atoms, grain boundaries and especially, vacancies 29-31. To address these recombinations, a tremendous effort has been made, including the initiatives in nanostructure design, co-catalysts utilization, and other structural engineering strategies 16, 32-36. e -h+ e -h+ e -h+ e -h+ e -h+ e -h+ e- h+ e- h+ e -h+ CB VB hv recombinationSurface e -h+ e -h+ Reduction Oxidation Reduction Oxidation CB VB CB VB n-type p-type Surface transfer Volume recombination Volume transfer
Figure 2.3. Schematic of charge separation and transfer in a photocatalyst 28.
It should be noted that the effect of structural defects such as vacancies on the charge separation and transfer is still controversial to date. Some studies reported the role of oxygen vacancies as recombination centers for the charge transfer process, thus hampering the photoinduced charge carriers' separation process 37-40. Pan et al. experimentally demonstrated that oxygen vacancies in TiO2-001 serve as recombination centers, causing a decrease in
photocurrent and the increase in photoluminescence (PL) intensity 40. By contrast, some studies demonstrate that vacancies facilitate the charge separation process 41-44. Wang et al. showed that oxygen vacancies in H2 treated TiO2 nanowires enhanced donor density,
simultaneously shifting Fermi level toward CB, leading to the improvement of charge transport 41. Besides, some studies prove that vacancy defects on the photocatalyst surface promote the charge transfer to the reactant, preventing the electron-hole recombination. In contrast, bulk vacancies act only as charge recombination centers 45-46. Moreover, vacancy defects are essential in enhancing optical properties and adsorption of reactants (e.g., H2O
and CO2) of photocatalysts 31, 47. Therefore, determining the contribution of defects is critical
for the structural engineering of photocatalysts in photocatalytic application.
Wherein the carrier transportation is no longer affected by undesired defects in well crystal photocatalyst, it is still influenced by surface band bending 28, 48. Contacted photocatalyst
with external media can cause an upward or a downward band bending depending on the semiconductor type, as shown in the insets of Figure 2.3. For n-type semiconductor photocatalyst, the upward band bending causes an energy barrier that hinders the electron transfer toward the reduction sites 48. By contrast, the downward band bending of p-type semiconductor photocatalyst results in a lower band energy level, thus achieving a high rate of the electron transfer toward the reduction sites 48. Owing to the importance of band bending, tuning surface band bending is a promising strategy to enhance the charge transport and further, the photocatalytic efficiency. Integrating p-type and n-type semiconductors is one of the highly effective approaches that can increase the photocatalytic efficiency by several orders of magnitude 49-50. Notably, the surface band bending on the nanostructure photocatalysts is negligible due to their nanosize dimension 48. This is particularly valuable in nanostructure engineering to enhance the charge separation and transfer of n-type
semiconductor photocatalysts. Moreover, n-type semiconductor photocatalysts can well couple with reduction co-catalysts that facilitates the electron-hole separation and greatly enhances the photoreaction. This is one of the advanced structure engineerings recently developed.
2.3. Surface reaction
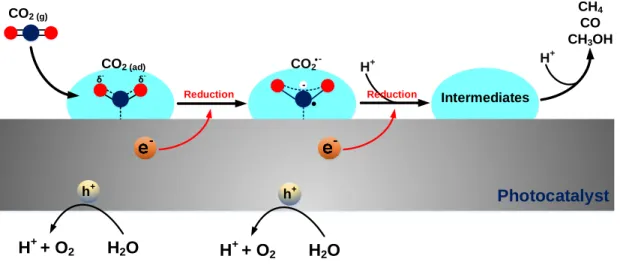
2.3.1. CO2 reductionThe CO2 reduction occurs mostly on the surface of the semiconductor with the participation
of photo-generated electrons and protons. This is a complicated process involving the formation of several different products. CO2 can be directly reduced to products by
multi-electron reactions involving 2 to 8 multi-electrons with the corresponding value of reduction potential and number of protons, as shown in Equations (4) – (8). Nevertheless, there is little evidence in the literature for the multi-electron transfer process in semiconductor photocatalyst 51. Hence, scientists favor the single-electron transfer processes shown in
Figure 2.4. This process proceeds through a series of single-electron steps involving the first
formation of the anion radical CO•2, which is regarded as the most crucial step in the mechanism of this reduction. However, the addition of an electron to activate CO2 is a
complex reaction due to the closed-shell electronic configuration of CO252.
0
2 2
CO + 1e CO E -1.9 V (2.9)
Additionally, the potential of the single-electron reduction of CO2 to anion radical CO•2
(Equation 2.9) is strongly negative of -1.9 eV (vs. NHE, pH = 7), which is more negative than CB level of all present semiconductors, thus transfer an electron to a free CO2 molecule
Figure 2.4. Surface reduction of CO2 in the presence of water as an electron donor.
Fortunately, the surface absorption of CO2 leads to the formation of charged species COδ-2
with a distortion in geometry, which results in a lower barrier for accepting electron 52, 54. The efficiency of this activation step significantly impacts on the entire efficiency of CO2
reduction. The surface activation of CO2 is strongly dependent on the interaction of adsorbed
CO2 molecules and surface atoms of the photocatalyst. For example, the interaction of CO2
molecules and oxygen vacancy sites on the TiO2 surface is stronger and more stable than
regular site because the vacancies were healed by oxygen atoms of CO2, thus resulting in
lower activation energy for the first reaction step 55-56. For another example, the co-catalysts decoration is proven to be effective in decreasing the activation energy of CO2 reduction 57-59.
After the activation step, the reduction continues proceeding through a series of elemental steps that involve the transfer of electrons, protons, hydrogen radicals, the cleavage of C-O, and the creation of C-H bonds, resulting in the formation of several intermediates. The study of these intermediates is a primary importance to determine the mechanism of the entire process. Therefore, numerous experimental methods and techniques have been employed for these studies. For example, gas and ion-exchange chromatography supplemented by IR, EPR, X-ray photoelectron spectroscopy is commonly used to analyze intermediates and final products 57-58, 60-68. Methods of transient absorption measurement, scanning tunneling
δ- δ -CO2 (g) CO2 (ad) Reduction Intermediates CH4 CO CH3OH Photocatalyst -CO2 - H+ Reduction h+ H+ H2O H+ + O2 h+ H2O H+ + O2
microscopy are also employed to establish mechanism 56, 60, 69-70. However, to date, the exact
mechanism of CO2 photoreduction on semiconductors remains to be determined.
Figure 2.5. Three proposed mechanisms for CO2 reduction 32.
There are three possible mechanisms proposed for the reduction of absorbed CO2, including
the formaldehyde pathway 71-72, the carbene pathway 73-74, and the glyoxal pathway 65, 75, as shown in Figure 2.5. It should be noted that protons originate from the oxidation of water occurring in the VB. According to the formaldehyde pathway, a proton reacts with the carboxyl radical to form formic acid. Formic acid accepts another proton to form dihydroxylmethyl intermediates before its dehydration upon the addition of another proton to form formaldehyde. The next steps are the reduction of formaldehyde to methanol and
methane, respectively. In the carbene pathway, the reaction between a proton and radical
• 2
CO leads to the cleavage of C-O bonds resulting in the formation of carbon monoxide. In the next step, carbon monoxide accepts an electron and a proton to form a carbon residue. This carbon residue continues to be reduced to carbon radicals in the reaction with a proton. These radicals could combine with other protons, thereby leading to the formation of •
CH carbene, methyl radicals, and methane, respectively. Methanol could be formed if methyl radicals recombine with hydroxyl groups instead of a proton. Shkrop recently proposed the glyoxal pathway based on an EPR study of CO2 reduction intermediates 65, 75. In contrast,
with the first two pathways, the glyoxal pathway involves some C2 compounds in the
mechanism. Accordingly, an absorbed CO2 molecule accepts an electron to form CO•2anion radical bound to surface Ti atoms of the photocatalyst in a bidentate mode. The reaction between this anion radical and proton in the carbon site leads to the formation of bidentate formate. This bidentate formate molecule then recombines with another proton to form formic acid in a monodentate mode. The next step is composed of electron transfer to the formic acid molecule and the parallel process of transferring oxygen from the hydroxyl group to Ti atom on the surface, thus resulting in the formation of free formyl radical HC O• . These formyl radicals are then dimerized to yield glyoxal, which is reduced by the addition of a proton, first to trans-ethane - 1, 2 - semidione, and then to glycolaldehyde. Continuously, the latter is reduced to vinoxyl radicals (•
2
CH CHO) before accepting further hydrogen radicals to form acetaldehyde. The further oxidation of acetaldehyde is observed in the next step with the participation of photo-generated holes, resulting in the formation of acetyl radical. This radical is quickly decomposed to the methyl radical (•CH3) and releases carbon monoxide as the by-product. The final step is the recombination of methyl radical and hydrogen radicals to form methane.