i
UNIVERSITÉ DE SHERBROOKE Faculté de génie
Département de génie chimique et de génie biotechnologique
PLA/Starch nanocrystals nanocomposite: study
of crystallinity, gas permeability and
biodegradability
Étude de la cristallisation, perméabilité et
dégradabilité de nanocomposites Poly
lactique acide / Nanocristaux d’amidon
Thèse de doctorat
Spécialité : génie chimique et de génie biotechnologique
Somayeh Sharafi Zamir
Jury:
Sherbrooke (Quebec) CANADA (February 2020) Pr. Mathieu Robert (Directeur)
Pr. Said Elkoun (Directeur) Pr. Reza Frouzanmehr (Examiner) Pr. Armand Soldera (Examiner) Dr. Patrice Cousin (Examiner)
i
To my parents for their love, kindness and supports
اشغیرد یب تیامح و تبحمو قشع یارب مردام و ردپ هب
ن
i
Résumé
Le mélange d'amidon et de PLA est une approche bien connue et économique permettant d’obtenir les propriétés désirés en fonction des besoins de l’industrie. Le composite PLA/amidon est l’un des mélanges les plus prometteurs offrant de nombreux avantages car le PLA présente des caractéristiques exceptionnelles, telles que des propriétés mécaniques élevées (ex : résistance élevée), une bonne transparence, une biocompatibilité et une biodégradabilité. De plus, le PLA est l’un des polymères bioplastiques le plus largement utilisé, qui convient parfaitement aux applications d’emballages alimentaires. Cependant, le PLA présente certains inconvénients tels que la fragilité, une faible rigidité à l'état fondu, un faible taux de cristallinité, taux d'oxygène élevé et une perméabilité élevée à la vapeur d'eau. Jusqu'à maintenant, des nombreux méthodes différents ont été préparés pour améliorer la cristallinité et les propriétés de barrière du PLA, tels que l'ajout d'agents de nucléation, l'ajout de plastifiants et aussi l'ajout d'une combinaison d'agents de nucléation et de plastifiants. Parmi ceux-ci, l’ajout d’agents de nucléation est l’un des méthodes les plus polyvalents de renforcer non seulement le taux de cristallinité mais aussi d’induire une taille et une structure cristalline plus uniforme qui contrôlent d’autres propriétés. De plus, il a été démontré que l’ajout d’agents de nucléation peut modifier les structures cristallines et d’autres propriétés physiques du PLA, telles que les propriétés mécaniques et les propriétés de barrière aux gaz. L'ajout d'agents de nucléation est une approche efficace et polyvalente pour améliorer non seulement le taux de cristallisation, mais également les propriétés de barrière aux gaz des nanocomposites de PLA. L'ajout d'agent de nucléation crée un obstacle physique au passage des molécules de gaz. Il peut donc être une option unique pour concevoir les propriétés de barrière des nanocomposites de PLA. Au cours des dernières années, on s’intéresse de plus en plus au renfort des propriétés de barrière des PLA par l’ajout de nano-charges bio tels que les nano-cristaux d’amidon (SNCs). Les SCNs sont l’un des nano-bio-matériaux les plus prometteurs qui conservent non seulement les propriétés de l’amidon telles que la renouvelabilité, la non-toxicité et la biodégradabilité, mais aussi une surface spécifique élevée, une homogénéité élevée et donc une énergie de surface élevée. Cependant, PLA et SNCs ont une faible adhésion interfaciale en raison de l'incongruité de leur hydrophilie. En effet, il est nécessaire de renforcer la compatibilité entre deux composants. Le greffage de SNCs avec des molécules biosourcées telles que l’acide lactique (LA) semble produire des matériaux hydrophobes pour SNCs, ce qui peut augmenter l’adhésion interfaciale entre SNCs et PLA. LA est un acide organique avec différents groupes fonctionnels
ii
(ex -COOH). Donc, il peut réagir avec les SNCs pour créer un ester. En utilisant cette méthodologie d'estérification simple, la fonctionnalisation covalente des SNCs permet leur bonne dispersion dans les composites correspondants. Par ailleurs, LA est un monomère de structure cristalline de PLA. Par conséquent, la modification chimique des SNCs avec LA ne conduit pas seulement à un composite entièrement biodégradable, mais augmente également l'adhésion interfaciale entre le PLA et les SNC. Dans ce travail, les SNCs ont été greffées chimiquement avec de l'acide lactique par réaction d'estérification et leur compatibilité avec la matrice PLA a été étudié de manière exhaustive. Dans la deuxième étape, l’effet des SNCs greffées en tant qu’agent de nucléation sur la cinétique de cristallisation (nucléation, taux de croissance de la sphérulite) du PLA a été déterminé. Cela est obtenu en comparant le comportement de cristallisation de nanocomposites PLA/SNCs-g-LA à différentes concentrations de nanoparticules de SNCs-g-LA. Par ailleurs, l'aptitude des SNCs à contrôler les conformations cristallines et les structures cristallines du PLA (α et α') est étudiée. Cette partie ouvre la voie à la recherche de concentrations optimales de nanoparticules de SNCs-g-LA sur la structure cristalline impaire de contrôle. Dans cette étude, on examine l'effet des nanoparticules et de la cristallinité de SNCs-g-LA sur la perméabilité à l'oxygène et à la vapeur d'eau de PLA en raison de la modification de l'épaisseur et de la cristallinité de ses cristaux.
Mots clés: Poly (acide lactique), SNCs, agents de nucléation, cristallisation et propriétés de barrière.
iii
Summary
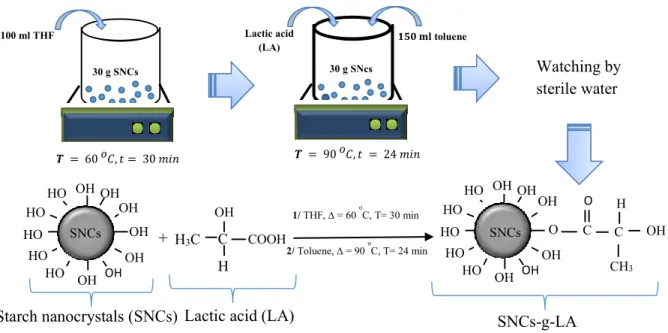
Blending of Poly (lactic acid) (PLA) with starch is a promising and economical approach to achieve desirable properties according to the needs of the food packaging industry. PLA/starch blend offers several benefits compared to other biodegradable polymer blend because of desirable characteristics of PLA such as high mechanical properties (i.e. high strength), good transparency, biocompatibility and biodegradability. In addition, PLA is one the most widely available bioplastic polymer that is suitable in food packaging applications. However, PLA has some drawbacks such as low melt rigidity, low rate of crystallinity and high oxygen and water vapor permeability. Until now, many different methods have been found to improve the crystallinity and barrier properties of PLA such as adding nucleating agents, adding plasticizers, and adding combination of nucleating agents and plasticizers. Among them, adding nucleating agents is one the most versatile method due to the fact that they not only enhance the rate of crystallinity but also induce a more uniform crystalline size and crystal structures. In addition, it has been shown that the adding of nucleating agents can modify crystalline structures and other physical properties of PLA such as gas barrier properties. This is because of the fact that pure PLA has a higher amorphous to crystalline content, which is known to facilitate gas permeability. Thus, the addition of nucleating agent can create physical obstacle and hindered the passage of the gas molecules and therefore improve the barrier properties of PLA nanocomposite. In recent years there is a growing interest on enhancing crystallinity of PLA by adding natural nano-fillers such as starch nanocrystals (SNCs). SNCs is one of the most promising natural nano-filler that not only retains starch properties such as renewability and biodegradability but also, has high specific surface area, high homogeneity and hence high surface energy. However, PLA and SNCs have a poor interfacial adhesion due to the difference in their hydrophilicity. Therefore, there is a need to enhance the compatibility between two components. Grafting of SNCs with bio-based molecules such as lactic acid (LA) result in hydrophobic SNCs materials which can then increase the interfacial adhesion between SNCs and PLA. LA is an organic acid with different functional groups (i.e.−COOH). Hence, some –OH functional groups of SNCs can replace with −COOH groups to create an ester bond. Using this straightforward esterification methodology, covalent functionalization of SNCs, enables good dispersion of SNCs into the corresponding composites. Moreover, LA is a monomer of PLA crystal structure. Therefore, chemical modification of SNCs with LA not only results in an entirely biodegradable composite but also increase the interfacial adhesion between PLA and
iv
SNCs. In the first step of this work, SNCs were chemically grafted with lactic acid (SNCs-g-LA) through esterification reaction and their compatibility with PLA matrix was studied comprehensively. In the second step, the effect of SNCs-g-LA as a nucleating agent on the kinetics of crystallization (nucleation and spherulite growth rate) of PLA was determined. This was done by comparing crystallization behaviour of PLA/SNCs-g-LA nanocomposites at different concentrations of SNCs-g-LA nanoparticles. Additionally, the ability of SNCs-g-LA nanoparticles to control crystalline conformations ( 𝛼 𝑎𝑛𝑑 𝛼′), phase transition temperature and melting behaviour of PLA from melt state are studied. Finally, the effect of impermeable crystalline regions and 𝛼 𝑎𝑛𝑑 𝛼′ structures on the oxygen and water vapour permeability of PLA nanocomposites is examined.
v
Acknowledgement
I would like to thank Prof. Mathieu Robert and Prof. Saïd Elkoun for their support, patience, motivation, and immense knowledge during my PhD program. I really grateful to Prof. Frouzanmehr, Prof. Soldera and Prof. Groleau for evaluation of my thesis. Also, I would like to express my appreciation to Dr. Babak Fathi, and all of my colleagues in Carrefour of Innovative Technologies and Eco-design (CITÉ) who shared their knowledge and information. Finally, I appreciate the help and cooperation of technical staffs at Center for characterization of Materials (CCM) of the Université de Sherbrooke, Mme. Sonia Blais, M. Charles Bertrand, M. Carl St. Louis, and M. Stephane Gutierrez for being great help during my PhD. Most importantly, I would like to thank my family and my Ph.D would have been not possible without the love and patience of my family. My immediate family, to whom this dissertation is dedicated to, has been a constant source of love, concern, support and strength all these years. I warmly appreciate my all of my friends in Sherbrooke for their supports as well.
vi
TABLE OF CONTENTS
RÉSUMÉ ... .i SUMMARY ...iii ACKNOWLEDGEMENT ...v LIST OF FIGURES ...xLIST OF TABLES ... xiii
LIST OF SYMBOLS ... xiv
Chapter 1 ... 1 1.1. Introduction ... 1 1.2. Objectives ... 3 1.2.1. Objective 1 ... 3 1.2.2. Objective 2 ... 3 1.2.3. Objective 3 ... 4 1.2.4.Objective 4 ... 4 1.3. Original Contribution ... 4
1.4. Organization of the Thesis ... 5
Chapter 2 ... 6
2.2. Literature Review ... 6
2.2.1. Lactic Acid (LA) ... 6
2.2.2. Crystal Structures of PLA ... 7
2.2.3. Crystallization Behaviour of PLA ... 8
2.2.4. Dual Melting Behavior of PLA ... 10
2.5. Effect of Nucleating Agents on the PLA Crystallization ... 11
2.2.6. Nucleating Rate Measurement ... 13
2.2.7. Starch ... 14
2.2.8. Starch Nanocrystals (SNCs) ... 16
2.2.9. PLA/Starch Blends, Composites and Copolymers ... 17
2.2.10. Crystallization of PLA/Starch Blend ... 19
2.2.11. Barrier Properties of PLA ... 21
2.2.12. Barrier Properties PLA Nanocomposites ... 24
2.2.13. Barrier Properties of PLA/SNCs Nanocomposite ... 29
vii
Chapter 3 ... 33
3. Chemical Compatibility of Lactic Acid grafted Starch Nanocrystals (SNC) with Polylactic acid (PLA) ... 33 3.1. Résumé ... 33 3.2. Abstract ... 34 3.3. Introduction ... 35 3.4. Experimental ... 36 3.4.1. Materials ... 36
3.4.2. Extraction of Starch Nanocrystals (SNCs) ... 37
3.4.3. Surface Modifications of SNCs by LA... 37
3.4.4. Preparation of PLA Nanocomposites ... 38
3.4.5. Characterizations ... 38
3.5. Results and Discussion ... 40
3.5.1. FT-IR Analysis of SNCs and SNCs-g-LA Nanoparticles ... 40
3.5.2. XPS Analysis of SNCs and SNCs-g-LA Nanoparticles ... 41
3.5.3. XRD Analysis of SNCs and SNCs-g-LA Nanoparticles ... 42
3.5.4. Morphology of SNCs and SNCs-g-LA Nanoparticles ... 43
3.5.5. Thermogravimetric Analysis ... 44
3.5.6. Contact Angle Measurement ... 45
3.5.7. Wettability of SNCs and SNCs-g-LA Nanoparticles ... 45
3.5.8. Morphology of Neat PLA and PLA Nanocomposites ... 46
3.5.9. Thermal Behaviour ... 48
3.5.10. Dynamic Mechanical Properties ... 49
3.6. Conclusion ... 50
Chapter 4 ... 51
4. Phase Transition and Crystallization Behaviour of grafted Starch Nanocrystals/PLA Nanocomposites ... 51 4.1. Résumé ... 51 4.2. Abstract ... 52 4.3. Introduction ... 53 4.4. Experimental ... 55 4.4.1. Materials ... 55
viii
4.4.2. Extraction of Starch Nanocrystals (SNCs) ... 55
4.4.3. Chemical Modification of SNCs ... 56
4.4.4. Preparation of PLA/SNCs-g-LA Nanocomposites ... 56
4.4.5. Characterization ... 56
4.5. Results and Discussion ... 58
4.5.1. Effect of SNCs-g-LA Nanoparticles on the Crystalline Structures of PLA ... 58
4.5.2. Effect of SNCs-g-LA Nanoparticles on the Melting behaviour of PLA ... 61
4.5.3. Effect of SNCs-g-LA Nanoparticles on the Nucleation Rate of PLA ... 64
4.5.4. The Effect of SNCs-g-LA Nanoparticles on the Spherulite growth rate of PLA ... 67
4.5.5. Effect of SNCs-g-LA on the long period (𝐿𝑎𝑐) of PLA ... 69
4.5.6. Effect of SNCs-g-LA on the Oxygen Permeability of PLA ... 71
4.6. Conclusion ... 72
Chapter 5 ... 74
5. Crystallinity and Gas Permeability of Poly (lactic acid)/Starch Nanocrystals (SNCs) Nanocomposites ... 74
5.1. Résumé ... 74
5.2. Abstract ... 75
Keywords: Poly (lactic acid), grafted starch nanocrystals (SNCs-g-LA), crystallization, crystal structures, microstructure and permeability relations ... 75
5.3. Introduction ... 76
5.4. Experimental ... 78
5.4.1. Materials ... 78
5.4.2. Preparation of PLA/SNCs-g-LA Nanocomposite ... 78
5.4.3. Characterization ... 79
5.5. Results and Discussion ... 81
5.5.1. Melting Behavior of PLA/SNCs-g-LA Nanocomposites ... 81
5.2.2. Crystalline Structures of PLA/SNCs-g-LA Nanocomposites ... 83
5.5.3. Long Period (Lac) of PLA/SNCs-g-LA Nanocomposites ... 85
5.5.4. Spherulite Morphology of PLA/SNCs-g-LA Nanocomposites ... 86
5.5.5. Gas Transport Properties of PLA/SNCs-g-LA Nanocomposites ... 89
5.6. Conclusion ... 91
ix
6. Biodegradation of PLA/grafted SNCs Nanocomposite in Soil ... 92
6.1. Résume ... 92
6.2. Abstract ... 93
6.3. Introduction ... 94
6.4. Experimental ... 96
6.4.1. Materials ... 96
6.4.2. Preparation of PLA Nanocomposite ... 96
6.4.3. Soil Burial Degradation Experiments ... 96
6.4.4. Weight Loss ... 97
6.4.5. Fourier-Transform Infrared Spectroscopy (FT-IR) ... 97
6.4.6. X-ray Photoelectron Spectroscopy (XPS) ... 97
6.4.7. Scanning Electron Microscopy (SEM) ... 98
6.4.8. Differential Scanning Calorimetry (DSC) ... 98
6.4.9. Thermogravimetric Analysis (TGA) ... 98
6.5. Results and Discussion ... 98
6.5.1. Weight Loss Measurement ... 98
6.5.2. Morphological Properties ... 99 6.5.3 XPS Analysis ... 102 6.5.4. FT-IR Analysis ... 103 6.5.5. Thermal Properties ... 104 6.5.6. Thermal Stability ... 107 6.6. Conclusion ... 108 Chapter 7 ... 110 7.1. Conclusion ... 110 7.2. Conclusion ... 111
8. Summary of Major Contributions (Publications) ... 113
x
LIST OF FIGURES
Figure 2.1. The L- and D- enantiomers of lactic acid [2].………...……6
Figure 2.2. Spherulite growth rate and half time of the crystallization of PLA [26].………..9
Figure 2.3. Melting behaviour of PLLA isothermally crystallized in a) 96℃ ≤ TC ≤ 108℃, b) 110℃ ≤ Tc ≤ 124℃ and c) 126℃ ≤ TC ≤ 146℃ [31]………....…..11
Figure 2.4. Isothermal cold crystallization of PLA at different temperature a) fractional crystallinity vs. time an b)Avrami plots [46]…………..…..………12
Figure 2.5.Diffrent source of starch and SEM images of corn, wheat and potato starch………...14
Figure2.6.Schematic of starch granules a) the granules (2-100 μm), b)amorphous and semicrystalline rings (150-200 nm),c) blocklets (20-50 nm),d) amorphous and crystalline lamella (9-19 nm) and finally e) amylose and amylopectin chains (0.1-1 nm) [7]…………...…15
Figure 2.7. TEM image of SNCs from different resources a) pea starch and b) potato starch [49].………..………..…….………16
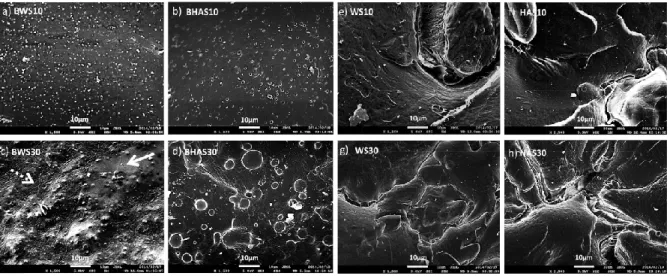
Figure 2.8. Morphology of PLA/starch composites with added butyl-etherified waxy (BWS) and high amylose starch (BHAS), non-butyl-etherified waxy (WS) and high amylose starch (HAS) at 10% w/w and 30%w/w starch addition levels [74]………...…………19
Figure 2.9. Barrier properties of PLA in comparison to other common polymers, Low-density polyethylene (LDPE), polyethylene terephthalate(PET) and polystyrene (PS) at 30 °C [81-82].………...……….…22
Figure 2.10. Average permeability as a function of Mw and kinetic diameter of different gases [91]……….……….24
Figure 2.11. The structure of the polymer and clay nanocomposite [97].………..…...…26
Figure 2.12. Schematic illustration of tortuosity for diffusion penetrant………..30
Figure 3.1. Reaction schematic of the chemical modification of SNCs with LA. ……..……….37
Figure 3.2. FTIR analysis of the a) SNCs and b) SNCs-g-LA nanoparticles. ……….…41
Figure 3.3. XPS spectra of a) SNCs and b) SNCs-g-LA nanoparticles. ………..…42
Figure 3.4. WAXS patterns of a) SNCs and b) SNCs-g-LA nanoparticles ……….43
Figure 3.5. TEM micrographs of SNCs and SNCs-g-LA nanoparticle……….………..44
xi
Figure 3.7. Wettability of a) Neat SNCs b) Grafted SNCs in a mixture of solvents lower phase (dichloromethane) and upper phase (water).………..………..…46 Figure 3.8. SEM micrographs of; (a) Neat PLA, b) LA (5 wt%), (c) PLA/SNCs-g-LA (10 wt%), (d) PPLA/SNCs-g-LA/SNCs-g-PLA/SNCs-g-LA (20 wt%), (e) PPLA/SNCs-g-LA/SNCs-g-PLA/SNCs-g-LA (30 wt%) and (f) PPLA/SNCs-g-LA/neat SNCs (5 wt%) nanocomposite ………..…….…47 Figure 3.9. DSC thermograms of neat PLA, PLA/SNCs and PLA/SNCs-g-LA nanocomposites with different concentrations of SNCs-g-LA nanoparticles at the (a) second heating and (b) cooling scan.……….………..……….…48 Figure 3.10. DMA analysis of neat PLA, PLA/SNCs (5 wt%) and PLA nanocomposites with diffrent concentrations of SNCs-g-LA concentrations, (a) Storage modulus and (b) damping factor (tanδ) ………...………49 Figure 4.1. WAXD patterns of a) neat PLA, b) PLA/SNCs-g-LA (3 wt%), c) PLA/SNCs-g-LA (5 wt%) and d) PLA/SNCs-g-LA (7 wt%) nanocompsoites………...…59 Figure 4.2. Lattice spacing of the (110)/(200) diffractions (d110/200) of neat PLA and PLA nanocompsoites with different concentrations………..………...60 Figure 4.3. Melting behaviour of a) neat PLA, b) PLA/SNCs-g-LA (3 wt%), c) PLA/SNCs-g-LA (5 wt%) and d) PLA/SNCs-g-LA (7 wt%) nanocompsoites………...………..…62 Figure 4.4. Equlibrium melting point of neat PLA and PLA nanocompsoites with different concentrations.………..………...…63 Figure 4.5. Plot of ln [-ln (1 - X(t)] versus lnt of neat PLA and PLA nanocompsoites with different concentrations. a) neat PLA, b) PLA/SNCs-g-LA (3 wt%), c) PLA/SNCs-g-LA (5 wt%) and d) PLA/SNCs-g-LA (7 wt%)………....……65 Figure 4.6. The t1/2 of neat PLA and PLA/SNCs-g-LA nanocomposites with different concentrations of SNCs-g-LA nanoparticles………..…….66
Figure 4.7. Spherulite growth rate of neat PLA and PLA nanocomposites measured at different
isothermal crystallization temperatures……….67
Figure 4.8. Spherulite morphology of a) neat PLA, b) g-LA (3 wt%), c) PLA/SNCs-g-LA (5wt%) and d) PLA/SNCs-PLA/SNCs-g-LA (7 wt%) nanocomposites which measured at
xii
Figure 4.10. SAXS patterns of a) neat PLA, b) PLA/SNCs-g-LA (3 wt%), c) PLA/SNCs-g-LA (5 wt%) and d) PLA/SNCs-g-LA (7 wt%) nanocomposite which is crystallized at different isothermal crystallization temperatures.………..……....70 Figure 4.11. Oxygen permeability (OP) of PLA and PLA nanocomposite crystallized at different crystallization temperatures………...72 Figure 5.1. The melting behaviour of a) neat PLA, b) PLA/ g-LA (3 wt%), c) PLA/ SNCs-g-LA (5wt%), b) PLA/ SNCs-SNCs-g-LA (7 wt%), nanocomposites which are crystallized at different crystallization time at Tc=130℃………...………....82 Figure 5.2. The WAXS analysis of a) neat PLA, b) LA (3 wt%), c) PLA/SNCs-g-LA (5 wt%), b) PPLA/SNCs-g-LA/SNCs-g-PLA/SNCs-g-LA (7 wt%), nanocomposites which are crystallized at different crystallization time at Tc=130℃………..………...….84 Figure 5.3. The SAXS analysis of a) neat PLA, b) PLA/SNCs-g-LA (3 wt%)...………..…86 Figure 5.4. Optical microscopic images of neat PLA at a) 10 min b) 20 min, c) 30 min d) 40 min and e) 60 min, and PLA/SNCs-g-LA (5 wt%) nanocomposite a’) 10 min, b’) 20 min, c’) 40 min d’) 80 min and e’) 100 min…...………....88 Figure 5.5. a) Oxygen and b) water vapor permeability of neat PLA and PLA/SNCs-g-LA nanocomposites which are crystallized at 130°C at various crystallization time…….……...…90 Figure 5.6. SEM images of; a) neat PLA, b) PLA/SNCs-g-LA (3 wt%), c) PLA/ SNCs-g-LA ( 5 wt%) and d) PLA/SNCs-g-LA ( 7 wt%) nanocomposites.…...………90 Figure 6.1. Weight loss of neat PLA, PLA/SNCs and PLA/SNCs-g-LA nanocomposites at different degradation time...99 Figure 6.2. The SEM images of neat PLA, PLA/SNCs and PLA/SNCs-g-LA nanocomposites at different degradation time………..101 Figure 6.3. high resolution XPS C1s spectra of a) neat PLA, b) PLA/SNCs and c) LA nanocomposites before degradation and a’) neat PLA, b’) PLA/SNCs and c’) PLA/SNCs-g- PLA/SNCs-g-LA nanocomposites after degradation for 90 days………...…………..102 Figure 6.4. FTIR analysis of a) neat PLA, b) PLA/SNCs and c) PLA/SNCs-g-LA nanocomposites at different degradation time……….……….103 Figure 6.5. DSC analysis of a) neat PLA, b) PLA/SNCs and c) PLA/SNCs-g-LA nanocomposites at different degradation time………..………104
xiii
Figure 6.6. TGA curves of a) neat PLA, b) PLA/SNCs and c) PLA/SNCs-g-LA nanocomposites after different degradation time………...………...………106
LIST OF TABLES
Table 2.1. Properties of PLA crystal structures [14,19]……….…...8 Table 2.2. The effects of different extraction methods and starch sources on SNCs size..………..17 Table 3.1. Relative atomic percentages of oxygen and carbon, O/C ratio and atomic concentrations of different peaks obtained by XPS on SNCs and SNCs-g-LA nanoparticles …………...…….…42 Table 3.2. Thermal properties of neat PLA and PLA/SNCs-g-LA nanocomposites..……….49 Table 4.1. The effect of SNCs-g-LA nanoparticles concentrations on n and k of PLA…………..66 Table 5.1. DSC and WAXS data of PLA and PLA/ SNCs-g-LA nanocomposite which are crystallized at 130℃ and at various crystallization time ………83 Table 6.1. Deconvolution of C1s core level spectra in neat PLA, PLA/SNCs and PLA/SNCs-g-LA nanocomposites before and after soil burial degradation …..……….……..…102 Table 6.2. Thermal properties of a) neat PLA, b) PLA/SNCs and c) PLA/SNCs-g-LA nanocomposites at different degradation time ………...106 Table 6.3. TGA data of neat PLA, PLA nanocomposites at different degradation time………....107
xiv
List of Symbol List of Acronyms
Symbol Symbol Definition
Acronym
Definition
t Time PLA Poly(lactic acid)
X(t) Degree of crystallinity PLLA PLLA Poly(L-lactic acid)
t1/2 Crystallization half-time PDLA Poly(D-lactic acid)
Tm Melting temperature PP poly propylene
Tg Glass transition temperature PEEK Poly(ether ether ketone)
Ts Partial melting temperature TPS Thermoplastic starch
TCC Cold crystallization temperature CNC Cellulose nanocrystals
ΔHCC Cold crystallization enthalpy CNT Carbon nanotubes
n Avrami exponent MWCNT Multiwall carbon nanotube
K Avrami constant CB Carbon black
SGR Spherulite growth rate MCB Modified carbon black
Mn Number-average molecular
weight
PEG Polyethylene glycol
Mw Weight-average molecular
weight
PPG Polypropylene glycol
WVTR Water vapor transmission rate CO2 Carbon dioxide
OTR Oxygen transmission rate PP Polypropylene
RH Relative humidity PB Polybutylene
XPS X-ray photoelectron
spectroscopy SNCs
Starch nanocrystals
DMA Dynamic mechanical analysis CNCs Cellules nanocrystals
OP Optical microscopy CNW Cellulose nano wicker
WAXD Wide Angel X-ray Diffraction CNF Cellulose nano fiber
SAXS Small Angle X-ray Diffraction H2SO4 sulfuric acid
TEM Transmission Electron
Microscopy MDI methylenediphenyl diisocyanate
TGA Thermogravimetric analysis MA and malic anhydride
DSC Differential Scanning
Calorimetry TPS
Thermo plastic starch
FTIR Fourier transform infrared
spectroscopy PS poly styrene
XRD X-ray Diffraction PET Poly (ethyleneterephthalate)
SEM Scanning electron microscopy
ROP ring-opening polymerization
RAF rigid amorphous fraction
MAF Mobil amorphous fraction
NNAs nanosized nucleating agents
ROP ring-opening polymerization
1
Chapter 1
1.1. Introduction
Development of bio-based and bio-degradable polymers is an important step towards replacement of traditional synthetic plastic materials [1–4]. Among the different bio-based and bio-degradable polymers, Poly (lactic acid) (PLA) has been subjected of many previous investigations due to its commercial availability and easy in proccessability [2–5]. In addition, PLA possesses remarkable properties including good tensile (50-70 MPa) and impact (2.5 kJ/m2) strength, high transparency (equivalent to that of its petroleum-based counterpart) and good biocompatibility [1,2,4,5]. Therefore, these attractive properties of PLA make this polymer as a potential candidate for various applications specifically in food packaging industry where it’s global production is currently ~0.20 million tons in 2016 [5]. This figure is likely to be double by 2026 [5]. However, PLA has some shortcomings that do not fulfill all the prerequisites of the food packaging industry. It has been demonstrated that the slow rate of crystallization and low degree of crystallinity of PLA decreases the melting strength that can lead to a failure in polymer processing. In addition, PLA has high oxygen and medium water vapor permeability. The oxygen transmission rate (OTR) of PLA ranges between11000 to 36000 mL μm m−2day−1 at 23 ℃ while the water vapor transmission rate (WVTR) of PLA is around 5250 mL μm m−2day−1 at 90 RH which is 35% and 43% lower than OTR and WVTR of PET respectively [7]. It has been shown that there is a close relationship between gas permeability (i.e. oxygen and water vapor) and microstructure of semicrystalline polymers such as PLA. Therefore, study of the crystalline organization of PLA is considered as a fundamental step in order to engineer physical properties of PLA such as gas barrier properties. Gas barrier properties has a close relation with the distribution of the amorphous and different crystalline structures. In particular, different crystalline forms of PLA namely 𝛼 𝑎𝑛𝑑 𝛼′− crystal structure are observed via using specific thermal history. The disordered 𝛼′− structure is considered as a metastable crystalline form and it transformed into more ordered 𝛼 −structure upon heating above 120 ℃. However, below 120 ℃ a mixture of 𝛼′ and 𝛼 −crystal structure are found to be stable. Therefore, the crystallization temperature is an important parameter to be considered because even a small variation in the thermal history can lead to the development of a different crystalline structure [17]. Moreover, crystallization
2
behaviour, gas barrier properties and biodegradability are influenced by the crystalline structures. Therefore, a better understanding of the crystallization behaviour of PLA and of its effect on the gas barrier properties are critical steps in order to extend the application of PLA. Several studies have been published with an aim to understand and to control PLA crystallization by the use of proper nucleating agents and processing conditions. Numerous nucleating agents have been suggested to enhance crystallinity and gas barrier properties of PLA such as talc, clay (montmorillonite and kaolinite) and silicate oxides [8].
In recent years there is a growing interest in blending PLA with natural nano-size nucleating agents. Blending of PLA with natural nano-size nucleating agents is a promising technique and has led to development of more efficient PLA nanocomposites with desirable properties for food packaging industry [4,7,9,10]. Among the various natural nano-size nucleating agents, starch nanocrystals (SNCs) is regarded as the most promising candidate for improving PLA properties [4,7,9,10]. SNCs have several advantages over normal starch including greater mechanical stability, easier chemical modification due to the higher surface area which enable SNCs to disperse easily in polymer matrix and decent homogenity compared to native starch [4,7,9,10]. Blending of PLA with SNCs not only reduces the cost of the final products but also, enhances biodegradability of PLA. However, it is well documented that there is a poor interfacial adhesion between PLA and SNCs because of differences in their surface chemistries which results in their incompatibility and limits PLA/SNCs nanocomposites applications [10,11]. Previous studies have shown that the enhancement of interfacial adhesion between SNCs and PLA matrix can lead to substantial improvement in the thermal and mechanical properties [10]. Recently, there has been growing interest on chemical modifications of starch by grafting reactions such as esterification, etherification and double modifications to enhance the compatibility between starch and PLA. However, most of these functional groups are toxic and they are not allowed to be used in food packaging industry. Therefore, there is a need to develop an appropriate and non-toxic grafting method.
A detailed literature review has shown that despite of a number of research works focused on the effect of the modified SNCs on the thermal and mechanical properties of PLA, there is only a handful studies which have reported the effect of renewable and biodegradable polymer materials such as SNCs on the crystallinity and gas barrier properties of PLA. Yet, most of these studies have neglected the presence of both 𝛼′𝑎𝑛𝑑 𝛼 − structures in crystalline PLA and the effect of
3
these crystalline structures on gas barrier properties. Therefore, a full understanding of the crystallization behaviour, morphology and crystalline conformations of PLA/SNCs is essential to optimize the gas permeability (i.e. oxygen and water vapor) of PLA/SNCs nanocomposites.
1.2. Objectives
1.2.1. Objective 1
The first objective of this work is to chemically modify the SNCs surface by lactic acid (LA) to fabricate a biodegradable and renewable nanocomposite and engineer its thermal and mechanical properties. Grafting of SNCs with an effective bio-based molecules such as LA with different functional groups (i.e. hydroxyl and carboxyl groups) results in hydrophobic SNCs materials which can increase the interfacial adhesion between SNCs and hydrophobic polymer materials. Using this simple esterification methodology, functionalization of SNCs with LA, enhances the dispersion state of SNCs into the corresponding nanocomposite and increases chemical affinity between two components. Moreover, LA is a monomeric unit of PLA crystal structure. Therefore, chemical modification of SNCs with LA (SNCs-g-LA) not only enhances the chemical affinity but also, increases crystallographic interactions or physically interactions between PLA and SNCs-g-LA nanoparticles.
1.2.2. Objective 2
The second objective of this work is to explore the role of SNCs-g-LA nanoparticles as a nucleating agent on the kinetics of crystallization and crystallization behaviour of PLA. We used isothermal thermal analysis to map the nucleation- and the growth-crystallization of PLA/SNCs-g-LA nanocomposites and explore the effect of SNCs-g-LA concentrations on the resulting microstructure. Firstly, the effect of SNCs-g-LA varying in concentrations (3, 5 and 7 wt%) on the crystallization behaviour and half time (𝑡1/2) of PLA were studied. Then, crystallization kinetics and the activation energy were quantified using by Avrami equation as a function of Tc (80-130 ℃). In addition, spherulitic growth rate and morphology of PLA nanocomposites were studied for the same range of Tc. Then, the influence of SNCs-g-LA varying in concentrations on the phase transition and melting behaviour were determined. This provided a better insight on the effect of SNCs-g-LA nanoparticles on the promotion of crystalline structures (𝛼 and 𝛼′) of PLA. Finally, the effect of SNCs-g-LA nanoparticles on the oxygen and water vapour permeability of
4
PLA nanocomposite due to modification in its crystal thickness and 𝛼 and 𝛼′-crystalline structures were quantified.
1.2.3. Objective 3
The third objective is to determine, the effect of 𝛼 − crystalline structure on the oxygen and water vapor barrier properties. For this purpose, different weight percentage (wt%) of SNCs-g-LA nanoparticles were incorporated into PLA and crystallized above 130 ℃, where 𝛼- structure of PLA is observed, for different crystallization time and subsequently oxygen and water vapour permeability of PLA nanocomposites were studied. The obtained results are intended to help us to improve our understanding the effect of induced crystalline structures (i.e. 𝛼 −structure) on the barrier performance of PLA films. Finally, optimized crystallization conditions were determined and the gas transport properties of the crystallized PLA nanocomposite are discussed.
1.2.4. Objective 4
The fourth objective is to determine the effect of SNCs-g-LA nanoparticles on the soil burial degradation of PLA. The effect of esterification modification of SNCs and soil burial degradation time on the degradation properties of PLA nanocomposites were investigated and compared with the degradation results of neat PLA and PLA/neat SNCs nanocomposite degradation.
1.3. Original Contribution
The present work demonstrates several original and novel ways to improve the crystallinity and permeability of PLA nanocomposites. In the first section, SNCs is grafted by lactic acid (LA) and subsequently, their compatibility with PLA matrices were demonstrated. Additionally, thermal and mechanical properties of PLA/SNCs-g-LA with various concentrations of SNCs-g-LA were investigated. In the second part, the effect of various concentrations of SNCs-g-LA on kinetics of crystallization (nucleation and spherulite growth rate) were shown. While in the third part, the effect of SNCs-g-LA content on the crystalline structures, phase transition temperature and phase content were investigated. The effect of the more ordered crystalline structure from melt state on gas permeability (oxygen and water vapor permeability) were investigated at different crystallization time. Finally, the effect of esterification modification of SNCs and soil burial degradation time on the degradation properties of PLA nanocomposites were examined.
5
1.4. Organization of the Thesis
The thesis has been organized in the following manner. In chapter 2, a literature review on PLA crystallization has been presented in three parts. A general knowledge on crystallization of PLA, its crystalline phases and the ways that have been employed so far to improve the crystallinity of PLA and barrier properties is reflected in the first section. The second part focused on different chemical surface modifications of SNCs and effect of SNCs on the crystallinity and permeability of PLA. Chapters 3 to 6 cover the four distinct core experimental parts responding to the three main objectives described previously. Chapter 3 presents a study on the chemical compatibility of lactic acid grafted starch nanocrystals (SNCs) with polylactic acid (PLA). In chapter 4, phase transition and crystallization behaviour of grafted starch nanocrystals in PLA nanocomposites is studied. Chapter 5 presents the effect crystallinity and gas permeability of Poly (lactic acid)/ Starch nanocrystals Nanocomposites. In chapter 6 the effect of esterification modification of SNCs and soil burial degradation time on the degradation properties of PLA nanocomposites were studied. Finally, chapter 7 briefly outlines the most significant concluding remarks and presents recommendations for the future works in this area.
6
Chapter 2
2.2. Literature Review
2.2.1. Lactic Acid (LA)
Lactic acid (2-hydroxypropionic acid) is primary monomer of PLA. Lactic acid is an organic acid with a chiral center. Due to the chiral center, it exists in two enantiomers forms, L-enantiomers and D-enantiomers, allowing the formation of L-lactide, D-lactide and DL-lactide (meso-lactide). These enantiomers have different effect on the polarized light (Figure 2.1). The properties of PLA are highly depend upon the conformational variation of lactic acid which allows the tuning of PLA microstructure and subsequently its physical properties. There is a worldwide demand for the lactic acid production due to its usages in the production of poly (lactic acid) (PLA). Presently, 90% of the commercial lactic acid production is made by bacterial fermentation while the remaining is produced synthetically by the hydrolysis of lactonitrile. The fermentation processes to obtain lactic acid depends upon the type of bacteria used. L-lactide is produced in humans and other mammals whereas, D-lactide is obtained by the bacterial fermentation of carbohydrates [12,13].
Figure 2.1. The L- and D- enantiomers of lactic acid [2].
O OH H CH3 H OH H O CH3 H OH H OH H
L-Lactide Meso-Lactide D-Lactide
L-lactic acid D-lactic acid
CH3 CH3 CH3 CH3 CH3 CH3 O O O O O O
7
2.2.2. Crystal Structures of PLA
PLA can crystallize in three different crystalline structures called α, β and γ − structure. They are characterized by different helical conformations and cell symmetries depending upon different thermal and/or mechanical treatments used [14]. The α −structure develops when PLA is melted or cold crystallized and it has a well-defined XRD diffraction pattern [15]. The α-structure has a unit cell with a = 1.06 nm, b = 1.737 nm, and c = 2.88 nm parameters with a left handed 103 helix. The β −structure is shaped upon mechanical stretching of the α
-
structure [16]. The chain conformation of the β − structure is left handed 31 helices and it has a unit cell with a = 1.031 nm, b = 1.821 nm, and c = 0.900 nm. The third crystal structure of PLA (γ −structure) is formed by an epitaxial crystallization of PLA [17]. The γ −structure has two antiparallel helices. It has an orthorhombic unit cell for which the 𝑎, b and c lattice parameters are 0.995, 0.625 and 0.88 nm, respectively. Crystal types and parameters of the PLA forms are summarized in Table 2.1.Recently, a new crystalline structure was observed for PLLA samples which is crystallized below 120 ℃ the melt state. This crystal structure is named as 𝜶′-structure and has a slightly altered crystal structure compared to 𝛂-structure. Zhang et al., has been investigated extensively the crystallization of 𝜶′-structure of PLLA by FTIR,WAXS and DSC [15–17]. In the first study, they prepared PLLA samples by isothermal melt-crystallization process and monitored the structural changes of the samples with real-time IR measurement [15]. They observed, the formation of C-O-C backbone during the both induction period and the growth period of PLLA melt crystallization is due to the interchain interactions between CH3 and C = O group. These observations not only provided direct evidence that the disordered 𝛼′-structure of PLA but also showed that the interchain interactions can control the nucleation and growth of polymer crystallization. In a separate work, they studied the crystallization and structural evaluation of PLLA during isothermal crystallization process by IR spectroscopy and two dimensional correlation analysis. They showed that the C=O band shifts to a higher wavenumber during the crystallization of PLLA and it can be attributed to the appearance of a new peak. They concluded that this new peak with a high wavenumber corresponds to the development of the new crystalline phase [16]. In addition, Zhang et al., studied the crystal structure of PLA from melt state with WAXS and DSC analysis [17]. They found that, the disorder (𝛼′) and order (𝛼) crystalline structures of poly (L-lactide) (PLLA) are formed at low (Tc ≤ 100 ℃) and high (Tc ≥ 120 ℃) crystallization temperatures respectively.
8
In addition, they demonstrated that a small exothermic peak around 160 ℃ just prior to the main melting peak can be attributed to the α′-structure, whereas the samples crystallized at T
c above 120 ℃ shows just an endothermic melting peak which is related to the α-structure. In addition, Kawai et al., investigated the effect of the crystallization temperatures on the crystal structure and melting behavior of PLLA by means of WAXS and SAXS analysis [18]. They showed that the ratio of the a- and b-axis lengths of α-structure begins to decrease with Tc below 120 ℃, which suggests a new crystalline form with hexagonal packing, namely, the α′-structure.
Table 2.1. Properties of PLA crystal structures [14,19].
2.2.3. Crystallization Behaviour of PLA
The crystallization of PLLA using both nonisothermal and isothermal crystallizations modes has been quantified over the wide range of temperatures. However, it has been found that the PLLA has a peculiar crystallization behaviour. This was noted for the first time by Vasanthakumari and Pennings [20] who studied the effect of the molecular weight (Mw) and crystallization temperature (Tc) on spherulite growth rate and morphology of PLLA. They observed a clear discontinuity in the spherulite growth rate curve at around 110-120°C. Beside, this discontinuity was observed in the crystallization half-time (t1/2) curve of PLLA in the temperature range of 100 − 120 ℃. Different explanations have proposed in literature for this anomalous behavior [21,22]. Some researchers believed that this phenomenon can be attributed to regime transitions in the crystallinity of PLLA [21]. Regime transition analysis of PLLA demonstrated that transition from regime III to regime II and from regime II to regime I take place around 120 ℃ and 150 ℃ respectively. The transition from regime II to regime I induced trnsformation of spherulites into the hegzagonal lamellar stacking. However, the transition from regime II to regime III, only mirror
Crystal type Crystal structure Cell parameters 𝝆𝒕𝒉𝒆𝒐𝒓𝒆𝒕𝒊𝒄𝒂𝒍 ( 𝒈 𝒄𝒎𝟑) a(nm) b(nm) c(nm) 𝛂(°) 𝛃(°) 𝛄(°) 𝜶 Pseudo-orthorhombic 1.07 0.645 2.78 90 90 90 1.247 𝜶 orthorhombic 1.05 0.61 2.88 90 90 90 1.297 𝜷 orthorhombic 1.031 1.821 0.90 90 90 90 1.275 𝜷 trigonal 1.052 1.052 0.88 90 120 120 1.277 𝜸 orthorhombic 0.995 0.625 0.88 90 90 90 1.312 SC triclinic 0.916 0.916 0.870 109.2 109.2 109.8 1.274 SC triclinic 1.498 1.498 0.87 90 90 120 1.274
9
changes in morphological structure of spherulite was observed. Nevertheless, others believed that the incredible high rate of crystallization below 120 ℃ is attributed to high radial growth rate of spherulites. This is due to the negligible changes in nucleation rate of PLLA in this range of temperature (100−120 ℃ ) [22]. Nevertheless, some authors such as Keith et al. believed that the crystal transition is the responsible of the high rate of the crystallization of PLA [23]. Yasuniwa et al., also confirmed that the high rate of the crystallization is attributed to the crystal transition of PLA [24]. They showed, α′-structure is stable at temperature below 120 ℃, whereas, the α-structure is stable above 120 ℃. In addition, Anderson et al., observes a bimodal behaviour in spherulite growth rate and half time of crystallization of PLLA with molecular weight (Mw) of kg/mol containing 0, 2 and 4% D-isomer (Figure 2-2). They showed that the 𝛼′ to 𝛼-crystal structure ratio is maximum in the PLLA containing 2 and 4% D-isomer and this behaviour is not observed in pure PLLA. In addition, and the bimodal crystal growth rate is attributed to spherulite development not to the changes in the nucleation mechanisms [25], [26].
10
2.2.4. Dual Melting Behavior of PLA
The presence of the dual melting endotherms is very common in semi crystalline polymers and has been observed in many synthetic semicrystalline polymers, copolymers and composites [27,28]. The origin of this dual melting behaviour was reviewed by Liu et al., [27]. They ascribed this phenomena to various of mechanisms such as; a) melt recrystallization during DSC heating procedure, b) the existence of the more than one crystalline structures, c) variation in lamellar morphology such as lamellar size, thickness, distribution and perfection, d) relaxation of rigid amorphous fraction and finally e) different molecular weight (Mw). However, many studies done in the past ascribe the dual melting endotherms to melt recrystallization mechanism. The low melting peak is assigned to the melting of primary crystals, whereas, the high melting peak is attributed to the crystals formed during the crystallization process. Sometimes, there is an exothermic peak before these double endothermic melting peaks that can be associated with the solid state transition and/or the recrystallization. The melting behavior of PLLA with different Mw has been studied extensively by Jamshidi and his co-workers [29]. They found that, the PLLA with Mw < 3000 g/mol has a weak and broad melting peak before the main endothermic peak. They attributed this broad peak to the less ordered crystalline structure. Pan et al., also investigated the effect of Mw on the polymorphous and melting behavior of PLLA [30]. They found that PLLA with high Mw crystallized at low Tc (80℃) shows a double endothermic melting peak whereas, PLLA with low Mw which is crystallized at same Tc shows small exothermic peak before the main endothermic peak. They attributed this melting behaviour to the crystalline transformation phenomena. They showed that almost all the α′-structure transform into the α-one in PLLA with high Mw, whereas, α′-structure only partially transform into the α-one PLA with low Mw. Di lorenzo studied the multiple melting behavior of PLLA by DSC in wide range of temperature (Figure 2.3) [31]. They showed that the endothermic peak (Peak II) is due to the fusion of PLLA crystals with low thermal stability whereas, crystal reorganization result in presence of exothermic peak (peak III) before the main endothermic peak (peak IV). The effect of cooling rate on the double melting behavior of the PLLA is studied by Yasuniwa et al., [25]. They showed that the melting peak ratio decreases by increasing the cooling rates. They attributed this behavior to the melt recrystallization mechanism, where imperfect crystals transform to perfect and stable crystals through the melt-recrystallization mechanism. When the melting rate overcomes that of the recrystallization rate, the endothermic peak appears, while the exothermic peak occurs when the
11
recrystallization rate overwhelms the melting. The double melting behaviors, where the exothermic peak happens before the endothermic peak, were also observed for high molecular weight PLLA (80000 g/mol) [32]. A number of authors attributed this small exothermic peak to a cold crystallization. The double melting behaviors of PLLA were also characterized by X-ray diffraction (XRD). It has been shown that the phase transition from the disorder crystal structure (α′) to the ordered crystal structure (α) occurres at the isothermal crystallization temperature of 100 °C or lower [33]. The lattice spacing calculated from the main diffraction peak, for isothermally crystallized samples at 80 °𝐂 and 100 °𝐂, increases with temperature rise by thermal expansion.
Figure 2.3. Melting behaviour of PLLA isothermally crystallized in a) 𝟗𝟔℃ ≤ 𝑻𝑪 ≤ 𝟏𝟎𝟖℃, b) 𝟏𝟏𝟎℃ ≤ 𝑻𝑪 ≤ 𝟏𝟐𝟒℃ and c) 𝟏𝟐𝟔℃ ≤ 𝑻𝑪 ≤ 𝟏𝟒6℃ [31].
2.5. Effect of Nucleating Agents on the PLA Crystallization
Addition of nucleating agents is one of the most important route that can enhance the nucleation density and nuclaetion rate of polymer materials [26]. Therefore, the addition of nucleating agents speed up the final crystallization rate and decreases cold crystallization temperature (𝐓𝐜𝐜) of polymer materials. Nucleating agents can be grouped into three classes: (a) homogeneous nucleation, (b) self-nucleation and (c) heterogeneous nucleation [26]. Among them, heterogeneous nucleating agent is the most applied approach to enhance the crystallization kinetic of polymer materials. Mechanism of heterogeneous nucleating agents defined by the chemical and physical interactions between polymer matrix and nucleating agents. This interaction decreases the interfacial free energy or barrier energy for stable nucleus formation. Generally, the mechanism of the heterogeneous nucleating is divided into four stages: a) primary nucleation b) primary
12
spherulite growth, c) secondary nucleation and d) secondary spherulite growth. In primary nucleation, a nuclei with a critical size is formed and then the size of this critical nuclei increases with increasing time at a given temperature. In addition free-enthalpy barrier is required for crystal growth of primary nuclei. This nucleus form in the presence of heterogeneous surface area in the case of heterogeneous nucleation. Thus, the total barrier free energy for heterogeneous nucleation is lower than other nucleation. Therefore, using heterogeneous nucleating agent allows to reduce the undercooling temperature, which leads to the formation of smaller crystals and a decrease of process cycle times. Adding nucleating agent also promotes the formation of smaller spherulites and enhances the nucleating density. More importantly, the addition of nucleating agent can determine the type, size and morphology of spherulites of semicrystalline polymers [34].
Heterogeneous nucleating agents for PLA are classified in two different groups; a) chemical nucleating agents and b) physical nucleating agents [35]. Chemical nucleating agents can reduce the nucleation process through a chemical reaction such as organic salts of sodium used in crystallization of PET. However, physical nucleating agents can enhance the kinetic of crystallization by physical interactions. During the last few years, various physical nucleating agents were examined with PLA, including some inorganic nucleating agents such as such as talc [35–37], clay (i.e. MMT, CaCO3 and BaSO4,) [38–40], carbon nanotubes [41], multiwall and carbon black [42]. Additionally, natural nucleating agents have been thoroughly investigated: such as cellulose fibers [43], chitin [44] and starch [45]. An apparent increase in the degree of crystallinity and a reduction in the crystallite size of the PLA were observed after natural nucleating agents were added. In this study we just focused on starch as a nucleating agent for PLA.
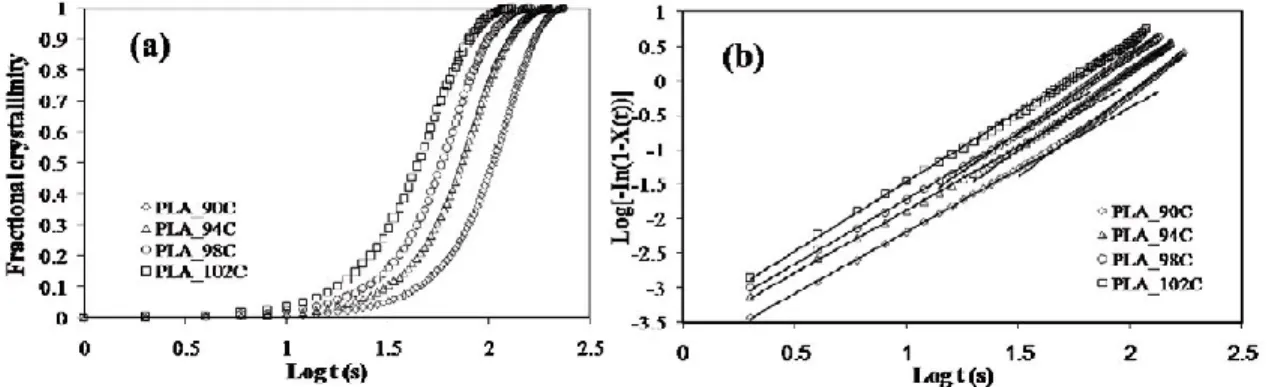
Figure 2.4. Isothermal cold crystallization of PLA at different temperature a) fractional crystallinity vs. time and b) Avrami plots [46].
13
2.2.6. Nucleating Rate Measurement
Nucleation rate and densities are frequently analyzed by the number and size of spherulites per unit volume through Avrami equation (eq.1.1) [49]:
X(t) = 1 − exp(−ktn) (2.1)
where k is the crystallization rate constant and n is the Avrami exponent which depends on the nucleation and growth mechanisms of crystallites.
The Avrami parameters (n and k) can be calculated using the following relation (eq.2.2):
ln(−ln[1 − X(t)]) = nln(t) + lnk (2.2)
Figure 2.4 shows the plot of ln [−ln (1 − X(t)] versus ln (t) of neat PLA at different Tc. In all samples, Avrami plots were found to be linear demonstrating the accuracy of the procedure as shown in Figure 2.4. The slope of line in the plot of ln[−ln(1 − X(t)] versus ln(𝑡) gives the value of n. The exponent is typically between 2 and 4 for polymer crystallization and is associated to the nucleation mechanism (homogeneous or heterogeneous and simultaneous or sporadic. If the nucleation sites are present at the early stage of the nucleation, then this is called simultaneous nucleation. However, when the nuclei form in the polymer matrix at a constant time rate, the nucleation is called sporadic. The higher n values are attributed to three dimensional spherulitic growth with a sporadic or a combination of sporadic and simultaneous nucleation type, whereas the lower amounts are related to two dimensional growth with instantaneous and some sporadic nucleation. Parameter k is a growth rate constant involving both nucleation and growth rate parameters.
14
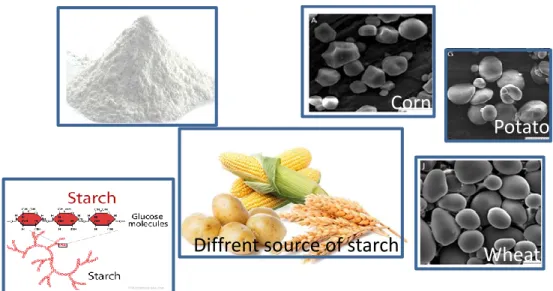
Figure 2.5. Different source of starch and SEM images of corn, wheat and potato starch.
2.2.7. Starch
Starch with chemical formula of (C6H10O6)n is the second most abundant, natural, renewable and biodegradable polymer. Starch is found in a variety of plants as a source of storage energy such as rice, potato, pea, wheat and corn which is termed native starch (Figure 2.5) [7,10,47]. In addition, native starch can be modified using both chemical and physical methods to achieve better properties and is known as modified starch. Depending on the botanical sources, starch granules has diffrent size, shape, crystallinity, and internal molecular organization. Starch is a complex carbohydrate and composed of two main chains namely amylose and amylopectin. Amylose is defined as a linear molecule of glucose units and amylopectin is a branched polymer consisting of relatively short branches of glucose units. Molecular size of amylose ranging from 20 to 800 kg/mol, whereas, the molecular weight of amylopectin ranging from 5000-30,000 kg/mol. Starch is a semicrystalline polymer and its degree of crystallinity, molecular weight, morphology and final product properties deepens upon amylose to amylopectin ratio. Native starch is usually containing 20-30% amylose and 70-80% amylopectin. The crystalline regions are formed by short branched chains in amylopectin whereas, the amorphous regions formed by amylose. Amylopectin is classified into three different types namely, A-, B- and C-type chains. This classification is based on the chain length distribution. Figure 2.6 shows the diffrent levels of organization make up the
Diffrent source of starch
Corn
Wheat
Potato
15
starch granule [7,47,48]. As can be seen in Figure 2.6 starch granules organizes as following; a) the granules (2-100 μm), b) amorphous and semicrystalline rings (120-500 nm), c) blocklets (20– 50 nm), d) amorphous and crystalline lamella (9-19 nm) and finally e) amylose and amylopectin chains (0.1-1 nm). Within this structure, amylopectin is organized in crystalline clusters of double helices forming stacks of alternating crystalline and amorphous lamellae with a regular repeat distance of 9–10 nm. These are embedded in rounded asymmetric structures named blocklets that have a diameter on the 20-50 nm scale. These blocklets, having different sizes, aggregate in alternating amorphous and semi-crystalline radial growth rings which have 100–500 nm thickness. The amorphous rings consist of amylose and amylopectin in a disordered conformation, whereas the semi-crystalline rings are formed by the lamellar structure of alternating crystalline and amorphous regions.
Figure 2.6. Schematic of the starch granules a) the granules (2-100 μm), b) amorphous and semicrystalline rings (120-500 nm), c) blocklets (20–50 nm), d) amorphous and crystalline
lamella (9-19 nm) and finally e) amylose and amylopectin chains (0.1-1 nm) [7].
Amylose and amylopectin molecules amorphous and crystalline lamellea Blocklet Rings
a
b
c
d
e Sugar Unit16
2.2.8. Starch Nanocrystals (SNCs)
Starch nanocrystals (SNCs) are crystallite phase of starch particles and their morphology, crystalline type and size depend on the botanic origin and/or relative proportion amylose to amylopectin of starch granules. SNCs is one of the most brilliant nanomaterials due to their renewability, biocompatibility, biodegradability, non-toxicity. In addition, the high degree of crystallinity, special platelet-like morphology, high surface area, and remarkable physical properties of SNCs make them as an interesting reinforcing agent in a wide variety of polymers nanocomposites resulted in good mechanical, thermal and barrier properties [7,47,48].
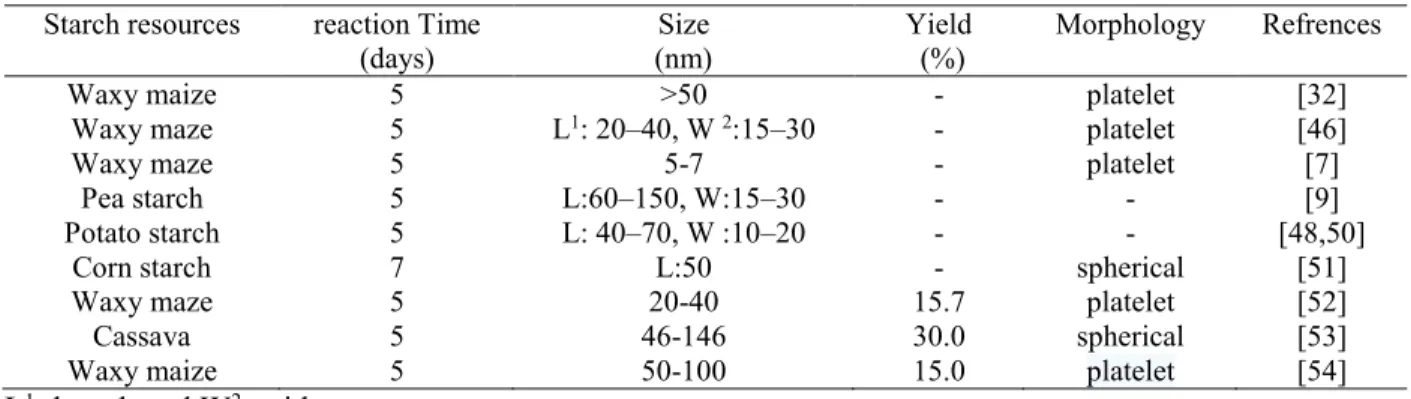
SNCs are synthesized in different ways such as acid hydrolysis, enzymatic treatment, physical treatment, combination of acid hydrolysis and ultrasonication [34,47,48]. Among these different modifications, acid hydrolysis has been widely used for preparation of SNCs, due to it is simple, easy to control and its wide industrial applications. Acid hydrolysis procedure involves hydrolysis of the amorphous regions and enhancing the relative proportion of crystalline regions and double helices regions. Generally, SNCs were obtained by mixing native starch granules with dilute sulfuric acid (H2SO4) or hydrochloric acid (HCl) at 30°C–60°C for different time periods. It has been shown that, acid hydrolysis can effect on the molecular structure, crystalline structure and morphology of SNCs depending on the acid hydrolysis conditions and procedures. Table 2.2 summarizes the effects of different extraction methods and starch sources on SNCs size and Figure 2.7 shows TEM images of SNCs after acid treatment from different resources [49].
17
Table 2.2: The effects of different extraction methods and starch sources on SNCs size.
Starch resources reaction Time
(days) (nm) Size Yield (%) Morphology Refrences
Waxy maize 5 >50 - platelet [32]
Waxy maze 5 L1: 20–40, W 2:15–30 - platelet [46]
Waxy maze 5 5-7 - platelet [7]
Pea starch 5 L:60–150, W:15–30 - - [9]
Potato starch 5 L: 40–70, W :10–20 - - [48,50]
Corn starch 7 L:50 - spherical [51]
Waxy maze 5 20-40 15.7 platelet [52]
Cassava 5 46-146 30.0 spherical [53]
Waxy maize 5 50-100 15.0 platelet [54]
L1: length and W2: wide
2.2.9. PLA/Starch Blends, Composites and Copolymers
PLA/starch polymer blend is one of the most promising polymer blend with benefits of being complete biodegradable, biobased and having desirable properties for packaging applications. However, the difference in surface polarity of PLA and starch leads to an incompatibility between two polymer materials and poor dispersity of starch in PLA matrix. Since PLA is hydrophobic in nature, whereas; starch is hydrophilic in nature and blending of them leads to a poor interfacial adhesion. In order to realize it, various chemical modifications of starch, PLA and both PLA and starch have been realized in the past [55–57]. Among various chemical modifications of starch, surface esterification is the most common rout, during which a number of hydroxyl groups (OH) of the starch are replaced by carboxylic groups (COOH) and form ester functional groups on the starch surface [55–57]. It has been shown that this replacement not only significantly enhances hydrophobicity of starch but also enhances the barrier, crystallinity and mechanical properties of PLA/starch final products [58,59]. Esterification of cassava starch with long-chain fatty acid chlorides in aqueous media at 4 ℃ is carried out by Thitisomboon et al. [57]. They showed that esterified starch enhances the thermal stability and young modulus of PLA/starch blend. In another effort, Zue et al., prepared starch/PLA composites by using dry method and studied the mechanical properties of starch/PLA composite [46]. They found that, the tensile strength and bending strength of esterified starch/PLA were stronger than neat starch/PLA composite. Similarly, Ojobo et al., incorporated lauric acid and replaced of the OH functional groups of the starch chains by using a one-step homogeneous process. They enhanced mechanical, thermal and compatibly of PLA/starch blend [60].
In addition, several studies have been carried out by the combination of the two polymer materials (PLA and starch) and adding different type low molecular weight of compatibilizer such as
18
methylenediphenyl diisocyanate (MDI) and malic anhydride (MA) and plasticizer such as glycerol, sorbitol and triethyl citrate [64-69]. The MDI is one the mostly reported compatibilizer that can enhance the compatibility between PLA and starch polymer materials. MDI is a small molecule, composed of isocyanate groups, which are highly reactive with both hydroxyl and carboxyl groups to form urethane linkages, thus being an effective compatibilizer for these two immiscible materials. Acioli-Moura and Sun reported thermal stability of PLA/starch blend, with or without MDI and they showed that the thermal endurance of PLA/starch blend enhances considerably by adding MDI [61]. Morover, Wang et al., added 5 wt% of MDI into PLA/starch composites and they showed that the tensile strength improved from 62.8 to 68 MPa and elongation at break increased from 2.7 to 4.2%. In addition, malic anhydride (MA) has also used to improve the interfacial adhesion between PLA and starch by grafting on either starch and/or neat PLA [59]. Zuo et al., esterified starch with 1 wt% of MA and they showed that the introduction of a hydrophobic ester bond in starch chains increased the interfacial compatibility between PLA and starch and led to an increase the water resistance and tensile properties PLA/starch blend [62]. However, Orozco et al., grafted MA on the PLA molecular chains using dicumyl peroxide (DCP) as an initiator [63]. They obtained PLA/starch copolymers by reactive blending, varying the starch composition from 0 to 60%. They demonstrated that MA can play as a plasticizer and it enhances not only the compatibility between PLA and starch polymer materials and but also the young modulus. Hwang et al., showed that the esterification of starch with MA can enhance the melt flow of the PLA/starch composite material as well [64]. They grafted MA on both polymers in the presence of DCP in a one-step reactive compatibilization process. They showed that the tensile properties of PLA/starch (80:20) with 2 wt% of MA and 0.1 wt% of DCP enhanced significantly. In addition, Xiong et al., demonstrated that the tung oil anhydride (TOA) as a bio-based reactive plasticizer can increase not only compatibility but also the elongation at break of PLA-starch blends [65]. In addition, PLA-grafted-starch with various lengths and numbers of graft starch chains were synthesized using a trimethylsilyl protection method. The graft-copolymer films exhibited a lower melting temperature, degree of crystallinity, Tg and higher viscosity properties compared to PLA films. For example, Ohya et al., prepared PLA-grafted amyloses by ring-opening anionic polymerization of lactide using the polymeric alkoxide as initiators and subsequent removal of the TMS groups [66]. In another study, Gong et al., prepared copolymers of starch grafted with PLA by in situ polymerization reaction of corn starch with lactic acid in aqueous
19
media in the presence of stannous 2-ethyl hexanoate [Sn (Oct)2] [67]. The procedure of the graft reaction was elucidated, based on the HPLC analysis, as the ring-opening polymerization (ROP) from starch surface. Bolay et al., ball milled PLA and starch without adding any compatibilizer or plasticizer and they showed that the mechanical properties of the blends were improved due to the better interface between the matrix and the filler which is improved by ball milling process [68]. The PLA/starch blends without compatibilizer were studied by Wokadala et al., as well [69]. They chemically modified waxy and high amylose starch particles to increase their hydrophobicity and compatibility with PLA. Although the polymer thermal stability decreased, the modified blend exhibited an improved mechanical performance, while SEM micrographs showed a more homogeneous structure with this starch modification (Figure 2.8). Additionally, this study demonstrated that the amylose/amylopectin content of starch plays an important role in the tensile properties of the starch-PLA blend films. At higher starch levels, composites with butyl-etherified high amylose starch gave a lower elongation at break and tensile strength, as compared to those with butyl-etherified waxy starch, due to the tendency of amylose to self-aggregate.
Figure 2.8.Morphology of PLA/starch composites with added butyl-etherified waxy (BWS) and high amylose starch (BHAS), non-butyl-etherified waxy (WS) and high amylose starch (HAS) at
10% w/w and 30%w/w starch addition levels [74].
2.2.10. Crystallization of PLA/Starch Blend
Starch has a great effect on the crystallization of PLA by increasing nucleation density and decreasing the crystallization half-time (𝒕𝟏/𝟐 ). For example Sun et al., have studied the effect of
20
dry starch (1-40 wt%) on crystallization of PLA [45]. They reported that the 𝒕𝟏/𝟐 of PLA/starch blend decreases from 14 min to 3.2 min. However, effect of starch becoming more significant when it is in thermoplastic state [75–77]. For the first time, Martin and Averous were investigated the crystallinity of PLA/TPS blends [71]. They found that TPS has an effect on the crystallization of PLA. They attributed the higher crystallinity of PLA/starch blend to the higher miscibility between PLA in TPS matrix and/or due to the migration effect of glycerol from the TPS to the PLA phase. Similarly, Jang et al., believed that plasticizer migration is a responsible for crystallization of TPS/PLA blend [72]. They obtained 25% crystalline content upon heating at low rate of crystallization for PLA/dray starch (30 wt%) composites and around 35% crystalline content for PLA/TPS (30 wt%) blend. Another factor to consider in the crystallization of compatibilized PLA/TPS blends is the potential reduction in free energy barrier at the blends interphase. In the case of the PLA/TPS system for example, MA grafted PLA reacts with starch macromolecules to produce graft copolymer of PLA and amylose or amylopectin chains. The PLA segment that is attached to the starch macromolecules would be expected to decrease free barrier energy and thus its crystallization rate can be enhanced. This effect was observed in PLA/starch (55/45) composites where MDI was used as a coupling agent [83]. Similar effect has been investigated for the PLA/TPS blends by Huneault et al., [70]. They studied the effect of interfacial area by compatibilizing the blend using maleic anhydride grafted PLA. They reported that, the crystallization half-time of PLA was decreased significantly (75 s) in presence of the TPS phase and this effect was strengthened by the blends interfacial modification. However, Hwang et al., showed that in the case of PLLA/starch blends, PLA grafted maleic anhydride (MA) reacted with starch showed lower crystallinity as the starch content increased to 30 wt% [64]. In another study, Park et al., gelatinized starch with various content of glycerol and they investigated in terms of the effect of the glycerol addition on crystallinity characteristics of PLA [73]. They found that starch played a role as a nucleating agent and glycerol as plasticizer contributed to an improvement in crystallinity in PLA blends. In addition, Kang et al., studied the effect of chemically modified thermoplastic starch (CMPS) on isothermal crystallization kinetics of PLA [74]. They showed that, in the presence of CMPS the 𝑡1/2 decreases from 24.7 to 3.2 min. In addition, the overall crystallization rate (K) and the Avrami exponent (n) of PLA/CMPS increases and decreases respectively compared to neat PLA which shows higher nucleation rate. Similarly, the thermoplastic starch/poly (lactic acid) (TPS/PLA) composites were prepared using PLA melt
![Figure 2.2. Spherulite growth rate and half time of the crystallization of PLA [26].](https://thumb-eu.123doks.com/thumbv2/123doknet/4948546.122009/25.918.116.792.575.920/figure-spherulite-growth-rate-half-time-crystallization-pla.webp)

![Figure 2.7. TEM image of SNCs from different resources a) pea starch and b) potato starch [49]](https://thumb-eu.123doks.com/thumbv2/123doknet/4948546.122009/32.918.145.788.743.1019/figure-image-sncs-different-resources-starch-potato-starch.webp)

![Figure 2.10: Average permeability as a function of M w and kinetic diameter of different gases [91]](https://thumb-eu.123doks.com/thumbv2/123doknet/4948546.122009/40.918.190.739.593.793/figure-average-permeability-function-kinetic-diameter-different-gases.webp)