This is an author-deposited version published in:
http://oatao.univ-toulouse.fr/
Eprints ID: 4573
To link to this article: DOI:
10.1016/j.watres.2010.10.016
http://dx.doi.org/10.1016/j.watres.2010.10.016
To cite this version:
Boulêtreau, Stéphanie and Charcosset, Jean-Yves and Gamby, Jean and
Lyautey, Emilie and Mastrorillo, Sylvain and Azémar, Frédéric and Moulin,
Frédéric and Tribollet, Bernard and Garabétian, Frédéric (2011) Rotating disk
electrodes to assess river biofilm thickness and elasticity. Water Research, vol.
45 (n° 3). pp. 1347-1357. ISSN 0043-1354
O
pen
A
rchive
T
oulouse
A
rchive
O
uverte (
OATAO
)
OATAO is an open access repository that collects the work of Toulouse researchers and
makes it freely available over the web where possible.
Any correspondence concerning this service should be sent to the repository
administrator:
staff-oatao@inp-toulouse.fr
Rotating disk electrodes to assess river biofilm thickness
and elasticity
Ste´phanie Bouleˆtreau
a,b,*
, Jean-Yves Charcosset
a,b, Jean Gamby
d, Emilie Lyautey
a,b,
Sylvain Mastrorillo
a,b, Fre´de´ric Aze´mar
a,b, Fre´de´ric Moulin
c, Bernard Tribollet
d,
Fre´de´ric Garabetian
eaUniversite´ de Toulouse, UPS, INP, EcoLab (Laboratoire d’e´cologie fonctionnelle), 118 route de Narbonne, F-31062 Toulouse, France bCNRS, EcoLab, F-31062 Toulouse, France
cInstitut de Me´canique des Fluides de Toulouse, UMR 5502, Alle´e du Professeur Camille Soula, 31400 Toulouse, France dLaboratoire Interfaces et Syste`mes Electrochimiques LISE, UPR 15 du CNRS, Universite´ Pierre et Marie Curie, 4 place Jussieu,
75252 Paris cedex 05, France
eUniversite´ de Bordeaux, EPOC-OASU, UMR 5805, Station Marine d’Arcachon, 2 rue du Professeur Jolyet, 33120 Arcachon, France
Keywords: Epilithon Periphyton Biofilm architecture Biofilm deformation Voltammetry Electrochemistry
a b s t r a c t
The present study examined the relevance of an electrochemical method based on a rotating disk electrode (RDE) to assess river biofilm thickness and elasticity. An in situ colonisation experiment in the River Garonne (France) in August 2009 sought to obtain natural river biofilms exhibiting differentiated architecture. A constricted pipe providing two contrasted flow conditions (about 0.1 and 0.45 m s 1in inflow and constricted sections respectively) and containing 24 RDE was immersed in the river for 21 days. Biofilm thickness and elasticity were quantified using an electrochemical assay on 7 and 21 days old RDE-grown biofilms (t7and t21, respectively). Biofilm thickness was affected by colonisation length and flow conditions and ranged from 36 ! 15 mm (mean ! standard deviation, n ¼ 6) in the fast flow section at t7to 340 ! 140 mm (n ¼ 3) in the slow flow section at t21. Comparing the electro-chemical signal to stereomicroscopic estimates of biofilms thickness indicated that the method consistently allowed (i) to detect early biofilm colonisation in the river and (ii) to measure biofilm thickness of up to a few hundred mm. Biofilm elasticity, i.e. biofilm squeeze by hydrodynamic constraint, was significantly higher in the slow (1300 ! 480 mm rpm1/2,
n ¼ 8) than in the fast flow sections (790 ! 350 mm rpm1/2, n ¼ 11). Diatom and bacterial density, and biofilm-covered RDE surface analyses (i) confirmed that microbial accrual resulted in biofilm formation on the RDE surface, and (ii) indicated that thickness and elasticity represent useful integrative parameters of biofilm architecture that could be measured on natural river assemblages using the proposed electrochemical method.
1.
Introduction
River epilithic biofilms are complex microbial consortia of algae, bacteria and other micro- and meso-organisms that develop on
solid substrata (Lock, 1993). Embedded in a mucilage matrix of microbially generated biopolymers (EPS: extracellular polymeric
substances), these aggregates have relatively high mechanical
stability and cell density. River biofilm dynamics influences
* Corresponding author. Tel.: þ33 (0) 5 61 55 73 48; fax: þ33 (0) 5 61 55 60 96. E-mail address:stephanie.bouletreau@cict.fr(S. Bouleˆtreau).
0043-1354/$ e see front matter ª 2010 Elsevier Ltd. All rights reserved. doi:10.1016/j.watres.2010.10.016
various instream processes such as primary production (Wetzel, 1975), river food web (Feminella and Hawkins, 1995), organic matter and nutrient cycling (Paul et al., 1991; Battin et al., 2003a; Teissier et al., 2007), and accumulation of contaminants such as pesticides (Dorigo et al., 2007) and toxic metals (Cheng et al., 2008; Thuy Dong et al., 2008).
Biofilm architecture (e.g. thickness, cohesion) varies with community maturation and resistance to current velocity, both for monospecific biofilms (e.g. Mukherjee et al., 2008) or for complex river biofilms (Peterson, 1996). Architecture partly conditions biofilm functions affecting mass transfer between aggregates and bulk water, influencing for example the relative uptake of substrates differing in bioavailability (Battin et al., 2003b). In spite of its major interest, the in situ character-isation of biofilm architecture remains a challenge since tools are very scarce, inconvenient to use in the field and somewhat semiquantitative. Among architectural parameters, thickness is the most integrative and informative with respect to varia-tion in key parameters including volume, wet weight, and number of species. However river biofilm thickness is rarely measured and studies often intentionally use biomass as an indirect estimation of thickness (Dodds et al., 1999). Several destructive (scanning electron microscopy, cryoembedding) and nondestructive (light microscopy, scanner with an image acquisition system, a laser triangulation sensor, confocal laser-scanning microscopy and two-photon excitation microscopy) optical methods are available to measure biofilm thickness (Paramonova et al., 2007). They are ideal tools for biofilm monitoring at the micrometer scale spatial resolution. Investi-gations on bacterial biofilms are also oriented towards nano-scopic spatial arrangement using a combination of confocal laser-scanning microscopy and atomic force microscopy (Schmid et al., 2008). The main drawback for their application to river biofilm is the incompatibility between their observation scale and the centimetre or metre scale of biofilm development in rivers (e.g. on rock substrates such as pebbles). An optical method (Bakke and Olsson, 1986), periodically applied for river and estuarine biofilms (Sekar et al., 2002; Rao, 2003) determines biofilm thickness as the vertical sample displacement required to move the focal plane of the microscope from the water-ebiofilm interface to the biofilmesubstratum interface. It is limited in that an estimate of the refractive index of the transparent film is required and it can only be applied to biofilm thinner than 100 mm (Paramonova et al., 2007).
Herbert-Guillou et al. (1999)reported an electrochemical method based on the analysis of a tracer oxidation current on a rotating disk electrode (RDE) where biofilm has developed. This electrochemical technique was applied to detect very thin bacterial biofilms developed in sea and tap waters (Herbert-Guillou et al., 2000; Gamby et al., 2008). Beside thickness measurement,Herbert-Guillou et al. (2000)showed that the RDE method could be used to provide complementary information on biofilm functional properties relative to bio-film elasticity.
The objectives of the present study were to (i) adapt the RDE method to estimate natural phototrophic biofilm thickness and elasticity and particularly, (ii) improve the biofilm elasticity parameter calculation, (iii) assess the relevance of thickness and biofilm elasticity measurements to differentiate contrasted river phototrophic biofilms and, (iv) prove the suitability of this
method for in situ experiments. As flow rate and biofilm matu-ration are proved to influence biofilm architecture (Peterson, 1996), we designed an experimental device to produce 7-day and 21-day-old biofilms in situ while varying the flow rate.
2.
Materials and methods
2.1. Experimental design2.1.1. Biofilm production device
An experimental pipe device for biofilm production was designed and scaled to provide two contrasted current velocity conditions within the same pipe, so that all factors affecting biofilm dynamics other than flow could be considered similar. According to the volume continuity equation for an incom-pressible fluid, through a pipe constriction (from the section #1 of area A1to the section #2 of area A2), (i) the fluid velocity increases and (ii) this increase in velocity (from v1to v2) is set to the decrease in section area as follows: v2=v1¼A1=A2.
The constricted pipe consisted in three main parts: an upstream first cylinder (section #1, slow flow) followed by a converging conical inlet (angle a1) and a second downstream cylindrical throat (section #2, fast flow) (Fig. 1.). The current velocity v1was determined by the local river current velocity and followed river flow variations during the whole experiment. The current velocity v2depends on v1value and on the ratio between diameters ðF2=F1Þ. Diameter dimensions were chosen (i) to provide a quite easily handling structure, (ii) to ensure relatively homogeneous flow conditions in each section and (iii) to ensure a ratio v2=v1around 4. Inlet and throat diameters were set to 20 and 10 cm respectively. A diverging recovery part (angle a2) followed by a third cylindrical throat (section #3; diameter F3¼ F1) was added to the structure to ensure a straight exit stream. Convergence and divergence angles were chosen according to values minimising flow detachment and head loss in Venturi pipes: a1¼20&and a2¼14&. Numerous formulas are found to estimate the entrance length (le) of cylindrical ducts i.e.
the position beyond which flow is fully developed (Anselmet et al., 2009). Application of such formulas to the present flow conditions yields values of le=Febetween 20 and 30 lead to too long pipe dimensions to be handled in the river. Entry and constricted section lengths were set to 3 and 4 times the diam-eter, the total length being therefore 186 cm. At RDE locations, viscous shear stress on the cylinder (and incidentally on biofilm) is around 10 times larger in the constricted than in the entry section, ensuring relative homogeneous and contrasted local flows at RDE surfaces.
The constricted pipe was made of 3-mm thick Plexiglas! to ensure light diffusion. Pipe sections for which diameter was smaller than F1were surrounded with another 20-cm diameter Plexiglas!
pipe to form a single continuous pipe and decrease detachment of the external flow around the pipe. The additional sheath did not affect light penetration: irradiance in both sections of the pipe, as measured using a LI-COR Li100 quanta-meter at sunlight, exhibited similar values within a 10% range.
2.1.2. Experimental procedure
Twelve RDE were incorporated at each downstream extremity of both sections of the apparatus (Fig. 1). The RDE were labelled
SF (for slow flow) or FF (for fast flow) according to which section they were located. In each section, the surface of 6 RDE per pipe side (right and left) was vertically positioned at the equator line to prevent particle sedimentation during the colonisation process. The RDE were positioned next to each other to ensure homogeneous environmental conditions between replicates. They were maintained in order to arise to the pipe internal surface with nylon cable gland allowing an easy recovery.
The constricted pipe was immersed parallel to the water current at the bottom of the River Garonne at the study site of l’Aouach (01&1800000E; 43&2300800N). This site is a typical reach for biofilm development (Lyautey et al., 2005; Bouleˆtreau et al., 2006). During the low-water period (from July to October), the study river reach is characterised by a shallow (<1.5 m), wide (100 m), and unshaded bed. Water exhibits low turbidity (<30 NTU) and nutrient concentrations of about 10 mg P L 1 of soluble reactive phosphorus, 1 mg N L 1of both ammonium and nitrates, and 1.5 mg C L 1of dissolved organic carbon. The constricted pipe was maintained on the river bottom in a zone where the riverbed was flat and homogeneous (boulder rocks), shallow (water depth around 50 cm) and current velocity was slow (around 0.1 m s 1). The experiment was performed on August 2009 during a low-flow period to exploit the most stable current velocities as possible, and to enable biofilm accrual especially in the fast flow section. Data on daily mean flow were supplied by DIREN Midi-Pyre´ne´es (gauging station: Portet-sur-Garonne) and mean current velocity was measured at the pipe entry using an FLO-MATE portable flowmeter (Model 2000, Marsh-McBirney, USA).
The device was immersed for 21 days, and six RDE per section were sampled after 7 (t7) and 21 (t21) days of coloni-sation. Replicate RDE were named as follows: SF or FF when
collected in the slow flow or fast flow section followed by 7 or 21 according to the sampling time, and followed by the repli-cate number; RDE SF7#3 stands for one of the RDE sampled in the slow flow section after 7 days of colonisation. Sampled RDE were kept in river water at 4 &C in the dark during transport to the laboratory and measurements were per-formed within 5 h. At t7the 12 sampled RDE were replaced by stainless-steel cylinders of similar diameter.
2.2. Biofilm architecture measurements
2.2.1. Electrochemical measurement theory
The method consists of measuring the steady-state diffusion current on the RDE interface at a fixed potential and at a fixed rotation speed U without biofilm (t0) and after biofilm devel-opment (t7and t21). To impose this constant potential, a 3-electrode-system immersed in an electrochemical cell filled with a tracer solution and connected to a potentiostat was used: (i) RDE, the working metallic electrode on which biofilm develops; (ii) the reference electrode that controls the potential of the working electrode and (iii) the counter electrode that closes the electrical circuit and the overall current goes through. Diffusion current results in the oxidation of a reduced species at the RDEeelectrolyte interface. Without biofilm, diffusion current depends directly on the diffusion boundary layer thickness at the RDEeelectrolyte interface. With RDE rotating at a constant rotation speed around its axis, the diffusion boundary layer thickness is maintained constant. Biofilm is considered as an inert porous layer with respect to mass transport since it contains more than 95% of water (Characklis, 1990). The biofilm is also considered as a layer of stagnant water on the RDE surface, and the slow convection Fig. 1 e Photograph and schematic representation of the experimental pipe device. The position of the RDEs is indicated on the photograph by its labelling. SF: slow flow section; FF: fast flow section; 7: 7 days; 21: 21 days. Arrow shows current direction.
existing inside the biofilm is neglected. The diffusion coeffi-cient in biofilm was shown to be the same as the diffusion coefficient in water (L’Hostis et al., 1996), this property is extended for the thicker river biofilms under investigation in the present study. This layer adds to the hydrodynamic boundary layer one, inducing a decrease in diffusion current intensity.
2.2.2. Electrochemical measurement setting
The RDE was made of a 5-mm diameter platinum cylinder (electrical conductor) coated with a Teflon!
cylinder (electrical insulator). The reference electrode was a saturated calomel electrode (SCE) (REF421, Radiometer Analytical, France). The counter electrode was a cylindrical grid of platinum immersed into the electrolyte solution that surrounded the working electrode. A 0.01M potassium ferrocyanide [Fe(CN)6]2 and ferricyanide [Fe(CN)6]3 solution was used as tracer in 1M KCl. Ferrocyanide oxidation current intensity was measured at 0 V/ SCE at which no water electrolysis and no oxygen reduction occur. Measurements were performed at 20&C.
In the laboratory, the RDE was mounted on a motor axis plugged using mercury contacts and was rotated by a DC motor system. The motor speed was controlled with a servo system and measured using a tachometer. Prior to diffusion current measurements, the equilibrium potential of the ferrocynanide/ ferricyanide couple at the same concentration was measured between 0.240 and 0.236 V/SCE in accordance with the reference potential ( 0.237 V/SCE). Diffusion current was then measured at the potential 0 V/SCE for each RDE rotation speed between 100 and 1200 rpm by steps of 100 rpm. Rotation speed was limited to 1200 rpm to prevent biofilm erosion. Before t0 measurements, every RDE were polished using sandpaper (grade 1200) and cleaned with distilled water. After t7and t21 measurements, each RDE was individually conditioned into river water until further analyses.
Biofilm thickness d (mm) was calculated from diffusion current intensity measurements with ðiðtÞÞand without bio-film ðið0ÞÞ for each RDE rotation speed (U in rpm) as follows: d¼nFDC(Sh
iðtÞ 1 ið0Þ 1i)10; 000 (1)
with n is the number of electrons, F the Faraday constant (96485 C mol 1or s A mol 1), D the diffusion coefficient in both water and biofilm set to 6.8 ) 10 6cm2s 1at 20&C according to
Deslouis et al. (1980), C* the electroactive species concentra-tion in the bulk soluconcentra-tion (0.00001 mol cm 3), and S the active RDE area (0.196 cm2).
2.2.3. Image acquisition and analysis
For RDE biofilm cover estimations, stereomicroscopy (Olympus SZX10, 24) magnification) images of the bare RDE (t0) and the wet colonised RDE (t7or t21) surfaces were captured using an Olympus U-TV0.63XC camera (Olympus Corporation, Tokyo, Japan) as TIFF files (1600 by 1200 pixels) and imported in Pho-toshop CS3 (Adobe PhoPho-toshop v 10.0.1). No staining was per-formed. The image of the bare RDE surface was used as control. Binary images were generated by affecting the white color to the bare pixels and the black color to the colonised pixels. RDE biofilm cover (surface %) was determined on the platinum surface as the ratio of the surface area of black pixels to the total
surface area (sum of white and black pixels) with Image J 1.37v (Wayne Rasband, National Institutes of Health, USA).
For thickness estimation, stereomicroscopy (Leica MZ 12.5, 16) magnification) images of a side view of each colonised RDE standing in water were captured using a Leica DFC320 camera (Leica Microsystems DI Cambridge). Several focal planes cor-responding to various cross sections ((x, z)-planes in a (x, y, z) coordinate system) were visible on the picture thanks to the setting of an appropriate depth of field. The projected image of the various focal planes was converted to binary image after biofilm pixels selection. The maximal biofilm height (maximal
z-coordinate of the (y, z)-plane) on each abscissa of the image
(x-axis) was measured automatically in pixels using Image J. Conversion from pixel to mm was performed using a line scale standard. This gives the mean maximal biofilm thickness (mean zmax) of the whole colonised RDE surface ((x, y)-plane).
2.2.4. Cell numeration
After electrochemical measurements, material on the RDE surface was removed with a sterile scalpel and placed into 1 mL of filter-sterilized (0.2 mm pore-size filter) river water and preserved for storage at 4 &C with the addition of 100 mL of neutralized formaldehyde to the biofilm suspension. Biofilm suspension was sonicated in an ultrasonic bath (Elmasonic S900H, Elma, South Orange, NJ) at 37 kHz (15 min) and vortexed (15 min) according toBuesing and Gessner (2002). For bacterial counts, 500 mL aliquot of the appropriate cell suspension dilu-tion was stained with 200 mL DAPI (0.01 mg mL 1) and collected by filtration on 0.2 mm pore-size black polycarbonate filters (Nuclepore, Whatman, Maidstone, UK) according toGarabetian et al. (1999). Counts were carried out on an Olympus BH2 RLFA microscope at 1250) magnification and results were expressed as cell number per cm2. Diatom density in biofilm suspension was estimated directly (t7) or after 5-fold dilution (t21) using a Nageotte counting chamber, by counting the total number of diatoms in 30 fields (1.25 mL each, 0.5 mm depth), using light microscopy at 250) magnification (Olympus BH2 RLFA).
2.2.5. Statistical analyses
Electrochemical parameters (biofilm thickness and elasticity) were deduced by statistical adjustment using Origin 8.1 SR1 (v8.1.13 88, OriginLab Corporation, Northampton, USA). Agree-ment between simulated and measured thickness was evalu-ated by X2 and R2 application. The non-parametric ManneWhitney U-test procedure was used to test for flow effects on biofilm thickness, biofilm elasticity, RDE biofilm cover, bacterial and diatom cell numbers. Correlation between biofilm architecture parameters was explored by using the Pearson r coefficient. All values are given as average ! standard deviation (SD). Statistical analyses were performed with SPSS 15.0 soft-ware for Windows, and were considered significant at p * 0.05.
3.
Results
3.1. Determination of biofilm thickness and elasticity
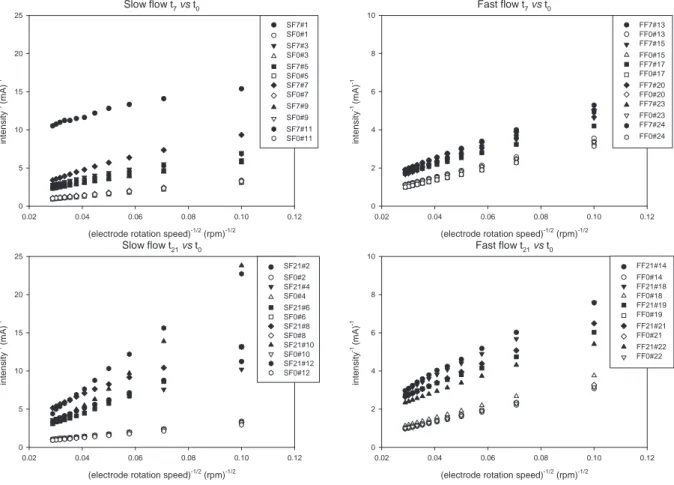
The reciprocal steady-state current intensity (mA 1) was plotted against the reciprocal square root of the RDE rotation speed (rpm 0.5) in the Koutecky-Levich coordinates in the
Fig. 2. For each EDT, before (t0) or after biofilm colonisation (t7or t21), the current increased with the RDE rotation speed according to the Levich law (Levich, 1962). For a given rotation speed, the current decreased with biofilm formation (t7vs. t0 and t21vs. t0). This decrease in the current intensity measured between t0and t7or t21was significant and allowed thickness determination using equation(1) for 22 RDE over 24. Con-necting issues were at the origin of the defects on 2 RDE (SF7#1 and FF21#16). For 22 RDE (and even the most colonised ones), minimal recorded current intensities (i.e. intensity measured at the minimal rotation speed of 100 rpm) were higher than several tens of mA suggesting that the measurement was relevant (seeAppendix). The slope is higher for 21- than for 7-day-old biofilms, and for slow than for fast flow grown biofilms (Fig. 2). Biofilm thickness measured at each RDE rotation speed (U) was represented onFig. 3. The relationship between thickness and rotation speed can be analysed by considering the following law:
d¼ 1
ðd0Þ 1þKU0:5
(2) d0 (mm) is biofilm thickness at zero RDE rotation speed and, in other words, the theoretical biofilm thickness without any particular hydrodynamic constraint. The coefficient K (mm 1rpm 1/2) relates the dependence of thickness with RDE rotation speed and was used to parametise biofilm elasticity as 1=K(mm rpm1/2).
Parameter values are resumed in theTable 1. The derivative of d vs. U may tend towards infinity when the rotation speed tends towards zero. This can result in a loss of accuracy on d0 yielding to unrealistic too large d0 for SF21#6, SF21#10 and SF21#12 parameter fits (as indicated using the infinity sign in
Table 1). Such unrealistic values led us to exclude the corre-sponding RDE results. The poor agreement between measured and simulated thicknesses at high rotation speed for these RDE is likely to suggest that the law is not applicable under high rotation speeds for thick biofilms. Nevertheless weak X2values confirmed good fit quality for 19 out of 22 RDE; the calculated d0 values are reliable and ranged from 16 mm after 7 days of colo-nisation to 500 mm after 21 days of colocolo-nisation. Electrochemi-cally measured biofilm thicknesses were significantly correlated with stereomicroscopic estimates (Table 2). Electro-chemical biofilm thickness estimates were 1.8-fold lower than stereomicroscopic estimates, ranging from 70 to 540 mm (Fig. 4).
3.2. In situ experimental settings
The RDE supporting device was designed to be immersed into the river ensuring both in situ environmental variability (algal and bacterial inoculum, light, temperature, nutrient, etc.) and two contrasted flow conditions. Flow velocity level in the pipe was controlled by natural temporal hydraulic changes in the river. Other than days 5e6e7 when the daily mean flow peaked at 99 m3, the river experienced a period of quite stable and low
t w o l f w o l S 7v ts 0 ) d e e p s n o i t a t o r e d o r t c e l e ( -1/2(rpm)-1/2 2 1 . 0 0 1 . 0 8 0 . 0 6 0 . 0 4 0 . 0 2 0 . 0 intensity -1 (m A ) -1 0 5 0 1 5 1 0 2 5 2 1 # 7 F S 1 # 0 F S 3 # 7 F S 3 # 0 F S 5 # 7 F S 5 # 0 F S 7 # 7 F S 7 # 0 F S 9 # 7 F S 9 # 0 F S 1 1 # 7 F S 1 1 # 0 F S t w o l f t s a F 7v ts 0 ) d e e p s n o i t a t o r e d o r t c e l e ( -1/2(rpm)-1/2 2 1 . 0 0 1 . 0 8 0 . 0 6 0 . 0 4 0 . 0 2 0 . 0 in te n s it y -1 (m A ) -1 0 2 4 6 8 0 1 3 1 # 7 F F 3 1 # 0 F F 5 1 # 7 F F 5 1 # 0 F F 7 1 # 7 F F 7 1 # 0 F F 0 2 # 7 F F 0 2 # 0 F F 3 2 # 7 F F 3 2 # 0 F F 4 2 # 7 F F 4 2 # 0 F F t w o l f w o l S 21v ts 0 ) d e e p s n o i t a t o r e d o r t c e l e ( -1/2(rpm)-1/2 2 1 . 0 0 1 . 0 8 0 . 0 6 0 . 0 4 0 . 0 2 0 . 0 intensity -1 (m A ) -1 0 5 0 1 5 1 0 2 5 2 2 # 1 2 F S 2 # 0 F S 4 # 1 2 F S 4 # 0 F S 6 # 1 2 F S 6 # 0 F S 8 # 1 2 F S 8 # 0 F S 0 1 # 1 2 F S 0 1 # 0 F S 2 1 # 1 2 F S 2 1 # 0 F S t w o l f t s a F 21v ts 0 ) d e e p s n o i t a t o r e d o r t c e l e ( -1/2(rpm)-1/2 2 1 . 0 0 1 . 0 8 0 . 0 6 0 . 0 4 0 . 0 2 0 . 0 intensity -1 (m A ) -1 0 2 4 6 8 0 1 4 1 # 1 2 F F 4 1 # 0 F F 8 1 # 1 2 F F 8 1 # 0 F F 9 1 # 1 2 F F 9 1 # 0 F F 1 2 # 1 2 F F 1 2 # 0 F F 2 2 # 1 2 F F 2 2 # 0 F F
Fig. 2 e Inverse current intensity evolution with the electrode rotation speed measured on electrodes after different colonisation times (0 day, t0: closed symbols; 7 days, t7and 21 days, t21: open symbols) in two flow sections (slow flow, SF and fast flow, FF) with the ferro-/ferricyanide tracer. Each symbol corresponds to one RDE.
flow (64 ! 10 m3s 1) during the experiment, favouring biofilm development (data not shown). While measurement on day 7 highlighted the above mentioned 3-day period of hydraulic disturbance, other discrete measurements on days 0 and 21 in the slow flow section (i.e. inlet of the pipe) showed quite similar flow velocity values around 0.11 m s 1 that correspond to a theoretical Reynolds number of 23,000 (Table 3). According to the device dimensions, flow velocity and Reynolds number in the fast flow section can be calculated from the former data to be around 0.46 m s 1and 46,000, respectively.
3.3. Biofilm features
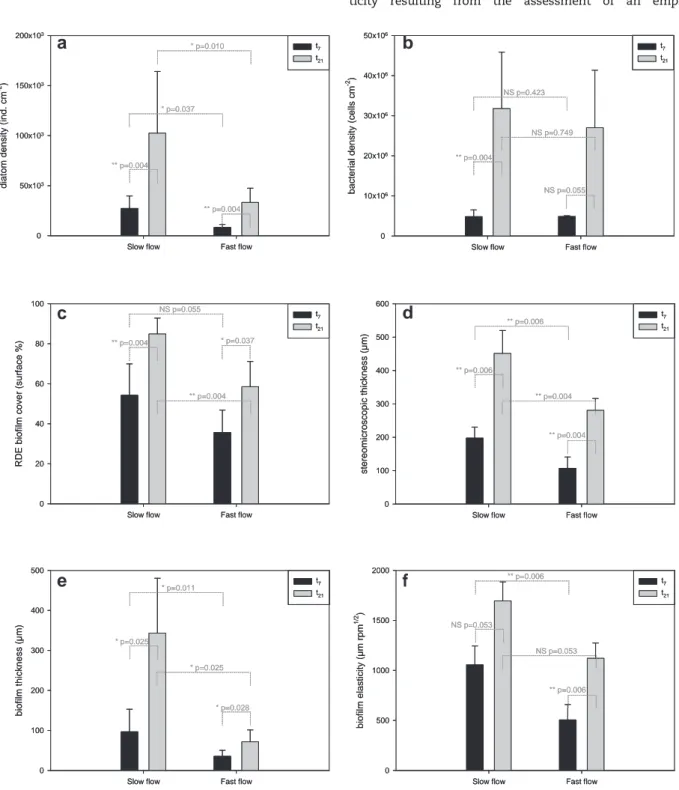
Diatom accrual contributed to biofilm formation on the RDE. Diatom density increased during colonisation with 27 ) 103and 102 ) 103individuals per cm2in the slow flow section and with 8 ) 103and 33 ) 103individuals per cm2in the fast flow section on average at t7 and t21 respectively (Fig. 5a). Consistently bacterial densities increased during colonisation reaching 32 ) 106and 27 ) 106cells per cm2on average at t
21in the slow and fast flow sections, respectively (Fig. 5b.). Comparing the two sections, diatoms densities were significantly different, whereas bacterial densities were not. As expected, RDE biofilm cover significantly increased between t7 and t21 from 36 to
59% on average in the slow flow section and from 54 to 85% on average in the fast flow section (Fig. 5c.). Stereomicroscopic thickness significantly increased between t7and t21and signif-icantly decreased from the slow to the fast flow section (Fig. 5d). Biofilm thickness significantly increased with time, means ranging from 100 to 340 mm in slow flow and from 36 to 72 mm in fast flow (Fig. 5e). Biofilm thickness was signifi-cantly affected by flow conditions at both sampling times.
Significant (or quasi significant) changes in biofilm elas-ticity values ð1=KÞ occurred between t7and t21and between flow conditions (Fig. 5f.). Mean ð1=KÞ values were significantly higher in the slow (1300 mm rpm1/2) than in the fast flow section (790 mm rpm1/2) (ManneWhitney U-test, p ¼ 0.032).
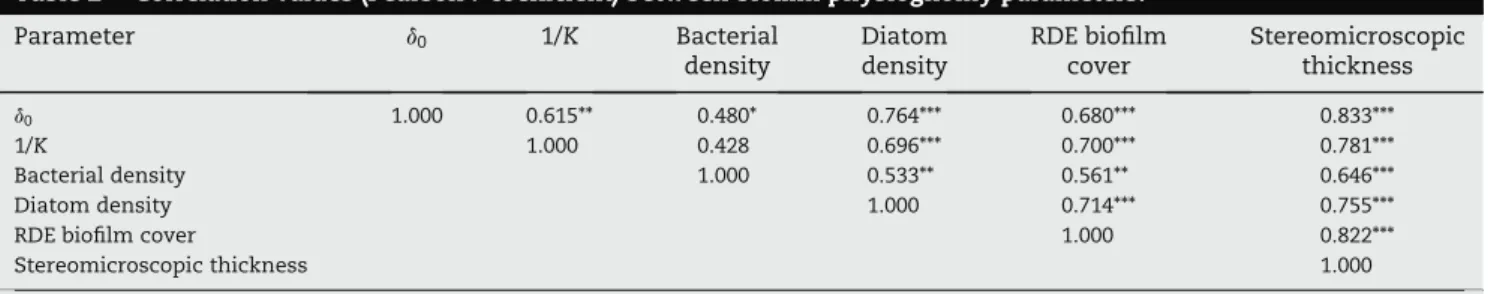
Electrochemical thickness measurements were significantly correlated with RDE biofilm cover, diatom and bacterial densi-ties (Table 2). In addition, significant correlation was also observed between biofilm elasticity and other parameters except bacterial density.
4.
Discussion
Ecologists agree to consider thickness increase as the driving force of biofilm structural and functional properties (Sabater
t w o l f w o l S 7 ) m p r ( d e e p s n o i t a t o r e d o r t c e l e 0 0 2 1 0 0 0 1 0 0 8 0 0 6 0 0 4 0 0 2 0 th ic kness (µ m) 0 0 2 0 4 0 6 0 8 0 0 1 3 # 7 F S 5 # 7 F S 7 # 7 F S 9 # 7 F S 1 1 # 7 F S t w o l f t s a F 7 d e e p s n o i t a t o r e d o r t c e l e (rpm) 0 0 2 1 0 0 0 1 0 0 8 0 0 6 0 0 4 0 0 2 0 th ic k n e s s ( µ m ) 0 0 1 0 2 0 3 0 4 0 5 3 1 # 7 F F 5 1 # 7 F F 7 1 # 7 F F 0 2 # 7 F F 3 2 # 7 F F 4 2 # 7 F F t w o l f w o l S 21 ) m p r ( d e e p s n o i t a t o r e d o r t c e l e 0 0 2 1 0 0 0 1 0 0 8 0 0 6 0 0 4 0 0 2 0 th ic kness (µ m) 0 0 0 1 0 0 2 0 0 3 0 0 4 2 # 1 2 F S 4 # 1 2 F S 6 # 1 2 F S 8 # 1 2 F S 0 1 # 1 2 F S 2 1 # 1 2 F S t w o l f t s a F 21 ) m p r ( d e e p s n o i t a t o r e d o r t c e l e 0 0 2 1 0 0 0 1 0 0 8 0 0 6 0 0 4 0 0 2 0 th ic kness (µ m) 0 0 2 0 4 0 6 0 8 0 0 1 4 1 # 1 2 F F 8 1 # 1 2 F F 9 1 # 1 2 F F 1 2 # 1 2 F F 2 2 # 1 2 F F
Fig. 3 e Thickness evolution with the electrode rotation speed measured on electrodes after two colonisation times (7 days, closed symbols and 21 days, open symbols) in two flow conditions (slow flow, SF and fast flow, FF) with the ferrocyanide tracer. Each symbol corresponds to one RDE.
and Admiraal, 2005), but, studies on river biofilms suffer from a lack of available tools to characterise biofilm architecture. The present study intended to assess the ability of an elec-trochemical method based on rotating disk electrode to measure and evaluate two features of biofilm architecture: thickness and elasticity.
Previously, the electrochemical method measured only very thin bacterial biofilms, between 0.9 and 3.5-mm thick in tap water (Gamby et al., 2008), and up to 10-mm thick in seawater (Herbert-Guillou et al., 1999). The use of 1 M KCl in the electro-chemical assay could be expected to cause thickness underes-timation due to EPS constriction (Frank and Belfort, 1997).
However, in their previous experiments, electrochemical esti-mates of biofilm thickness were validated by means of confocal laser-scanning microscopy (L’Hostis, 1996). In the present study, stereomicroscopy was used since the whole colonised RDE surface can be examined, and microbial counts can then further be done on fresh material since it does not require any previous processing such as staining, cryoembedding or cryosectioning. Stereomicroscopic measurements cannot provide absolute thickness values, but gave the upper limit of biofilm thickness range for each RDE. Nevertheless, the agree-ment between electrochemical measureagree-ments and stereomi-croscopic estimates of biofilm thickness, 2-fold higher than the electrochemical one, confirmed the relevance of the electro-chemical approach to usefully measure thicknesses ranging from a few mm to several hundreds of mm. The electrochemical method is suitable for studying biofilms containing not only prokaryotic but also eukaryotic microorganisms such as microphytobenthic algae, and particularly diatoms. Stacking of diatom cells, typically several 10 mm in size, would give a biofilm cluster of hundreds of mm in thicknesses. Our measurements are thus consistent with the expected thicknesses for such biofilms.
The second parameter measurable by electrochemistry is biofilm elasticity. Initially Herbert-Guillou et al. (2000)found direct variation of bacterial biofilm thickness with electrode
Table 2 e Correlation values (Pearson r coefficient) between biofilm physiognomy parameters.
Parameter d0 1/K Bacterial density Diatom density RDE biofilm cover Stereomicroscopic thickness d0 1.000 0.615** 0.480* 0.764*** 0.680*** 0.833*** 1/K 1.000 0.428 0.696*** 0.700*** 0.781*** Bacterial density 1.000 0.533** 0.561** 0.646*** Diatom density 1.000 0.714*** 0.755*** RDE biofilm cover 1.000 0.822*** Stereomicroscopic thickness 1.000 Stars indicate the significance level (*p * 0.05; **p * 0.01; ***p * 0.001).
Table 1 e Results of parameter fits (minimisation Chi-square): parameter values (average ± square deviation) and fit quality (c2/degree of freedom; R2) for each RDE.
d0(mm) K (mm 1rpm 1/2) c2 dof R 2 Slow flow t7 SF7#3 87 ! 2 0.00084 ! 0.00001 0.13 0.9978 SF7#5 65 ! 1 0.00116 ! 0.00001 0.04 0.9987 SF7#7 193 ! 13 0.00076 ! 0.00002 1.52 0.9926 SF7#9 49 ! 1 0.00103 ! 0.00001 0.03 0.9986 SF7#11 90 ! 1 0.00106 ! 0.00001 0.04 0.9993 Fast flow t7 FF7#13 44 ! 1 0.00222 ! 0.00002 0.01 0.9995 FF7#15 30 ! 1 0.00241 ! 0.00003 0.02 0.9978 FF7#17 16 ! 0 0.00124 ! 0.00002 0.00 0.9970 FF7#20 39 ! 0 0.00203 ! 0.00001 0.01 0.9995 FF7#23 27 ! 0 0.00205 ! 0.00003 0.02 0.9973 FF7#24 58 ! 1 0.00260 ! 0.00002 0.02 0.9991 Slow flow t21 SF21#2 501 ! 108 0.00077 ! 0.00003 5.81 0.9869 SF21#4 252 ! 18 0.00071 ! 0.00002 1.70 0.9939 SF21#6 þNa 0.00090 ! 0.00004 58 0.9328 SF21#8 277 ! 13 0.00042 ! 0.00001 1.43 0.9971 SF21#10 þNa 0.00053 ! 0.00018 1222 0.7460 SF21#12 þNa 0.00044 ! 0.00002 265 0.9304 Fast flow t21 FF21#14 114 ! 3 0.00084 ! 0.00001 0.26 0.9973 FF21#18 86 ! 4 0.00094 ! 0.00003 0.78 0.9861 FF21#19 48 ! 2 0.00076 ! 0.00003 0.40 0.9780 FF21#21 69 ! 1 0.00097 ! 0.00001 0.09 0.9976 FF21#22 40 ! 1 0.00099 ! 0.00002 0.07 0.9949 a þN Indicates an unrealistic too large thickness value.
Fig. 4 e Relationship between electrochemical and stereomicroscopic measurements of biofilm thickness.
speed rotation, depending on biofilm development conditions. Therefore, they calculated biofilm deformation as the differ-ence between electrochemical thickness at 100 rpm and thickness at a given rotation speed, and represented this latter as a function of electrode rotation speed. This simple rela-tionship was not observed in the present study, probably because the studied biofilms contained algae and inorganic particles. Adapted from Foret (2006) that demonstrated the dependence of electrochemical thickness with kU 0:5in water circuit biofilms, an original parameterisation of biofilm elas-ticity resulting from the assessment of an empirical
Table 3 e Theoretical hydraulic characteristics in the slow and fast flow sections at t0(first day), t7(7 colonisation days) and t21(21 colonisation days) estimated from measurements at the inlet of the pipe and pipe dimensions. Parameter t0 t7 t21 Slow flow v (m s 1) 0.11 0.30 0.12 Re 22,000 60,000 24,000 Fast flow v (m s 1) 0.44 1.20 0.48 Re 44,000 120,000 48,000
Slow flow Fast flow
b a c te ri a l d e n s it y ( c e lls c m -2) 0 10x106 20x106 30x106 40x106 50x106 t7 t21 ** p=0.004 NS p=0.055 NS p=0.423 NS p=0.749
Slow flow Fast flow
b a c te ri a l d e n s it y ( c e lls c m -2) 0 10x106 20x106 30x106 40x106 50x106 t7 t21 ** p=0.004 NS p=0.055 NS p=0.423 NS p=0.749
Slow flow Fast flow
s te re o m ic ro s c o p ic t h ic k n e s s ( µ m ) 0 100 200 300 400 500 600 t7 t21 ** p=0.006 ** p=0.004 ** p=0.006 ** p=0.004
Slow flow Fast flow
s te re o m ic ro s c o p ic t h ic k n e s s ( µ m ) 0 100 200 300 400 500 600 t7 t21 ** p=0.006 ** p=0.004 ** p=0.006 ** p=0.004
Slow flow Fast flow
b io fi lm e la s ti c it y ( µ m r p m 1 /2) 0 500 1000 1500 2000 t7 t21 NS p=0.053 ** p=0.006 ** p=0.006 NS p=0.053
Slow flow Fast flow
b io fi lm e la s ti c it y ( µ m r p m 1 /2) 0 500 1000 1500 2000 t7 t21 NS p=0.053 ** p=0.006 ** p=0.006 NS p=0.053
Slow flow Fast flow
b io fi lm t h ic k n e s s ( µ m ) 0 100 200 300 400 500 t7 t21 * p=0.025 * p=0.028 * p=0.011 * p=0.025
Slow flow Fast flow
b io fi lm t h ic k n e s s ( µ m ) 0 100 200 300 400 500 t7 t21 * p=0.025 * p=0.028 * p=0.011 * p=0.025
Slow flow Fast flow
R D E b io fi lm c o v e r (s u rf a c e % ) 0 20 40 60 80 100 t7 t21 ** p=0.004 * p=0.037 NS p=0.055 ** p=0.004
Slow flow Fast flow
R D E b io fi lm c o v e r (s u rf a c e % ) 0 20 40 60 80 100 t7 t21 ** p=0.004 * p=0.037 NS p=0.055 ** p=0.004
b
f
e
c
Slow flow Fast flow
dia to m density (ind. cm -2) 0 50x103 100x103 150x103 200x103 t7 t21 ** p=0.004 ** p=0.004 * p=0.037 * p=0.010
Slow flow Fast flow
dia to m density (ind. cm -2) 0 50x103 100x103 150x103 200x103 t7 t21 ** p=0.004 ** p=0.004 * p=0.037 * p=0.010
a
d
Fig. 5 e Effects of flow conditions (slow flow vs. fast flow) and colonisation time (t7, black vertical bar vs. t21, grey vertical bar) on diatom density (a), bacterial density (b), biofilm (electrochemical) thickness (c), elasticity (d), biofilm cover (e), and stereomicroscopic thickness (f).
relationship between biofilm thickness and RDE rotation speed U 0:5was proposed here. Resulting elasticity values, displaying a wide range of magnitude from about 400 to 2400 mm rpm1/2, express the magnitude of biofilm thickness variation due to increasing rotation speed and quantify the extent to which biofilm can be reduced by hydrodynamics constraint. The values cannot be compared to existing data, however.
The in situ experiment was designed to compare core bio-logical parameters to electrochemical parameters on natural river biofilms. As time is one of the main drivers of biofilm structuring, biofilms were sampled at two stages of biofilm accrual pattern, colonisation and maturation. Successional changes driven by changes in benthic microalgal species strategies result in temporal changes in biofilm structure (McCormick and Stevenson, 1991; Biggs et al., 1998; Wellnitz and Brader, 2003). Successional processes were also reported for river biofilm bacterial communities (Jackson et al., 2001; Lyautey et al., 2005; Lear et al., 2008). In the studied section of the River Garonne, biofilm bacterial richness proved to increase from 0 to 7 days, and decrease from 7 to 21 days (Lyautey et al., 2005), justifying the selected sampling times. The biofilm support material is known to influence biofilm community composition (Cattaneo and Amireault, 1992) and biofilms col-onising RDE platinum may have exhibited distinctive taxo-nomic assemblages as compared to biofilms colonising river pebbles. An in-depth comparison of biofilm structure, biomass and composition between platinum and natural substrata is still to be performed, since no data on assemblage composition was recorded in the present study. Abundances of bacteria and diatoms were monitored, showing evidence of a microbial accrual on immersed RDE surfaces. Recovered densities were comparable to those previously observed in the River Garonne biofilms for diatoms, namely 105
e107individuals per cm2(Eulin,
1997) and bacteria, about 107
e108cell per cm2(Lyautey et al.,
2010). Temporal evolution of microbial densities of RDE bio-films fitted with measured thickness enhancement. Interest-ingly, RDE biofilm cover increased with microbial densities and thickness suggesting that phototrophic river biofilms extend both horizontally and vertically in accordance with the typical model of biofilm development from isolated column forming clusters to connected mushrooms (Costerton et al., 1987). The proposed electrochemical assay was recommended to detect and survey fouling of man-made devices in marine and drinking waters (Herbert-Guillou et al., 1999; Gamby et al., 2008). It could also be used to evaluate the early dynamics of river biofilm e.g. the kinetics in the very early stage of colonisation in time course experiments or the patchiness of early accrual zones in microscale experiments.
Another main driver of biofilm structuring is flow. The RDE supporting device was imagined on the pattern of one Venturi pipe immersed into the river ensuring both in situ environ-mental variability (algal and bacterial inoculum, light, temperature, nutrient, etc.) and two contrasted flow condi-tions. As intended, generated current velocities, 0.11 and 0.46 m s 1, were in the velocity range that favours such biofilm development (Horner and Welch, 1981). Despite disturbed hydraulic conditions for a 3-day period, stable and low daily mean flows occurred during most of the experiment espe-cially during the whole maturation period. During stable and low-flow periods, typical Reynolds numbers (23,000 and
46,000) discriminated between optimal (Re near 22,000) and suboptimal biofilm growth conditions (Re > 40,000;Godillot et al., 2001). Consistently, higher diatom densities and bio-film thicknesses were found in the optimal flow section as compared to the other section. To our knowledge, only one study has quantified the effect of hydrodynamics on the thickness of stream microbial biofilms (Battin et al., 2003b): thicknesses deduced from confocal laser-scanning micros-copy images of cryosections of biofilm were significantly higher for biofilms cultivated on ceramic coupons in the slow flow condition (0.065 m s 1; Re ¼ 1869) than in the fast flow condition (0.23 m s 1; Re ¼ 7559). The relationship between biofilm thickness and Reynolds number in the former and in the present study were consistent withGodillot et al. (2001)
showing a maximum biofilm biomass for Re about 22,000. As for biofilm elasticity in the present study, biofilms produced in the slow flow section exhibited higher elasticity values than biofilms produced in the fast flow section. Most of the microorganisms that formed river biofilm biovolume are fitted with cellular structures maintaining cellular shape (e.g. bacterial cell walls, and diatom siliceous frustules). Biofilm elasticity most probably resulted rather from intercellular space reduction than from cell size constriction. Indeed, bio-film elasticity as defined in the present study might thus refer to voids (pores and channels) within biofilm and/or the looseness of cell adhesion in biofilm. Biofilm elasticity could thus fit with the sinuosity index ofBattin et al. (2003b). The multiplication of pores or voids within biofilm contributes to enlarge biofilm surface area within biofilm and therefore facilitates biofilm e water interactions and advective solute transport (De Beer et al., 1996). Such mechanical property is well studied in biofilm models used to design and evaluate performance of biofilm reactors (e.g.Picioreanu et al., 1998). Biofilm elasticity as defined in the present study could be considered as an integrative parameter of biofilmewater interaction ability, in analogy with biofilm surface enlarge-ment in studies of bacterial biofilms of industrial environ-ments. For example, the reduction of biofilmewater interactions forming a barrier for advective solute transport could be an adaptative response of biofilm submitted to chemical stress. Indeed communities exposed to cadmium were primarily dominated by short stalked and ad-pressed diatom species whereas control communities were domi-nated by filamentous diatom species (Feurtet-Mazel et al., 2003). River biofilm architecture was also affected by chronic copper exposure through the growth of the chain-forming diatom Melosira varians changing from long filaments to short tufts (Barranguet et al., 2002). Such a qualitative observation might be quantified by measuring biofilm elasticity using the proposed electrochemical method. Further studies, address-ing the relationship between biofilm architecture and the proposed measure of elasticity, might then allow to test whether biofilm physiognomic properties would reflect bio-film fitness at the community scale.
5.
Conclusion
The present study showed the suitability of an electro-chemical method based on rotating disk electrode to assess
river biofilm thickness up to 500 mm thick. Results extended the application domain of the method previously developed for tap water and seawater biofilms to complex biofilms mainly constructed by algae. The method reliably detected very thin biofilms, as well as measuring biofilm thickness of several hundred-mm. By analysing thickness evolution vs. electrode rotation speed, the electrochemical method can be used to calculate biofilm elasticity as an estimate of the extent to which biofilm is reduced by hydrodynamic constraint. This trait of biofilm architecture would relate to biofilmewater interactions. Very few studies have been conducted on the physical properties of river biofilms, due in part to technical difficulties associated with such complex biofilms. The elec-trochemical method developed here combined rotating disk electrodes which can be immersed directly in the river, and an electrochemical assay requiring only a few minutes. This nondestructive method is compatible with further analyses on the same sample e.g. bacterial or algal counts, pigment, or DNA extraction and analysis. Expanding the toolbox of biofilm characterisation techniques, the rotating disk electrode elec-trochemical method can be used to provide novel information on river biofilm architecture.
Acknowledgments
This work stems from the project SurF “Surveillance des rivie`res par
les biofilms” funded by CNRS PNIR “Biofilms”, Re´gion
Pyr-e´ne´es and Re´gion Aquitaine (action interre´gionale Aquitaine &
Midi-Pyre´ne´es). The authors are grateful to H. Bouillard and C. Portier
(EPOC e Station Marine d’Arcachon) for pipe manufacturing, to F. Moyse and F. Santoul for field assistance and to E. Salvo for diatom counts. The authors wish to thank Dr. E. Topp for cor-recting English in the ms.
Appendix. Supplementary data
Supplementary data related to this article can be found online atdoi:10.1016/j.watres.2010.10.016.
r e f e r e n c e s
Anselmet, F., Ternat, F., Amielh, M., Boiron, O., Boyer, P., Pietru, L., 2009. Axial development of the mean flow in the entrance region of turbulent pipe and duct flows. Comptes Rendus Me´canique 337, 573e584.
Bakke, R., Olsson, P.Q., 1986. Biofilm thickness measurements by light microscopy. Journal of Microbial Methods 5, 93e98. Barranguet, C., Plans, M., van der Grinten, E., Sinke, J.J.,
Admiraal, W., 2002. Development of photosynthetic biofilms affected by dissolved and sorbed copper in a eutrophic river. Environmental Toxicology and Chemistry 21 (9), 1955e1965. Battin, T.J., Kaplan, L.A., Newbold, J.D., Hansen, C.M.E., 2003a.
Contributions of microbial biofilms to ecosystem processes in stream ecosystems. Nature 426, 439e442.
Battin, T.J., Kaplan, L.A., Newbold, J.D., Cheng, X., Hansen, C.M.E., 2003b. Effects of current velocity on the nascent architecture of stream microbial biofilms. Applied and Environmental Microbiology 69 (9), 5443e5452.
Biggs, B.J.F., Goring, D.G., Nikora, V.I., 1998. Subsidy and stress responses of stream periphyton to gradients in water velocity as a function of community growth form. Journal of Phycology 34, 598e607.
Bouleˆtreau, S., Garabe´tian, F., Sauvage, S., Sanchez-Perez, J.-M., 2006. Assessing the importance of a self-generated
detachment process in river biofilm models. Freshwater Biology 51, 901e912.
Buesing, N., Gessner, M.O., 2002. Comparison of detachment procedures for direct counts of bacteria associated with sediment particles, plant litter and epiphytic biofilms. Aquatic Microbial Ecology 27, 29e36.
Cattaneo, A., Amireault, M.C., 1992. How artificial are artificial subtrata for periphyton? Journal of the North American Benthological Society 11 (2), 244e256.
Characklis, W.G., 1990. In: Characklis, W., Marshall, K.C. (Eds.), Biofilms. Wiley, New York.
Cheng, J., Zhao, W., Liu, Y., Wu, C., Liu, C., Wang, W., 2008. Adsorption properties and gaseous mercury transformation rate of natural biofilm. Bulletin of Environmental
Contamination and Toxicology 81, 516e520.
Costerton, J.W., Cheng, K.-J., Geesey, G.G., Ladd, T.I., Nickel, J.C., Dasgupta, M., Marrie, T.J., 1987. Bacterial biofilms in nature and disease. Annual Review of Microbiology 41, 435e464. De Beer, D., Stoodley, P., Lewandowski, Z., 1996. Liquid flow and
mass transport in heterogeneous biofilms. Water Research 30 (11), 2761e2765.
Deslouis, C., Tribollet, B., Viet, L., 1980. Local and overall mass transfer rates to a rotating disk in turbulent and transition flows. Electrochemica Acta 25, 1027e1032.
Dodds, W.K., Biggs, B.J.F., Lowe, R.L., 1999. Photosynthesis-irradiance patterns in benthic microalgae: variations as a function of assemblage thickness and community structure. Journal of Phycology 35, 42e53.
Dorigo, U., Leboulanger, C., Berard, A., Bouchez, A., Humbert, J.-F., Montuelle, B., 2007. Lotic biofilm community structure and pesticide tolerance along a contamination gradient in a vineyard area. Aquatic Microbial Ecology 50 (1), 91e102. Eulin, A., 1997. Les communaute´s de diatome´es e´pilithiques de la
Garonne, phD. Universite´ Paul Sabatier, Toulouse, p. 248. Feminella, J.W., Hawkins, C.P., 1995. Interactions between stream
herbivores and periphyton: a quantitative analysis of past experiments. Journal of the North American Benthological Society 14 (4), 465e509.
Feurtet-Mazel, A., Gold, C., Coste, M., Boudou, A., 2003. Study of periphytic diatoms communities exposed to metallic contamination through complementary field and laboratory experiments. Journal de Physique IV 107, 467e470.
Foret, C., 2006. Maintien de la qualite´ des eaux dans les re´seaux par des proce´de´s innovants de traitement et de de´tection des biofilms. PhD, Universite´ de Poitiers, p. 254.
Frank, B.P., Belfort, G., 1997. Intermolecular forces between extracellular polysaccharides measured using the atomic force microscope. Langmuir 13, 6234e6240.
Gamby, J., Pailleret, A., Boucher Clodic, C., Pradier, M.C., Tribollet, B., 2008. In situ detection and characterization of potable water biofilms on materials by microscopic, spectroscopic and electrochemistry methods. Electrochimica Acta 54, 66e73. Garabetian, F., Petit, M., Lavandier, P., 1999. Does storage affect
epifluorescence microscopic counts of total bacterial in freshwater samples? Comptes Rendus de l’Acade´mie des Sciences se´ries III. Sciences de la Vie 322, 779e784. Godillot, R., Caussade, B., Ame´ziane, T., Capblancq, J., 2001.
Interplay between turbulence and periphyton in rough open-channel flow. Journal of Hydraulic Research 39 (3), 227e239. Herbert-Guillou, D., Tribollet, B., Festy, D., Kie´ne´, L., 1999. In situ
detection and characterization of biofilm in waters by electrochemical methods. Electrochemica Acta 45, 1067e1075.
Herbert-Guillou, D., Tribollet, B., Festy, D., 2000. Influence of the hydrodynamics on the biofilm formation by mass transport analysis. Bioelectrochemistry 53, 119e125.
Horner, R.R., Welch, E.B., 1981. Stream periphyton development in relation to current velocity and nutrients. Canadian Journal of Fisheries and Aquatic Sciences 38, 449e457.
Jackson, C.R., Churchill, P.F., Roden, E., 2001. Successional changes in bacterial assemblage structure during epilithic biofilm development. Ecology 82 (2), 555e566.
Lear, G., Anderson, M.J., Smith, J.P., Boxen, K., Lewis, G.D., 2008. Spatial and temporal heterogeneity of the bacterial
communities in stream epilithic biofilms. FEMS Microbial Ecology 65, 463e473.
Levich, V.G., 1962. Physicochemical Hydrodynamics. Prentice-Hall Scripta Technica, Englewood Cliffs, New Jersey. L’Hostis, E., 1996. De´tection et caracte´risation de biofilms par
me´thodes e´lectrochimiques. phD, Universite´ Pierre et Marie Curie, Paris 6, p. 226.
L’Hostis, E., Compe`re, C., Festy, D., Tribollet, B., Deslouis, C., 1996. Characterization of biofilms on gold in natural seawater by oxygen diffusion analysis. Corrosion 43, 4e10.
Lock, M.A., 1993. In: Ford, T.E. (Ed.), Aquatic Microbiology e an Ecological Approach. Blackwell Scientific Publications, Oxford, United Kingdom, pp. 113e138.
Lyautey, E., Jackson, C.R., Cayrou, J., Rols, J.-L., Garabe´tian, F., 2005. Bacterial community succession in natural river biofilm assemblages. Microbial Ecology 50, 589e601.
Lyautey, E., Bouleˆtreau, S., Madigou, E.Y., Garabetian, F., 2010. Viability of differentiated epilithic bacterial communities in the River Garonne (SW France). Hydrobiologia 637, 207e218. McCormick, P.V., Stevenson, R.J., 1991. Mechanisms of benthic
algal succession in lotic environments. Ecology 5, 1835e1848. Mukherjee, P.K., Chand, D.V., Chandra, J., Anderson, J.M.,
Ghannoum, M.A., 2008. Shear stress modulated the thickness and architecture of Candida albicans biofilms in a phase-dependant manner. Mycoses 52, 440e446.
Paramonova, E., de Jong, E.D., Krom, B.P., van der Mei, H.C., Busscher, H.J., Sharma, P.K., 2007. Low-load compression
testing: a novel way of measuring biofilm thickness. Applied and Environmental Microbiology 73 (21), 7023e7028. Paul, B.J., Duthie, H.C., Taylor, W.D., 1991. Nutrient cycling by
biofilms in running waters of different nutrient status. Journal of the North American Benthological Society 10, 31e41. Peterson, C.G., 1996. In: Stevenson, R.J., Bothwell, M.L., Lowe, R.L.
(Eds.), Algal Ecology: Freshwater Benthic Ecosystems. Academic Press, San Diego, pp. 375e403.
Picioreanu, C., van Loosdrecht, M.C.M., Heijnen, J.J., 1998. Mathematical modeling of biofilm structure with a hybrid differential-discrete cellular automaton approach. Biotechnology and Bioengineering 58, 101e116.
Rao, T.S., 2003. Temporal variations in an estuarine biofilm: with emphasis on nitrate reduction. Estuarine and Coastal Shelf Science 58, 67e75.
Sabater, S., Admiraal, W., 2005. In: Azim, M.E. (Ed.), Periphyton: Ecology, Exploitation and Management, pp. 159e177. Schmid, T., Burkhard, J., Yeo, B.-S., Zhang, W., Zenobi, R., 2008.
Towards chemical analysis of nanostructures in biofilms I: imaging of biological nanostructures. Analytical and Bioanalytical Chemistry 391, 1899e1905.
Sekar, R., Nair, K.V.K., Rao, V.N.R., Venugopalan, V.P., 2002. Nutrient dynamics and successional changes in a lentic freshwater biofilm. Freshwater Biology 47, 1893e1907. Teissier, S., Torre, M., Delmas, F., Garabe´tian, F., 2007. Detailing
biogeochemical N budgets in riverine epilithic biofilms. Journal of the North American Benthological Society 26 (2), 178e190. Thuy Dong, T., Morin, S., Herlory, O., Feurtet-Mazel, A., Coste, M.,
Boudou, A., 2008. Seasonal effects of cadmium accumulation in periphytic diatom communities of freshwater biofilms. Aquatic Toxicology 90, 19e28.
Wellnitz, T., Brader, R.B., 2003. Mechanisms influencing community composition and succession in mountain stream periphyton: interactions between scouring history, grazing, and irradiance. Journal of the North American Benthological Society 22 (4), 528e541.
Wetzel, R.G., 1975. In: Whitton, B.A. (Ed.), River Ecology. Blackwell Sci. Publ., Oxford.