HAL Id: tel-01969371
https://tel.archives-ouvertes.fr/tel-01969371v2
Submitted on 5 Dec 2019
HAL is a multi-disciplinary open access archive for the deposit and dissemination of sci-entific research documents, whether they are pub-lished or not. The documents may come from teaching and research institutions in France or abroad, or from public or private research centers.
L’archive ouverte pluridisciplinaire HAL, est destinée au dépôt et à la diffusion de documents scientifiques de niveau recherche, publiés ou non, émanant des établissements d’enseignement et de recherche français ou étrangers, des laboratoires publics ou privés.
Disorders based on OpenSim
Jing Chang
To cite this version:
Jing Chang. The Risk Assessment of Work-related Musculoskeletal Disorders based on OpenSim. Automatic. École centrale de Nantes, 2018. English. �NNT : 2018ECDN0042�. �tel-01969371v2�
T
HESE DE DOCTORAT DE
L'ÉCOLE
CENTRALE
DE
NANTES
COMUE UNIVERSITE BRETAGNE LOIRE
ECOLE DOCTORALE N°602
Sciences pour l'Ingénieur
Spécialité : « Robotique - Mécanique »
« Evaluation des risques de troubles musculo-squelettiques liés au
travail basée sur OpenSim »
Thèse présentée et soutenue à l’Ecole Centrale de Nantes, le 30 novembre2018 Unité de recherche : Laboratoire des Sciences du Numérique de Nantes
Par
Jing CHANG
Rapporteurs avant soutenance :
Georges DUMONT
Gérard POISSON Professeur, Ecole Normale Supérieure de Rennes Professeur, Université d’Orléans, IUT de Bourges
Composition du Jury :
Président : Laurence CHEZE
Examinateurs : Liang MA Professeur, Université Claude Bernard Lyon 1 Associate Professor, Tsinghua University Dir. de thèse : Fouad BENNIS Professeur, Ecole Centrale de Nantes
II.4.2 Joint moment measurement· · · ·30
II.4.3 Muscle force assessment· · · ·32
II.4.4 Summary · · · ·38
II.5 Fatigue: the accumulation effect of workloads
· · · ·
38II.5.1 Physical fatigue: central and peripheral· · · ·38
II.5.2 Determination of muscle fatigue · · · ·39
II.5.3 Biomechanical modeling of muscle fatigue· · · ·42
II.6 Muscle fatigability
· · · ·
46II.6.1 Definition of muscle fatigability · · · ·46
II.6.2 Measurement of muscle fatigability· · · ·47
II.7 Ditigal human modeling in MSDs physical risk assessment
· · · ·
49II.7.1 The development of digital human modeling · · · ·49
II.7.2 Digital human modeling in Ergonomics · · · ·52
II.7.3 Biomechanical digital human modeling · · · ·54
II.7.4 OpenSim · · · ·55
II.8 General summary
· · · ·
58III The Indication of Muscle Fatigue with Surface EMG
61
III.1 Abstract· · · ·
61III.2 Introduction
· · · ·
62III.3 Methods
· · · ·
64III.3.1 Subjects· · · ·64
III.3.2 Experiment protocol· · · ·64
III.3.3 Experiment setups· · · ·65
III.3.4 Data collection · · · ·65
III.3.5 Data analysis · · · ·66
III.4 Results
· · · ·
67III.4.1 Simple contraction session · · · ·67
III.4.2 Fatigue sessions · · · ·67
III.4.3 RMS response exclusively to fatigue· · · ·68
III.5 Discussions
· · · ·
68III.5.1 Force-RMS relationship in simple contraction · · · ·68
III.5.2 RMS during Fatigue Process · · · ·69
III.5.3 EMG response exclusively to fatigue · · · ·70
iii
IV Muscle Fatigue Analysis in OpenSim
73
IV.1 Introduction
· · · ·
73IV.1.1 Objectives · · · ·73
IV.2 Methodology: OpenSim human modeling and muscle fatigue analysis 74 IV.2.1 Muscle fatigue analysis· · · ·74
IV.3 Data and Simulation
· · · ·
75IV.4 Results of simulation
· · · ·
76IV.4.1 General muscle force decline · · · ·76
IV.4.2 Comparison among different muscles · · · ·77
IV.4.3 Influence of fatigability· · · ·77
IV.5 Discussions
· · · ·
79IV.6 Conclusions
· · · ·
81V The Build-up of a Full-chain Musculoskeletal Human Model in
Open-Sim
83
V.1 Introduction· · · ·
83V.1.1 The existing OpenSim musculoskeletal models· · · ·83
V.1.2 The full-chain effect of human motion · · · ·83
V.1.3 Objective· · · ·85
V.2 Model development
· · · ·
85V.3 The Full-chain model
· · · ·
86V.3.1 BodySet· · · ·88
V.3.2 ConstraintSet · · · ·91
V.3.3 ForceSet · · · ·91
V.3.4 MarkerSet· · · ·94
V.4 The scaling method of OpenSim models
· · · ·
95V.4.1 Methodology · · · ·96
V.4.2 Results · · · ·99
V.4.3 Discussions on the use of 3D scan in the estimation of body segment masses · · · 102
V.4.4 Conclusions· · · 106
VI The Application of the Full-chain Model on Posture Analysis of an
Overhead Drilling Task
107
VI.1 Introduction· · · ·
107VI.3 Simulation results
· · · ·
110VI.3.1 Joint moments· · · 110
VI.3.2 Muscle activations· · · 111
VI.4 Discussions
· · · ·
113VI.4.1 The full chain effect · · · 113
VI.4.2 The full-chain model as a way of ergonomic posture analysis· · · 115
VI.4.3 Overhead working· · · 115
VI.5 Conclusions
· · · ·
118VII Conclusions and Perspectives
119
VII.1 Contributions· · · ·
119VII.1.1 Muscle fatigue · · · 119
VII.1.2 Working posture analysis· · · 120
VII.1.3 The framework of the MSDs physical risk assessment · · · 122
VII.2 Further investigations and perspectives
· · · ·
122VIII Jing CHANG’s publications
125
II.5 The diagram of muscular-tendon structure [46]. Muscle fibers are oriented at an angle α with the tendon. Tendons moves only along its axis. As the muscle contracts, muscle fibers shorten and the
an-gle α increases. . . 32
II.6 The diagram of motor unites [46]. Each motor unite is functionally disjoint with the others. Motor unite i is excited by signal u(i), gets activated and produces fiber force FM i . . . 33
II.7 The diagram of muscle force generation process [46]. The activa-tion dynamics correspond to the calcium release, diffusion, and bonded to troponin. The contraction dynamics correspond to the energization of cross-bridges between thick and thin filaments, through which muscle forces are generated. . . 34
II.8 The muscle-tendon model [51]. LMT - the total length of the muscle and tendon ; LT - the length of the tendon; LM - the length of the branch of muscle fibers; αM - the pennated angle. . . 34
II.9 The muscle force-length relation. . . 36
II.10 The muscle force-velocity relation at length LM o . . . 37
II.11 The normalized tendon force - tendon strain relation. . . 37
II.12 MET diagram . . . 44
II.13 An EMG activity plot of bicep, triceps and trapezius in a push-pull cycle. [86] . . . 45
II.14 The variable anthropometry man model in SAMMIE. . . 50
II.15 The reach capability analysis with ERGOMAN. . . 51
II.16 The application examples of the RAMSIS. . . 52
II.17 Graphical rendering of digital human models in 3Dexperience . . . 52
II.18 The prediction of operator’s visual accessibility in Delmia. . . 53
II.19 The prediction of the operation path of an object-moving task. . . 53
II.20 The joint load estimation and evaluation in 3DSSPP. . . 54
II.21 A musculoskeletal model in Anybody. . . 55
III.1 The sEMG-fatigue experiment posture. . . 66
III.2 The statistics of RMS in simple contraction test with respect to 5 muscle force levels. . . 67
III.3 The statistics of RMS in fatiguing test with respect to 5 muscle force levels. . . 68
III.4 The statistics of RMS in fatiguing test with respect to 5 muscle force levels. . . 69
IV.1 Full body running digital human modeling. Muscles are represented by red lines. . . 75
IV.2 Workload on erector spinae muscle during 10s arbitrary running at 3.96 m/s. . . 77
IV.3 Force capability lines of ten muscles during 10 min running. k = 1.0 min−1. Force of each muscle is normalized by its maximum. . . 78
vii IV.4 Force capability lines of erector spinae with different preset k
val-ues. Force is normalized by the maximum. . . 79
V.1 Raabe’s full-body lumbar spine model [4]. . . 86
V.2 Topology views of two OpenSim models. . . 87
V.3 The Saul’s 7 degree-of-freedom arm model [5]. . . 88
V.4 The topology view of the Full-chain OpenSim model. . . 89
V.5 A general view of the script of the Full-chain model. . . 90
V.6 The definition of the Pelvis body of the Full-chain model. . . 90
V.7 Diagram of a OpenSim joint. . . 90
V.8 Script of a OpenSim joint. . . 91
V.9 The location of biceps and its representation in the Full-chain model. . 93
V.10 The definition of the right gluteus medius in the Full-chain model. . . 93
V.11 The Full-chain model on the OpenSim interface. . . 94
V.12 Body markers that indicate the location of joint plates. . . 96
V.13 The 3D geometric model of the subject generated by 3D scan. . . 97
V.14 The mesh of pelvis dismembered from the whole-body 3D model. . . . 97
V.15 The OpenSim model used for error analysis. . . 98
V.16 Coordinate (q), velocity (ω), acceleration (dω/dt) of right hip flex-ion in the motflex-ion. . . 102
V.17 Right hip flexion moments calculated from the two models. . . 104
VI.1 Six working postures for a drilling task . . . 108
VI.2 Simulations of six drilling postures. From left to right: low close reach (L-C); low middle reach (L-M); low far reach (L-F); high close reach (H-C); high middle reach (H-M); high far reach (H-F). . . 109
VI.3 Shoulder moment according to the worker posture . . . 109
VI.4 The shoulder rotation moment is considerable beside of the eleva-tion moment . . . 110
VI.5 The muscle activations in total for the six postures under studied . . . 112
VI.6 Locations of three muscle groups . . . 112
VI.7 Muscle activations of specific body parts . . . 114
VI.8 Backward drilling posture in current simulation (left) and in An-ton’s work(right) [43]. . . 116
V.1 Existing OpenSim musculoskeletal models. . . 84
V.2 The degrees of freedom of the Full-chain model. . . 92
V.3 Volume, density and mass of the whole body and segments. . . 101
V.4 Errors of proportionally scaled segment masses with respect to the approximate masses. . . 101
V.5 Errors of the joint moments calculated from the scaled model, with respect to that from the approximate model . . . 103
VI.1 Model joint space settings. Unit: degree. . . 110
VI.2 Estimated joint moments of six simulations. Unit: N.m . . . 111
VI.3 Estimated muscle activations . . . 113
Acknowledgements
I would like to give my sincere thanks to Mr Claude Jard and the fellows of the Laboratoire des Sciences du Numérique in Nantes for their kind supports during my thesis.
I would like to express my gratitude to Mr. Fouad Bennis and Mr. Damien Chablat, my thesis directors. I owe to them the liberal and strict atmosphere of our team. They raise me to be open, critical and humble. Both my life and my work benefit from their great kindness, their availability, their professional guidance and their scientific qualities.
I would like to give my thanks to the jury for their participation in my defence, to Mr. Georges Dumont and Mr. Gérard Poisson for their interest in my work; to Mr. Liang Ma for his patience and help and the valuable advice. I would always appreciate the chance to work with him.
Thank all my friends from Nantes and China for the homey atmosphere around me; thank my family for their patience, understanding and love that have always been there for me.
With these few lines, I would like to express to them how much their presence is necessary to me. Thank you very much.
Glossary
• EMG: electromyography
• DAFW: distribution of days away from work • MVC: maximal voluntary contraction
• MET: maximum endurance time • sEMG: surface electromyography • MUAP: motor unit action potential • MSDs: musculoskeletal disorders • RMS: root-mean-square
• CMC: computed muscle control • DoF: degree of freedom
I
General Introduction
I.1
Motivations
Despite the fact that industrial automation has been greatly developed in the last several decades, manual task is essential in many industries. Workers en-gaged into physical tasks are exposed to high risks of work-related musculoskele-tal disorders, which bring about physical and menmusculoskele-tal afflictions, reduce work per-formance and cause great loss to the industries and the society. The work-related musculoskeletal disorders has been a global concern. Its risk assessment, if eas-ily accessible and well-conducted, would benefit the ergonomic work design and occupational protections.
The biomechanics applies the laws of physics and engineering concepts to de-scribe motion and forces, as stated in the book of Frankel and Nordin [1]. It is a multidisciplinary activity that combines engineering science with biological sci-ence. In this age, it is the belief of many biomechanists that the understanding of biomechanical principles should be further developed to promote its application in industry, especially for the identification and assessment of occupational risks.
This thesis seeks for improvements of the biomechanical methods with regard to the risk assessments of the work-related musculoskeletal disorders. Generally speaking, the occupational biomechanics mainly deal with two types of problems [2]: the impact trauma which caused by the sudden forces, and the overexer-tion trauma that caused by volioverexer-tional activities. Musculoskeletal disorders, with whom the thesis attempts to deal, is one of the main overexertion traumas. Com-pared with the sudden force, impact of the volitional activities is highlighted by
their accumulating effect. Therefore, special attention here will be paid to the work-related fatigue, which is the result of work load accumulation. Other than withdraw some condition-specific conclusions from conventional ergonomic ex-periments, this thesis seeks for more understanding about the biologic features as well as the general mechanic regular patterns of muscle fatigue, for the purpose of fatigue determination and prediction.
It may be controversial whether fatigue is avoidable or not. But enormous re-searches of biomechanics and ergonomics in the last one hundred years have shown undoubtedly that work-related fatigue is amenable to the proper arrange-ment of the working posture. It has been commonly recognized that when con-ducting the same task, different working postures bring about gradable loads on particular body parts. However, the overall body load brought about by different postures is seldom examined. Given that human body is integral and systematic, there is a necessity to explore a general method to evaluate the posture load on whole-body in a comprehensive way.
The last two decades have witnessed the rapid development of biomechanical digital human modeling. The leading platforms include OpenSim and Anybody. Compared with the conventional digital human techniques, the biomechanical digital human modeling is characterized by the application of musculoskeletal models that rooted in both biologics and mechanics. The biomechanical analysis gives estimations of not only skeletal mechanics but also muscle activation stat-ues.
On this account, this thesis will then tend to the evaluation of the whole-body posture load using OpenSim. The possibility of optimizing the working posture for a given task in view of whole-body load is discussed.
I.2
Thesis structure
This thesis explores the development of biomechanic methods for the risk as-sessment of work-related MSDs. On the whole, efforts are made from two aspects: the determination and prediction of muscle fatigue, the evaluation of whole-body posture loads.
I.3 Contribution to the assessment of physical risks of Musculoskeletal disorders 7 The main part of this thesis consists of six chapters. The next chapter (chapter II) deals with the states of the art with regard to the risk assessment of work-related musculoskeletal disorders. Two primary problems are identified: the as-sessment of muscle fatigue as well as the measurement of workload, for which the surface EMG and the biomechanical digital human modeling techniques are highlighted respectively as the promising means. Chapter III and chapter IV focus on the muscle fatigue. In Chapter III, a new surface EMG-based muscle fatigue indicator is proposed and examined with an experiment involving 15 subjects. The new indicator is marked with good performance in tasks involving incon-stant workload as well as with relative complex measurement process. In chapter IV, attempts are made to predict muscle fatigue by integrating a muscle fatigue mathematical model into OpenSim. Chapter V and chapter VI deal with the as-sessment of workload. As illustrated in Section I.1, there is a necessity to explore a general method to evaluate the posture load on the whole body, other than on a partial body part. Chapter V introduces the build-up of a full-chain OpenSim musculoskeletal model, then the errors brought about by the scaling method used by OpenSim for the subject-specification of body segment masses are analyzed. In chapter VI, the model is used for the assessment of whole-body posture loads of an overhead drilling task. The use of average muscle activation level as the indi-cator to posture loads is discussed. At last, conclusions and perspectives of the overall research work are presented in chapter VII.
I.3
Contribution to the assessment of physical risks of
Muscu-loskeletal disorders
This thesis contributes to the physical risk assessment of the work-related Mus-culoskeletal disorders in view of two ergonomic issues: muscle fatigue and pos-ture load. For the muscle fatigue, efforts are made for its posterior indication (chapter III) as well as for its prior prediction (chapter IV). For the posture loads, efforts are made to appraise its physical influence on the whole body: a Full-chain biomechanical model is built up in chapter V, which is then applied to appraise the different postures of an overhead drilling task in chapter VI.
Chapter II. Literature research
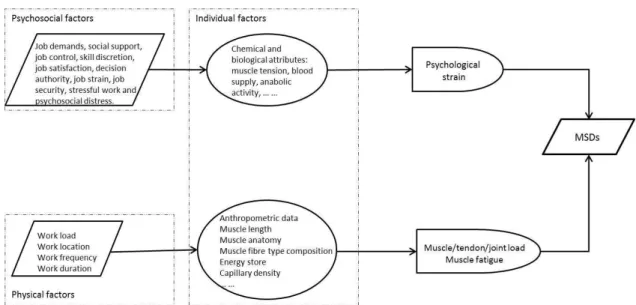
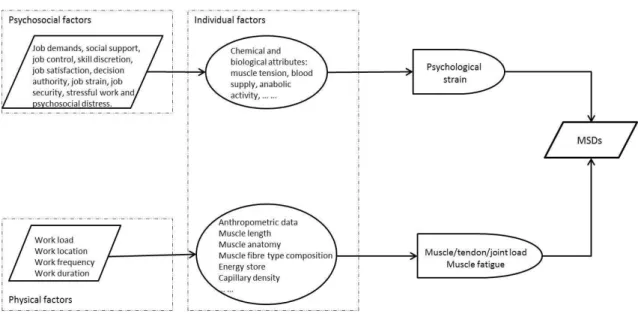
This chapter reviews the state of arts about the work-related musculoskele-tal disorders and the related issues. Epidemiological studies about occupational Musculoskeletal disorders are firstly reviewed and an explanatory model of the contributing factors to Musculoskeletal disorders is summarized (see Figure I.1). As far as the objective of physical risk assessment, three primary problems are identified: the measurement of workloads, the assessment of the workload accu-mulation effect and the quantification of personal traits.
Figure I.1– An explanatory model of the contributing factors to Musculoskeletal disorders
The Musculoskeletal disorders physical risk assessment methods that are most-used in practical are reviewed, which emphasize the need of seeking for new comprehensive and practical methods. Then the ergonomic and biomechanical methods for the three identified problems are reviewed. For the measurement of workload, individual muscle forces are the more concrete indicators than other ergonomic indicators, which are feasible with the development of the biomechan-ical muscular models. For the workload accumulation effect, its main physbiomechan-ical manifestation is muscle fatigue, which could be indicated by surface EMG and predicted by the biomechnical force-based muscle fatigue model. The individual physical characteristics, defined as the muscle fatigability, could be quantified by the tendency of the muscle strength to decline with respect to its maximal capac-ity as well as the external load.
I.3 Contribution to the assessment of physical risks of Musculoskeletal disorders 9 Finally, the development of digital human modeling techniques is reviewed. OpenSim, a free-available software for musculoskeletal human modeling is high-lighted as the promising tool for the integration of physical risk assessment of work-related Musculoskeletal disorders.
Chapter III. The indication of muscle fatigue with surface EMG
This chapter concerns about the indication for muscle fatigue, which serves as the posterior assessment of the Musculoskeletal disorders physical risks. The surface EMG is one of the main choices.
Despite of the fact that the surface EMG has been widely used in ergonomics to indicate muscle fatigue, the EMG characteristic values are actually very limited as indicators: the spectral compression is often slight and insignificant statisti-cally, and the amplitude is significantly affected by the exerting muscle force. In industries, when it comes to comparing different work designs in aspect of their fatiguing effect, these traditional indicators would be insufficient.
In this chapter, a new fatigue indicator is conceived based on the surface EMG amplitude. Two factors have been proven to influence the amplitude root-mean-square (RMS) of a fatiguing muscle: its fatigue level and its exerting force. The idea of the new indicator is to eliminate the force-induced RMS changes, as ex-pressed by Equation I.1.
RMSf e = RMSf −RMSs (I.1)
The RMSf and RMSs, noted as the fatiguing RMS and simple-contracting RMS, are recorded in the fatiguing muscle and the fresh muscle respectively, with the same exerting force. Their difference, the RMSf e, is the conceived indicator.
Then an experiment is designed to test the new indicator. The experiment in-cludes the sustained static maximal voluntary contraction of the elbow flexors (see Figure I.2). The contraction lasts for 60 seconds, during which the muscle force declines from almost 100% MVC all the way along to about 50% MVC. The EMG signals of the biceps corresponding to when the force reaches 90% MVC, 80% MVC, 70% MVC, 60% MVC and 50% MVC were selected. At each of the five contraction levels, EMG signal of the fresh biceps were also recorded. The
Figure I.2– Diagram of the experiment.
90 % MVC 80 % MVC 70 % MVC 60 % MVC 50 % MVC RMSf*(%) 95.38(13.55) 96.37(19.58) 89.69(18.30) 80.06(14.37) 70.19(16.90)
RMSf e*(%) 0.54(11.78) 2.24 (19.18) 14.70 (16.42) 14.67(18.88) 21.27(18.66)
* Normalized by the RMS values corresponding to maximal force.
Table I.1– Normalized RMS values corresponding to five force levels during sMVC session.
the fatigue process to as much as 20% (see Table I.1), which implies that more and more extra effort is needed as muscle fatigue intensifies. The conceived in-dicator provides better indication to muscle fatigue than the traditional RMSf in this condition. Conclusion is drawn that the new indicator could be used as a supplement of the traditional ones, especially for the comparison of the fatigue states of a muscle under different working loads.
Chapter IV. Muscle fatigue analysis in OpenSim
This chapter deals with the muscle fatigue prediction, which would serve as the prior assessment of the Musculoskeletal disorders physical risks. This work is based on the biomechanical digital modeling software OpenSim. The muscu-loskeletal models of OpenSim enable the muscle contraction dynamics, which allows optimizations algorithms such as the Compute Muscle Control to be ap-plied to distribute joint load down to individual muscles.
A plug-in is written to OpenSim to estimate the accumulation effect of the real-time muscle loads onto the remaining force output ability of each muscle. The plug-in refers to the Force-load muscle fatigue model. Workflow of the muscle
fa-I.3 Contribution to the assessment of physical risks of Musculoskeletal disorders 11 tigue prediction process is shown in Figure I.3. The prediction could be applied at any time to all the muscles for arbitrary tasks, with considerations of individual fatigability. Then the plug-in is tested on a set of data from the project of Hamner
Figure I.3– Workflow of the muscle fatigue prediction process of OpenSim with the muscle fatigue
analysis plug-in.
et al. [3]. It is recorded from the real motion of a male subject running at 3.96m/s. The computed load of the erector spinae muscle is shown in Figure I.4. The
simu-Figure I.4– Load on the erector spinae muscle during 10s running.
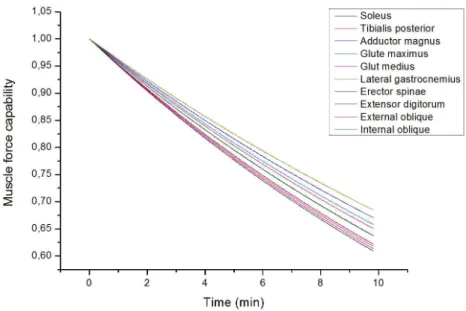
ning at 3.96 m/s for 10 min (shown in Figure I.5). While for someone fatigue-fragile (fatigability k = 1.0 min−1), his muscles would lose 50% to 60% of their initial maximal capability. It can be concluded that the plug-in is easy to apply
Figure I.5– Force capability trends of ten muscles during 10 min running. k=1.0min−1. Force of
each muscle is normalized by its maximum.
for comprehensive prediction of muscle fatigue. Experimental verification is sup-posed to be acted on. The plug-in could serve as a functional tool for the prior musculoskeletal disorders risk assessment.
Chapter V. The build-up of a full-chain musculoskeletal human model in Open-Sim
The development of muscle fatigue is amendable to proper working postures. Enormous biomechanical researches have emphasized the necessity to analyze human dynamics in view of the full dynamic chain. In this chapter, a full-chain musculoskeletal human model is built up in OpenSim for the whole-body posture load analysis.
The Full-chain model is developed based on Raabe’s FBLS model [4] and Saul’s arm model [5]. It consists of 46 body parts, 424 muscles and 37 DoFs, shown in Figure I.6.
iner-I.3 Contribution to the assessment of physical risks of Musculoskeletal disorders 13
Figure I.6– The Full-chain model on the OpenSim interface.
tial parameters in OpenSim is studied. Traditionally, to specify a general Open-Sim model to a new worker, the mass of each segment is scaled with the weight ratio of the worker to the model. Errors of this scaling method as well as the in-fluence brought about by the errors on dynamics analysis is assessed.
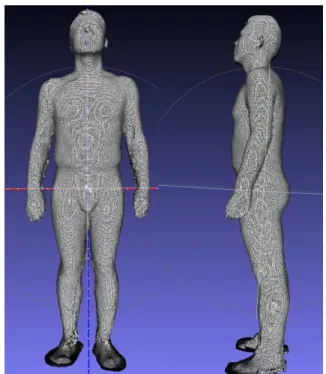
A 3D scan is applied on a male subject to construct his 3D geometric model (see Figure I.7), according to which segment volumes are calculated and masses are determined. The determined segment masses data is taken as the yardstick to assess OpenSim proportionately scaled model. As a result, the error of seg-ment mass reaches up to 5.31% of the overall body weight (torso). Influence on the dynamic analysis was examined with kinematic data of a two-step ordinary walking. The calculated joint moments were found to have an average difference from 3.65% to 12.68% between models with the two sets of data.
Chapter VI. The Application of the Full-chain model on posture analysis of an overhead drilling task
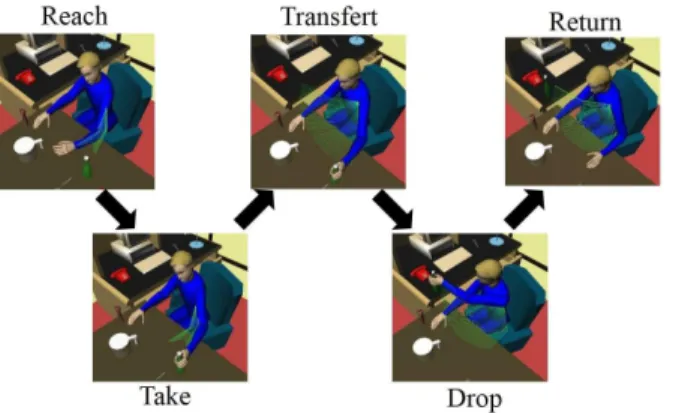
In this chapter, the Full-chain model developed in chapter V is used for whole-body posture analysis. The simulated task is an overhead drilling operations (see Figure I.8). Six postures with two reach height levels and three reach length levels are analyzed (see Figure I.9).
the-Figure I.7– The geometrical model generated from 3D scan.
I.3 Contribution to the assessment of physical risks of Musculoskeletal disorders 15
Figure I.9– Six drilling postures for the drilling operation are analyzed.
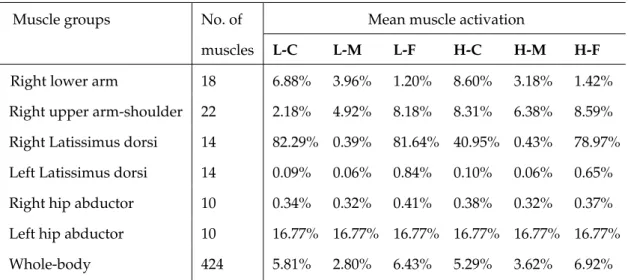
Table I.2– Estimated average muscle activation of the six working postures.
Muscle groups No. of Mean muscle activation
muscles L-C L-M L-F H-C H-M H-F
Right lower arm 18 6.88% 3.96% 1.20% 8.60% 3.18% 1.42% Right upper arm-shoulder 22 2.18% 4.92% 8.18% 8.31% 6.38% 8.59% Right Latissimus dorsi 14 82.29% 0.39% 81.64% 40.95% 0.43% 78.97% Left Latissimus dorsi 14 0.09% 0.06% 0.84% 0.10% 0.06% 0.65% Right hip abductor 10 0.34% 0.32% 0.41% 0.38% 0.32% 0.37% Left hip abductor 10 16.77% 16.77% 16.77% 16.77% 16.77% 16.77%
Whole-body 424 5.81% 2.80% 6.43% 5.29% 3.62% 6.92%
sis put more emphases on exploring the general method for the assessment of the posture loads on whole body. The average muscle activation level (varies from 0 to 100%) is proposed as the indicator of whole-body posture load other than the muscle force. The estimated average muscle activation level of the six simulated postures are shown in Table I.2.
Results shows that the average muscle activation of the six postures varies from 2.8% (low-middle reach) to 6.9% (high-far reach). Conclusion could be drawn that the average muscle activation can be an effective indicator to the posture loads on the whole body. Besides, the Full-chain OpenSim model facilities the posture load assessment in that it enables the comprehensive estimation of
multi-muscles across body cooperate as a full dynamic chain. The possibility of opti-mizing working posture in view of total muscle efforts is discussed.
II
Litterature Research
II.1
Abstract
This chapter reviews the state of arts about the work-related musculoskeletal disorders and the related issues. Firstly, the epidemiologic studies are reviewed, which underlines three primary points for the physical risk assessment of work-related musculoskeletal disorders: the measurement of workload, the evaluation of the accumulating effect of workload, and the quantification of individual phys-ical characteristics. Then the methods that are currently used for the risk assess-ment are reviewed, which emphasizes the necessity of seeking for more accurate methods.
From Section II.4, studies about the three primary points are reviewed respec-tively. For the measurement of workload, individual muscle forces are the more concrete indicators, which are feasible with the development of the biomechan-ical muscular models. For the workload accumulation effect, its main physbiomechan-ical manifestation is muscle fatigue, which could be indicated by surface EMG and predicted by biomechnical force-based muscle fatigue model. The individual phys-ical characteristics, defined as the muscle fatigability, could be quantified by the tendency of the muscle strength to decline with respect to its maximal capacity as well as the external load. The measurement methods of fatigability are reviewed. It is suggested that more measurement be conducted with different populations, so that the database of a populational muscle fatigability would be enlarged as with the other anthropometric measures.
OpenSim, a free-available software for musculoskeletal human modeling is high-lighted as the promising tool for the integration of physical risk assessment of work-related MSDs.
In conclusion, there is a necessity to improve the practical methods of the physical risk assessment of work-related musculoskeletal disorders. Biomechani-cal digital human modeling technique is promising to contribute to the improve-ments. Efforts are needed for the measurement of workload on the overall body, for the predication of muscle fatigue in a task, and for the objective indication of fatigue.
II.2 Musculoskeletal disorders: an epidemiologic overview 19
II.2
Musculoskeletal disorders: an epidemiologic overview
II.2.1 Definition of MSDs
Despite of the rapid development of automation techniques, manual work is still irreplacable in many cases due to its flexibility and adaptability. Manual tasks like drilling, sanding, and material handling are inevitable in many industries, which demand higher level and longer-lasting physical loads. Workers engaged in these tasks are exposed with high risks of Musculoskeletal disorders (MSDs).
As reported by the Health, Safety and Executive in UK [6], the average rate of MSDs of all industries in Britain is about 1,500 per 100,000 workers (average date from 2014 to 2017). Industries of construction, agriculture, transportation and storage, human health and social work activities are highlighted by the high-est MSDs risks. In France, MSDs take up more than 75% of the occupational dis-eases in 2015 [7], which underlies a huge population involved.
MSDs are defined as the injuries and disorders to muscles, nerves, tendons, ligaments, joints, cartilage and spinal discs and do not include injuries result-ing from slips, trips, falls or similar accidents [8]. Body parts most commonly involved are the low back, neck, shoulder, forearm, and hand [9], while the lower extremity gains also lots of attentions.
MSDs results in high rate of employee turnover and sick leave as well as a huge amount of health compensation. The record of 2016 occupational injury and illness of Massachusetts, Unite States shows that working days loss due to over-extension and bodily reaction, with a proportion of 36.4%, is ranked as the first cause factor of sick leave [10] (Table II.1). Data of the Britain shows that 8.9 million working days are lost due to MSDs; In European Union, it was estimated that the MSDs bring about 0.2% to 5% GDP loss [11].
One of the main task of occupational biomechanics is to apply biomechanical principles in the control of work-related MSDs risks from aspects of work de-sign and worker management. This should be based on a solid understanding of MSDs-related knowledge and pragmatic techniques. The task is promising in
Table II.1– Distribution of days away from work (DAFW) by the type of event [10].
II.2.2 Contributing factors to MSDs
As is always the case, work-related MSDs, common and prevalent phenomena in actual life, are found to have complex relationships with numerous factors. Occu-pational epidemiology has revealed three categories of related factors: physical factors, psychosocial factors and individual factors.
Physical factor is always mentioned as the "exposure to risk" factor for MSDs. It denotes the influence of work design and working conditions on human physique. As Burdorf [12] has reviewed, heavy physical work, static work posture, frequent bending and twisting, lifting and forceful movements, repetitive movements and whole-body vibration were the most commonly listed occupational risk factors for disorders of the back in epidemiology. For the MSDs of the neck and upper-limb, evident exposure includes: work with hands at or above shoulder level, lo-calized shoulder muscle fatigue, work tasks strenous to the muscle tendon struc-tures of the upper limb, repetitive arm work, constrained head and arm posture, and the use of vibrating handtools [13].
These physical exposure factors were summarized by Armstrong et al. [13] down to four variables: work load, work location, work frequency and work du-ration. In the view of biomechanics, these factors (except for the vibration factor) make influence on human body by two means: body loads (muscle/joint/tendon loads) and the accumulation effects of body loads along time.
II.2 Musculoskeletal disorders: an epidemiologic overview 21
Figure II.1– An explanatory model of the contributing factors to MSDs
impacts on workers’ mental health status. Psychosocial stressors at work have been found to be associated with risk of MSDs by enormous studies. Haukea et al. [14] summarized the results of 54 longitudinal related studies and concluded 10 factors that are mostly investigated: job demands, social support, job control, skill discretion, job satisfaction, decision authority, job strain, job security, stress-ful work and psychosocial distress. It has been concluded that psychosocial fac-tors should be considered as independent predicfac-tors of MSDs.
The individual factors refer to the physical and mental attributes specific to the subject which determine how the subject react to the physical factors and psychosocial factors. Those in regard to the physical factors include the anthropo-metric data of the subject (body size and shape), the muscle anatomy, the muscle fiber type composition, energy store, capillary density and so on [13]. These fac-tors determine how the work load is distributed to each part of the body, as well as how the load is accumulated and fatigue the body. The individual attributes concerning the psychological factors affect the transform from psychosocial stres-sors to psychological strains chemically and biologically. The explanatory model is shown in Figure II.1.
This thesis focuses on the physical risks for MSDs of individuals, which is the second pathology path in Figure II.1. The primary questions that concern
biome-• how to evaluate the muscle/tendon/joint load given a specific work situa-tion;
• how to evaluate the fatigue effect of the muscle/tendon/joint load given a specific work frequency and/or work duration;
• how the individual factors influence the muscle/tendon/joint load and its fatigue effect.
It is of great importance to assess the physical risk of MSDs in view of worker protection. The assessment is supposed to involve consideration of the above three aspects. In the next section, assessment methods that are currently used is to be reviewed.
II.3
MSDs physical risk assessment in practice
In this section, ergonomics tools that are most commonly used in practice to assess the physical risks for MSDs are reviewed and discussed. These assessment tools are based on either the observation of work processes or self-reports, noted as the observational methods and self-reported methods.
II.3.1 Observational methods
Conventional observational method is usually based on pens and papers. Practi-tioners observe the working process being assessed, recognize the listed traits of the work, and grade these traits according to the instructions of the tool. A score or a code is then assigned to each of the traits, which represents the risk level of that trait. Then the scores or codes are processed together according to the prede-fined method by each specific tool, which generates an overall value. The value is the assessed indicator of the physical risk level of MSDs. The Figure II.2 is an example.
Some tools of this method assess the MSDs risks of whole-body, while some others focus on specific body parts such as the low back, the neck and shoulder. Tools of the former type commonly used in ergonomics include the Posturegram [16], the Ovako Working Posture Analyzing System (OWAS) [17], the Posture Tar-geting [18] and Quick Exposure Check (QEC) [19], Rapid Entire Body Assessment
II.3 MSDs physical risk assessment in practice 23
Figure II.2– Rapid Entire Body Assessment Checklist [15].
(REBA, see Figure II.2) [15]; tools of the latter type include the Rapid Upper Limb Assessment (RULA) [20], the Hand-Arm-Movement Analysis (HAMA) [21] and the PLIBEL (Method for the identification of musculoskeletal stress factors that may have injurious effects) [22]. The features of these tools are concluded by Li and Buckle [23], as shown in Table II.2.
Generally, traits to be observed and taken as input data include the working posture, the external force and the time sequence of the task (task frequency and duration).
Working posture as the input data
Generally, working posture is the trait valued most in these observational tools. Descriptions such as ’head turned partly to side or slightly forward’ and ’head turned to side or head forward about 20°’ are used to classify the postures. An
Table II.2– The features of some observation-based tools for MSDs risks assessment [23].
Tools Features and applications
Posturegram Body postures are categorized and recorded by time sampling on to cards as digital numbers.
Whole body posture evaluation for static tasks.
OWAS Categorized body postures in digital numbers, including force; time sampling, has action categories.
Whole body posture analysis.
Posture Targeting Postures are marked as angles and directions together with work activ-ities by time sampling.
Whole body posture recording for static tasks.
QEC Estimate exposure levels for body postures, repetition of movement, force / load and task duration for different body regions, with a hy-pothesized score table for their interactions. Assessing the change in exposure for both static and dynamic tasks.
RULA Categorized body posture as coded numbers, including force and mus-cle activities; time sampling, with action categories.
Upper limb assessment.
HAMA Record the types of motion, grasps, hand position and features of load handled; the data is linked to work activities.
Upper limb assessment.
PLIBEL Checklist with questions answered for different body regions. Identifi-cation of risk factors
REBA Score the body posture, estimate the load, with action levels. Risk assessment of the entire body for non-sedentary tasks.
II.3 MSDs physical risk assessment in practice 25 example of the classification of shoulder posture in several tools are shown in Table II.3.
External force as the input data
Most tools of this method consider external forces as absolute values exerted dur-ing work, such as OWAS, RULA, REBA. OWAS classifies force into three level: under 10 kg, 10 to 20 kg and over 20 kg. REBA classifies force as under 5 kg, 5 to 10 kg and over 10 kg. For RULA, the criteria is 2 kg or less, 2 to 10 kg or over 10 kg. The exerted forces that are repetitive, or static, or exerted rapidly are considered specially.
Time sequence as the input data
The MSDs risk brought about by the load accumulation effect is mainly assessed by the duration and frequency of tasks. For example, the RULA and REBA clas-sify the task into static (duration longer than 1 min) and repetitive; The most com-prehensive consideration of the time sequence is defined by the LUBA [25], where tasks with various numbers of phases and various duration of those phases is ac-cepted. It also allows the changes of external load between phrases. In spite of this, the observational methods takes poor consideration about arbitrary motion and multi-tasks.
Discussions
Generally speaking, the observational methods are easy to apply, inexpensive, and without disruption to the work. However, the defects are also evident. As discussed in section II.2.2, the physical risk of MSDs for an individual is depend-ing on three aspects: the load on body parts (muscles/tendons/joints), the cumu-lative effect of the body load, and the individual traits. The observation-based method reviewed in this section involves considerations about the first and the second aspects, while neglecting the individual traits.
The observational tools are posture-based. Problems arise here in that they function poorly in dynamic tasks and multi-tasks. It is very complex to decom-pose a dynamic task into postures, external forces and task durations when the
Table II.3– The classifications of shoulder posture of some observational tools(adapted from [24]).
Posture LUBA* RULA REBA EN1005-4**
Arm flexion 0°- 45° 0°- 20° 0°- 20° 0°- 20° 45°- 90° 20°- 45° 20°- 45° 20°- 60° 90°- 150° 45°- 90° 45°- 90° > 60° > 150° > 90° > 90° Arm extension 0°- 20° 0°- 20° 0°- 20° > 0° 20°- 45° < 20° < 20° 45°- 60° > 60° Arm adduction 0°- 10° - - 0°- 20 ° 10°- 30° 20°- 60° >30° >60° Arm abduction 0°- 30° 0° 0 ° < 0° 30°- 90° >0° >0 ° >90°
Arm medial rotation 0°- 30° 0° 0°
-30°- 90° > 0° > 0° > 90°
Arm lateral rotation 0°- 10° 0° 0°
-10°- 30° > 0° > 0° > 30°
* LUBA: postural loading on the upper body assessment [25].
II.3 MSDs physical risk assessment in practice 27 posture and external force change from instance to instance, and duration of each phrase is very short.
Even in the assessment of posture load on body parts, where the primary em-phasis is laid, the observational method has a long way to go. The first effort should be made in the clear and complete description and definition of postures. For instance, the shoulder joint is a ball joint that permit the humerus to rotate in three dimensions. The description of shoulder posture requires at least three parameters in the Cartesian coordinate: arm adduction, arm elevation and arm rotation. As we can see in Table II.3, even of the upper-limb-focused tools, many do not have complete shoulder posture descriptions: arm rotation is ignored in most case. The second effort is expected in the consideration of the combination effect of risky postures. Since the human body is systematic and body parts are intra-supported and connected as a chain. The ignorance of the full-chain effect would also inhibit the unequivocal evaluation of body loads.
II.3.2 Self-report methods
Theoretical basis of this method is the association between the perceived physical demand and MSDs that has been reported by previous researches [27,28,29,30]. The objective of the self-report is to evaluate the perceived physical demand. In ergonomics, some scales and questionnaires with examined validity and reliabil-ity are available in this aspect, such as the the Job Content Questionnaire (JCQ) (physical part) [31], the Body-map [32], Borg’s perceived exertion scale [33], the Swedish Occupational Fatigue Inventory (SOFI) [34].
The concept of ’industrial comfort’ was raised [32], the measure of which is the level of discomfort. Based on this concept, the Body-map ask for ratings on the perceived discomfort level, which is the worker’s subjective feeling. The JCQ emphasizes more on worker’s impression about the working situation. Items like ’in my job I am Often moving/lifting very heavy loads’, ’in my job I am working for long periods with my head or arms in awkward positions’ are asked. The Borg’s perceived exertion scale [33] estimates the worker’s effort, breathlessness and fatigue. The SOFI focuses more on the fatigue. Five aspects are included:
lack of motivation, sleepiness, physical discomfort, lack of energy and physical exertion, which involve both peripheral and central fatigue.
The assessment given by the self-report method has been shown to be a good indicator to MSDS by many researches. The assessment of the risk of MSDs in the self-report method could be seen as a synthetic measure of the cumulative body loads and the individual traits. In the explanatory model about the devel-opment of MSDs in Section II.2.1 (Figure II.1), it goes near to the third phrase, the ’muscle/tendon/joint load and local muscle fatigue’. Differences between the two are that: 1. the measure of the self-report method is the part of ’the muscle/tendon/joint load and local muscle fatigue’ reflected subjectively by the worker, and 2. the measure may be influenced by the worker’s physiological con-dition also.
II.3.3 Summary
As discussed in Section II.2.2, three aspects should be considered in terms of phys-ical risks of MSDs assessment of individuals: the work load on body parts, the cumulative effect of the body load, and personal traits. Observational method in-volves the consideration of the work load and the cumulative effect, but with a lack of accuracy. The self-report method touches upon all the three aspects syn-thetically. But given that the objective of the physical risk assessment is to get a clear idea about the source of risks and hereby to control the risk, the use of the self-report method would be limited by the synthesis as well as the interference of the worker’s physiological condition.
From the next section, we are going to review the biomechanical techniques of the three aspects concerning MSDs physical risk: the work load analysis, the cumulative effect of body loads (fatigue), and personal traits with the purpose of seeking for new method of MSDs physical risk assessment.
II.4
Work load analysis
As concluded in the last chapter, the assessment of physical risks of MSDs should be founded on three aspects: the measurement of instant work load, the evaluation of the accumulation effect of the instance work load, and the proper
II.4 Work load analysis 29 involvement of subject-specific characteristics. In this section, existing ergonomic methods of the first aspect, i.e., the measurement of instance work load on human body will be reviewed and discussed.
II.4.1 Work load evaluation: ergonomic methods
In ergonomics, it is very often desirable to evaluate the loads on human body of a work. Measures that are commonly used include the surface electromyography (sEMG), the work pulse, the acceleration of body parts, the joint moment, ect..
The sEMG is the indicator of muscle activities. For the assessment of work loads, the sEMG offers two types of measures: the muscle activating time and the intensity. The first measure is practical especially in the prolonged low-level-load works [35]. For example, the studies of Hägg & Åström [36] and Veiersted et al. [37] have shown that the lack of rest time, demonstrated by the continuous mea-surable sEMG of the trapezius muscle, is one of the most important determinant of the neck MSDs. The second measure, usually calculated by the 50th or 90th percentile of the sEMG activity, is used to indicate the intensity of work load [38]. For example, in the study about the authentic work of dental hygienists, the load on the forearm extensor muscles was found to be high, with the 90th percentile sEMG activity as much as 23% of its maximal [39].
Work pulse was defined as the difference between working heart rate and rest-ing heart rate [40]. Large work pulse indicates strenuous work and heavy work load [38]; The body acceleration measured by accelerometers placed on certain parts of body provides information about the movement demand of the work, which was also used as an indicator to work load [41, 38]. Problem of these two measures as indicators of workloads is that they are indirect and affected by many other factors. The measurement validity is questionable.
Joint moment is a direct indicator of workloads, the measurement of which should be based on mechanical analysis. The mechanical analysis requires the clear knowledge about joint posture, velocity, acceleration and external force. The measurement method and main challenges are discussed in the next section.
Figure II.3– A schema for shoulder joint moment calculation [42]. Posture configuration is
deter-mined by the length of upper arm lSEand lower arm lEW, as well as the upper arm incline angle q1and elbow angle q2.
II.4.2 Joint moment measurement
As illustrated above, the calculation of joint moment is based on the knowledge of joint kinematics and external forces. The accuracy of estimated joint moment is limited mainly by the measurement of joint kinematics: joint posture, velocity and acceleration.
In ergonomic practice, the joint posture is very often determined from the worker’s two-dimensional motion projection on the sagittal plane. Figure II.3 shows the schema used by Ma et al. [42] to calculate the shoulder joint load of a static drilling task. The same method has been used by Anton et al. [43] in the estimation of subjects’ shoulder joint moment during a static overhead drilling.
The sagittal plane-projection has been very commonly used to determine the joint postures. Posture configuration based on the sagittal plane-projection (shown in Figure II.4) has long been used to predict the maximal moment of joint’s flexion-extension movement, with numerous prediction equations, as has been summa-rized by Chaffin in his book ([44], p263).
This method is simple and practical for static joint moment estimation, and works well in single-degree-of-freedom joint such as the elbow. The shortages are also evident. Firstly, the lack of information about joint velocity and accel-eration limits its usage in dynamic cases. Furthermore, even in static case, the measurement is incomplete for multi-degree-of-freedom joint. For example, the
II.4 Work load analysis 31
Figure II.4– Traditional ergonomic method determines the configuration of human posture by its
projection on the sagittal plane ([44], p262).
shoulder joint is a ball-in-sachet joint with three degrees of freedom. With the sagittal plane-projection method, only the shoulder elevation moment can be de-termined. Movement on the other planes, such as shoulder rotation and shoulder adduction moment, are ignored. Yet as stated by An et al. [45], the arm configura-tion of the frontal plane makes significant difference in joint loads as well.
Future development in joint moment measurement would turn more and more to the digital human modeling techniques. Those who involve biomechanical musculoskeletal model could provide complete description of joint movement. With the help of digital techniques, the time sequence of posture configuration can be generated, as well as that of joint velocity and acceleration. The digital human modeling techniques are reviewed in Section II.7.
Figure II.5– The diagram of muscular-tendon structure [46]. Muscle fibers are oriented at an angle αwith the tendon. Tendons moves only along its axis. As the muscle contracts, muscle fibers
shorten and the angle α increases.
II.4.3 Muscle force assessment
Human motion starts from the exciting signal sent by the central nervous system to muscles, which brings about muscle contractions. Then the contracted mus-cle forces are transmitted by tendons to joints, hence movements happen sub-sequently. Muscle is the only apparatus that contracts voluntarily in the muscu-loskeletal system. Since it is very difficult to measure the force of individual mus-cles, most ergonomic practitioners would stop by joint moments when estimating workloads. But if we want to take a close look at the work load, muscle force is something of great interest.
This section will review and synthesize the knowledges of muscle-tendon prop-erties, as well as the biomechanical models that have been developed in the last century with enormous efforts of the biomedical and biomechanical scientists. Muscle-tendon architectures
A muscle can be considered as a branch of muscle fibers with equal length, aligned in parallel, with an acute angle α>0 to the tendon, as shown in Figure II.5. The branches of muscle fibers are attached to the aponeurosis, the internal part of the tendon (the dark region in Figure II.5) on its two ends.
The smallest contraction unit of the muscle is called a motor unit. It is defined as a nerve axon and the set of muscle fibers innervated by this nerve axon and its branches [47]. A muscle can be viewed as a collection of n motor units, each with
II.4 Work load analysis 33
Figure II.6– The diagram of motor unites [46]. Each motor unite is functionally disjoint with the
others. Motor unite i is excited by signal u(i), gets activated and produces fiber force FM i .
its control sequence ui(t) from the central nerve system, as shown in Figure II.6. The summation of all motor units forces (FM
i ) is the generated force of the muscle FM. The motor units are always classified into the ’slow contracting’ and ’fasting contracting’, with different energy metabolic and fatigue properties.
The muscle force generation process starts from the excitation of the central nervous system. The command signal is transmitted to the muscle fiber. The in-nervated motor unit would discharge in synchrony with one another. This neural and muscular excitation process is always referred to as the ’neuromuscular ex-citation’, or ’neural excitation’ in this thesis. Then the surface action potential is transmitted to the interior of the muscle by means of the transverse tubular sys-tem. Calciumions enter the muscle cell, triggering the release of calcium from the sarcoplasmic reticulum. Calcium diffuses to the myofilaments and combines with the troponin-tropomyosin system, which allows actin and myosin to inter-act. This interaction in the presence of ATP results in cross-bridge cycling, which produces forces. The calcium dynamics that mediate the neural excitation-muscle contraction coupling is always mentioned as the ’muscle activation’ process [46]. The muscle force generation dynamics can be divided into two phrases: mus-cle activation dynamics and musmus-cle contraction dynamics, as shown in Figure II.7. The former refers to the process from central nerve system excitation signals (u(t)) being input to the motor unit to the muscle being activated (muscle acti-vation level a(t)); the latter corresponds to the process of activated muscle fibers contraction, hereby muscle force (FM ) is generated.
Figure II.7– The diagram of muscle force generation process [46]. The activation dynamics
spond to the calcium release, diffusion, and bonded to troponin. The contraction dynamics corre-spond to the energization of cross-bridges between thick and thin filaments, through which muscle forces are generated.
Musculo-tendon contraction mechanics modeling
As stated by Zajac [46], all the researches investigating the musculo-tendon con-traction use are based on the mechanical model developed by Hill [48], Wilki [49], Ritchie and Wilkie [50] at around 1950s. This model is known as the Hill-type model (see Figure II.8). It consists of a muscle in series with a tendon. The tendon is modeled by an elastic element whereas the muscle is modeled by a contractile element (CE) in parallel with an elastic element. The CE generates an ’active force’ (FCE). By comparison, the elastic element is also called a passive
ele-ment (PE) and generates a ’passive force’ (FPE). For the muscle, both PE and CE contribute to the muscle force (FM). The force FCE depends in the muscle fiber length LM, the contraction velocity vM, and the muscle activation level a(t).
Figure II.8– The muscle-tendon model [51]. LMT- the total length of the muscle and tendon ; LT
-the length of -the tendon; LM- the length of the branch of muscle fibers; αM- the pennated angle.
Muscle activation dynamics
The muscle activation dynamics concern about how the muscle reacts to the ex-citation signal sent by the central nervous system and transfers the neural
exci-II.4 Work load analysis 35 tation to muscle activation. It is related to the dynamic process of calcium being released from the sarcoplasmic reticulum, diffused and bonded with the troponin. Some researchers define it as the relative amount of calcium bond to troponin [52]. With the same level of neural excitation, calcium release and diffusion would be less efficient as the amount of available calcium decreases, which is expressed as the sluggishness of muscle activation as the current activation level increases.
Given the dimensionless input u(t)(the excitation level, from 0 to 1), the mus-cle activation level could be modeled by a non-linear first order differential equa-tion [51,53]:
da dt =
u−a
τa(a, u) (II.1)
where τa(a, u)is a time constant that varies with activation level:
τa(a, u) = τact(0.5+1.5a); u>a τ deact/(0.5+1.5a); u≤a (II.2) where τact is the activation time constant and τdeact is the deactivation time con-stant. Typical values for τactand τdeact time constants are 10 ms and 40 ms, respec-tively.
The full activation (i.e., a(t) = 1) occurs when the muscle has been maximally excited (i.e., u(t) =1) for a long time. Conversely, the muscle which has not been excited for a long time is inactivated (i.e., u(t) =a(t) =0).
Musculo-tendon contraction dynamics
Musculo-tendon contraction dynamics coorespond to the transformation of mus-cle activation to force generation, which depend on the activation-force-length-velocity properties of muscle and the elastic properties of tendon.
When the muscle is in steady state (in comparison with the state of being short-ening or lengthshort-ening) , the isometric force is developed. The developed force depends on the muscle’s force - length property and activation level. At stated above, both the CE and the PE contributes to the developed muscle force. The ac-tive force is generated when muscle length is between 0.5LM
o and l.5LoM. The LoM is called the optimal muscle fiber length, the length at which FCEpeaks and from
relationship of muscles. The active force is scaled by the activation level, and the passive force is assumed to be independent with it, as shown in Figure II.9.
Figure II.9– The muscle force-length relation.
When a muscle is subjected to an constant external force, it shortens and then terminates at a length at which the external force can be hold steadily (specified by the muscle force-length relation). Given the length trajectories and external forces, the empirical muscle force - contraction velocity relation could be con-structed for any muscle length between 0.5LM
o and 1.5LoM. The F−vrelation curve at the optimal muscle length LM
o is shown in Figure II.10 At the optimal muscle length LM
o , a maximal shortening velocity vm is defined, at which the muscle can-not sustain any force, whatever the activation level is.
Tendon force was assumed to increase exponentially with strain during an initial toe region, and linearly with strain thereafter, shown in Figure II.11. The tendon strain at maximum isometric force is defined as parameter εT
0.
The properties and parameters to simulate the dynamics of a specific muscle-tendon unit
As discussed above, to formulate a muscle-tendon contraction model, the follow-ing properties are in need:
II.4 Work load analysis 37
(a) a(t) = 1 (b) a(t) = 0.5
Figure II.10– The muscle force-velocity relation at length LMo
Figure II.11– The normalized tendon force - tendon strain relation.
• A dimensionless force-length curve of PE; • A dimensionless force-length curve of CE; • A dimensionless force-velocity curve;
• A dimensionless activation dynamics equation.
And the parameters needed to specify a muscle-tendon unit are: • Peak isometric active force FM
o ; • Optimal muscle fiber force LM
o ; • Optimal muscle pennation angle αo; • Maximal shortening velocity vm;
With proper definition of the above properties and specification of the pa-rameters, it is achievable to simulate the muscle-tendon dynamics. Hence the understanding about work load onto specific muscles is expectable. Nowadays this work has been realized with the help of digital human modeling techniques, which is about to be introduced in Section II.7.
II.4.4 Summary
In this section, the ergonomic methods as well as the biomechanical methods to measure the work load on human body are reviewed and discussed, as the first step to assess the physical risks of MSDs comprehensively. The measurement of joint moments and estimation of muscle forces are highlighted as the more precise and promising methods, in comparison with traditional ergonomic methods. The next section would discuss about the second step of the physical risks assessment: the accumulation effect of the measured workloads.
II.5
Fatigue: the accumulation effect of workloads
The accumulation effect of workloads is mentioned as “fatigue” in this thesis. Workloads influence both the physical and psychological conditions, therefore fatigue would happen in both physics and psychologies. This thesis focuses on the physical part.
II.5.1 Physical fatigue: central and peripheral
Physical fatigue is supposed to manifest as the decline of physical performance. In the whole human physical motion system, skeletal muscle is the only compo-nent that can be controlled voluntarily by the nervous system. Therefore it would not be too assertive to consider muscle fatigue as the representation of physical fatigue.
Muscle fatigue is referred as the decline of muscular ability of using biological energy to generate force or power. It was defined as ’any reduction in the abil-ity to exert force in response to voluntary effort’ ([44], p43). This reduction can be caused by failures at one or more sites along the path from central nervous system to contractile apparatus. For example, it is generally agreed that
biochem-II.5 Fatigue: the accumulation effect of workloads 39 ical changes that happened within muscle fibers, such as the lactate concentra-tion, the breakdown of the phosphagens and glycogen are related with force loss [54, 55]. Also, considerable researches report declines in surface electromyogram (EMG) activity during voluntary fatiguing contractions [56, 57, 58], which sug-gests that inadequate neuromuscular activation resulted from either a decline of central nerve system motivation or a failure of peripheral electrical transmission, is also related with force loss.
II.5.2 Determination of muscle fatigue
For ergonomic researchers and practitioners, it is often desirable to have means for muscle fatigue measurement. In ergonomics, fatigue is usually measured in three means: the reduction of maximal voluntary contraction (MVC), the self-rating discomfort, as well as the surface myoelectric activity change. Self-self-rating discomfort was reported to be a valid estimator [59], but its usage is limited by the subjectivity. Here we overview the other two measures.
The decline of maximal voluntary contraction
It is the most commonly used fatigue measure in ergonomic fatigue-related re-searches. The MVC is defined as the capacity to produce torque or force by a maximal voluntary isometric muscular exertion [60]. Table II.4 summarizes the traits of protocols used to measure the MVC in previous studies.
As summarized in Table II.4, the MVC is mostly measured as the largest value during a static contraction or across several contractions. A contraction usually lasts for 2 to 6 seconds. The subject was simply asked to exert his maximal force, or to exert his maximal force as rapid as possible. The largest output force is taken as the MVC value in all these protocols.
As far as the definition of muscle fatigue, the decline of MVC would be its most validate measure. The only problem of this measure is that it requires in-terruptions of the tasks or experiments. Besides, in some situations we need to determine the fatigue level in the middle of a fatiguing process, then the mea-surement of MVC would bring about extra fatigue and influence the following task.
Table II.4– The measurement of MVC in previous researches.
First author Muscles No. of trials Duration of each trial Determination of MVC Petrofsky [56] Handgrip, biceps, adductor pollicis and quadriceps
3 < 3 s The largest force of all tri-als
Nussbaum [61] Torso
exten-sor muscles 3 The largest torque of alltrials Iridiastadi [62] Upper arm
muscles 4 to 5 6 s The largest force of all Nussbaum [63] Shoulder
and arm
muscles
5 s. Follow a ramp-up, hold, and ramp-down process. The largest force of all tri-als
HÄkkinen [64] Thigh
mus-cles 2.5 s The subjects respond toan auditory signal by ex-erting their maximal force as rapidly as possible and to maintain that force. Maïsetti [65] The vastus
medialis and vastus lateralis
2 The highest torque
pro-duced during three suc-cessive contractions
West [66] The hand
and wrist flexor mus-cles
3 3.5 s The largest of the three tri-als
Krogh-Lund
[67] Arms At least 3 The largest 1-s averagevalue reached within any single force recording Sood [68] Shoulder
muscles Trialsuntil the maximalcontinued force was lower than that exerted in a previous trial.
II.5 Fatigue: the accumulation effect of workloads 41
Determination muscle fatigue with EMG
Surface electromyography (sEMG) uses the surface electrodes to record the myo-electric (ME) activity. The ME activity manifests the neuromuscular activation of a contracting muscle. As De Luca [69] has put it, ME signal is exceedingly compli-cated. It is influenced by the anatomical and physiological properties of muscles, the control scheme of the peripheral nervous system, and the characteristics of the detecting instruments. In the past half century, enormous efforts have been made to raise the level of awareness of the cause and effect of the influential fac-tors mentioned above and EMG signal. However, to consider all these process and phenomena in a quantitative manner is still beyond our reach.
Yet the use of the EMG signal to evaluate the level of muscle fatigue is consid-erably appealing, in that the signal displays the in-situ, time dependent changes of muscle states [70].
Overall, sEMG signal is the synthesis of myoelectric and anatomic properties: the shape of motor unit action potential (MUAP) waveform [71], the firing rate of MUAP trains, the recruitment of new motor units [69] as well as the subcuta-neous tissues which act as a volume conductor and cause a spatial low-pass fil-tering effect when conducting myoelectric signals [72]. In the process of fatigue, metabolites such as lactic acid concentrate, for which the muscle fibre conduc-tion velocity (CV) decreases. The decrease of CV directly changes the shape of the MUAP waveform and leads to the compression of EMG spectrum towards its lower part [73]. As a result, more energy passes through the tissues which act as a low pass filter, and is detected by the surface electrodes, leading to an increase of sEMG amplitude.
The sEMG-based indicators of muscle fatigue that are currently used can be divided into two types: i. the decrease of frequency domain eigenvalue, such as the median power frequency (MDF); ii. the increase of time domain eigenvalue, such as the root-mean-square (RMS) [74, 75]. But it should be noted that these sEMG indicators are not always applicable. Firstly, sEMG spectral compressions which bring about the decrease of frequency domain eigenvalue are sometimes


![Table II.3 – The classifications of shoulder posture of some observational tools(adapted from [24]).](https://thumb-eu.123doks.com/thumbv2/123doknet/7886251.264079/39.892.151.749.292.988/table-ii-classifications-shoulder-posture-observational-tools-adapted.webp)
![Figure II.4 – Traditional ergonomic method determines the configuration of human posture by its projection on the sagittal plane ([44], p262).](https://thumb-eu.123doks.com/thumbv2/123doknet/7886251.264079/44.892.296.607.129.571/figure-traditional-ergonomic-determines-configuration-posture-projection-sagittal.webp)