DIAL • 4, rue d’Enghien • 75010 Paris • Téléphone (33) 01 53 24 14 50 • Fax (33) 01 53 24 14 51 E-mail : dial@dial.prd.fr • Site : www.dial.prd.fr
D
OCUMENT DE
T
RAVAIL
DT/2009-08
Gender Disparities in the
Malagasy Labour Market
Christophe J. NORDMAN
Faly RAKOTOMANANA
Anne-Sophie ROBILLIARD
GENDER DISPARITIES IN THE MALAGASY LABOUR MARKET1
Christophe J. Nordman IRD, DIAL, Paris
nordman@dial.prd.fr
Faly Rakotomanana INSTAT, Madagascar, DIAL
Paris
rakotomananafaly@yahoo.fr
Anne-Sophie Robilliard IRD, DIAL, Dakar
robilliard@dial.prd.fr
Document de travail DIAL Octobre 2009 Abstract
In this study, we address the issue of gender differences in labour market performances for Madagascar using data from two national household surveys carried out in 2001 and 2005. The data collected in these surveys allow us to measure the gender pay gap at two points in time, and to analyze the determinants of occupational choices across sectors of employment as well as of wages and earnings. Our results show that the average gender wage gap is relatively small and stable over time. Across wage employment sectors, the gender gap appears to be the lowest in the public sector and the highest in the informal sector. In non-farm self-employment, however, the gender earnings gap is much higher and declined between 2001 and 2005. Using full decomposition techniques, we provide evidence that gender specific sectoral location explains a significant share of the gender wage gap in both years. Augmented earnings equations estimates carried out for the non-farm self-employment sector suggest that the gap in this sector is driven by the very unequal distribution of micro-firm attributes between men and women. This results points to a potential source of earnings differential often ignored in the gender gap literature which is access to physical capital by women.
Key words: labour force participation, sectoral allocation, earnings equations, gender wage gap, Madagascar
Résumé
Dans cet article, nous analysons les différences de genre en matière de performances sur le marché du travail de Madagascar à l’aide d’enquêtes ménages menées au niveau national en 2001 et en 2005. Grâce à ces deux points dans le temps, nous examinons la dynamique des déterminants de l’allocation sectorielle et de l’écart de gains entre sexes. Nos résultats montrent que l’écart salarial moyen entre sexes est relativement faible et stable entre ces deux périodes. L’écart salarial est le plus faible dans le secteur public et le plus élevé dans le secteur informel. Pour les travailleurs indépendants hors-agriculture, l’écart de gains est beaucoup plus élevé et a décliné entre 2001 et 2005, une période de crise économique. A l’aide de décompositions de ces écarts, nous montrons que les différences de localisation sectorielle selon les sexes expliquent une grande part de l’écart de gains pour les deux années. L’estimation de fonctions de gains augmentées de caractéristiques des micro-entreprises des travailleurs indépendants suggère par ailleurs que l’écart de genre dans ce secteur s’explique en grande partie par une répartition inégale entre sexes des attributs des micro-entreprises, en particulier du capital physique. Ce résultat met en évidence une source potentielle de discrimination souvent ignorée dans la littérature, à savoir l’accès au capital physique par les femmes.
Mots clés: écart de genre, participation au marché du travail, allocation sectorielle, équations de gains, écart salarial de genre, Madagascar
JEL Classification: J24, J31, O12
1
This study was commissioned by the French Development Agency (AFD), under the overall guidance of Ewa Filipiak and Alexandre
Kolev. It is forthcoming in a World Bank book entitled Gender Disparities in Africa: Methods and Techniques edited by Jorge Arbache, Quentin Wodon et al. It is also part of a broader labour market work programme undertaken from the World Bank office in Madagascar, led by Stefano Paternostro (AFTH3). The authors would like to thank Jorge Arbache, Elena Bardasi, Mayra Buvinic, Ewa Filipiak, Markus Goldstein, Alexandre Kolev, David Stifel, Stefano Paternostro and an anonymous referee for helpful suggestions on first drafts of this study. The usual disclaimer applies.
Contents
1. INTRODUCTION ... 4
2. CHARACTERISTICS OF MALAGASY LABOUR MARKET ... 8
3. DATA, DEFINITIONS AND METHODS ... 9
3.1. Data and definitions ... 9
3.2. Methods ... 11
4. RESULTS ... 12
4.1. Employment status ... 12
4.1.1. Labour allocation across sectors ... 13
4.1.2. The determinants of labour allocation across sectors ... 15
4.2. Decomposing the gender earnings gap ... 17
4.2.1. Gender earnings gaps in Madagascar ... 18
4.2.2. Earnings determinants ... 20
4.2.3. Gender earnings gaps decomposition ... 24
5. SUMMARY AND CONCLUDING REMARKS ... 29
REFERENCES ... 33
APPENDICES ... 36
Appendix A Concepts and methods ... 36
Appendix B Summary statistics of the variables used in the econometric analysis ... 43
Appendix C Determinants of Sectoral Allocation ... 44
Appendix D Wage Employment Earnings Equations ... 50
Appendix E Earnings Gap Decompositions for Wage Workers ... 55
List of figures
Figure 1: Distribution of individuals aged 15 and above across all sectors of employment in Madagascar (%) ... 13Figure 2: Distribution of individuals aged 15 and above across all sectors of employment in urban and rural areas (%) ... 14
List of tables
Table 1: Selected labour market indicators in Madagascar ... 8Table 2: Monthly hours worked in Madagascar ... 18
Table 3: Gender earnings gaps (%) in Madagascar ... 19
Table 4: Full Decomposition of the Gender Wage Gap (OLS estimates) ... 27
Table B1: Summary Statistics of the variables used in the labour allocation models ... 43
Table B2: Summary Statistics of the variables used in the earnings equations ... 43
Table C1: Nature and Terms of Employment in Total Employment in Madagascar ... 44
Table C2: Nature and Terms of Employment in Total Employment in Urban Areas ... 45
Table C3: Nature and Terms of Employment in Total Employment in Rural Areas ... 46
Table C4: The Determinants of Labour allocation Across Paid Employment and Agricultural Self-Employment (Multinomial Logit Models) ... 47
Table C5: The Determinants of Labour Allocation Across Sectors for Males (Multinomial Logit Models) ... 48
Table C6: The Determinants of Labour Allocation Across Sectors for Females (Multinomial Logit Models) ... 49
Table D1: Log Hourly Earnings Equations for Wage Employment ... 50
Table D2: Log Hourly Earnings Equations for Public Wage Employment ... 51
Table D3: Log Hourly Earnings Equations for Formal Wage Employment ... 52
Table D4: Log Hourly Earnings Equations for Informal Wage Employment ... 53
Table D5: Log Hourly Earnings Equations for Non-Farm Self-Employment ... 54
Table E1: Neumark’s Decomposition of the Gender Log Hourly Earnings Gap (OLS estimates) ... 55
Table E2: Neumark’s Decomposition of the Gender Log Hourly Earnings Gap by Wage Employment Sector (OLS estimates) ... 56
Table E3: Neumark’s Decomposition of the Gender Mean Log Hourly Earnings Gap in the Non-Farm Self-Employment Sector (OLS estimates) ... 57
1. Introduction
Gender differences in terms of the labour market performances are common around the world. In the case of least developed countries, understanding the roots of inequalities between the sexes and reducing the gender gap is important since gender disparities have a potential negative impact for both broad-based growth and poverty reduction. Policies designed to reduce gender discrimination are indeed among the most often recommended solutions to reduce poverty: Goal 3 of the Millennium Development Goals (MDG) is specifically aimed at reducing gender inequalities and promotion of women empowerment is often among the aims of Poverty Reduction Strategies of many poor countries.
In developed countries, the gender wage gap has been the subject of an important area of labour economics research. More specifically, starting with the seminal methodological contributions of Oaxaca (1973) and Blinder (1973), many attempts have been made to estimate the extent to which the average gender wage gap is due to differences in human capital attributes, such as schooling and work experience, versus differences between genders in wages paid for given attributes (Blau and Kahn, 2000; Weichselbaumer and Winter-Ebmer, 2005). The part of the gender wage gap that is not explained by differences in observed endowments across genders (the unexplained portion of the gap) is often interpreted as the result of discrimination (see Appendix A for a definition).
For Africa, research on gender disparities in labour market outcomes is relatively recent and has followed similar methodological approaches. There is so far a wide consensus on the presence of important earnings inequalities between men and women, both for salaried and self-employed workers.2 For instance, in Guinea, Glick and Sahn (1997) find that differences in characteristics account for 45 percent of the male-female gap in earnings from self-employment and 25 percent of the differences in earnings from public-sector employment while, in the private sector, women actually earn more than men. Armitage and Sabot (1991) also found that such gender inequality exists in the public sector of Tanzania but observed no gender “discrimination” in Kenya's labour market. The latter result is true both for the public and private sectors of the Kenyan economy. Similarly, Glewwe (1990) found no residual gender wage gap once individual characteristics are
2
See, notably, Glewwe (1990) for Ghana; Cohen and House (1993) for Sudan; Milne and Neitzert (1994) and Agesa (1999) for Kenya; Glick and Sahn (1997) for Guinea; Lachaud (1997) for Burkina and Cameroun; Armitage and Sabot (1991) for Kenya and Tanzania; Appleton, Hoddinott and Krishnan (1999) for Uganda, Côte d'Ivoire and Ethiopia; Isemonger and Roberts (1999) for South Africa; Siphambe and Thokweng-Bakwena (2001) for Botswana; Kabubo-Mariara (2003) for Kenya; Nordman (2004) for Tunisia; Temesgen (2006) for Ethiopia; Kolev and Suarez Robles (2009) for Ethiopia; Nordman and Wolff (2009a) for Morocco; Nordman and Wolff (2009b) for Madagascar and Mauritius and Nordman and Roubaud (2009) for Madagascar.
accounted for in Ghana. On the contrary, females seem better off than males in the public sector. More recently, Siphambe and Thokweng-Bakwena (2001) show that in the public sector of Botswana most of the wage gap is due to differences in characteristics between men and women. On the other hand, in the private sector, most of the wage gap remains unexplained by workers’ endowments. Likewise, in Uganda and Côte d'Ivoire, Appleton et al. (1999) find evidence that the public sector practises less wage discrimination than the private sector. However, from their data on Côte d'Ivoire, Ethiopia and Uganda, they conclude that there is no common cross-country pattern in the relative magnitudes of the gender wage gaps in the public and private sectors.3
There is however an important specificity of African countries labour markets that makes the interpretation of the unexplained part of the gender pay gap solely by discriminatory practices against women hazardous. This specificity is the large share of the labour force that is employed in nonwage activities in these countries. Besides, religion, ethnic issues and social norms are likely to also play a non-negligible role in gender disparities in labour market outcomes.
In the Malagasy case, the deterioration of the labour market as well as the partial freeze on public sector recruitment from the mid-1980s may have accentuated the circumstances (i.e. labour market entry and exit) that could give rise to gender inequalities in the labour market. Indeed, the decrease in jobs for women in the public sector was particularly significant while this sector offered the most rewarding labour market segment (Razafindrakoto and Roubaud, 1999; Roubaud, 2002). In this context, the predominance of the informal activity for women as well as the decreasing role of the public sector in providing stable jobs may have given rise to increased poverty and consequently to significant selection effects at the formal labour market entry.
In this paper, we cast new light on these issues by using household surveys carried out in 2001 and 2005 in Madagascar. In this country, the previous studies we are aware of are those of Nicita and Razzaz (2003), Nordman and Roubaud (2009) and Nordman and Wolff (2009b, 2009c). The first authors investigate the gender wage gap in relation to an analysis of the growing potential of a particular economic sector, the textile industry. From their earnings differential decomposition, they first show that both the endowments and the unexplained part of the wage difference favour male workers, although the latter dominates the former.4Second, education and potential experience are
3
In Uganda, the authors find that the wage gaps in the public and private sector are comparable. In Ethiopia, there is a much wider gap in the private sector than in the public sector. In Côte d'Ivoire, the reverse is true.
4
In 1999, the gross unadjusted wage differential is about 51 percent in favour of males. The results of the decomposition attribute about 14 percent to differences in endowments. The unexplained part accounts for about 59 percent of the wage differential, while the remaining 27 percent is due to selectivity.
similarly important in determining the wage differential. Third, level of education and being resident in urban Antananarivo slightly reduce the unexplained part of the wage differential. However, an important limitation of their study is that, as a result of lack of information, they proxy total experience by age and include very few regressors in their wage equations by sexes. As pointed out by some authors (e.g., Weichselbaumer and Winter-Ebmer, 2005; Nordman and Roubaud, 2009), this has the consequence of greatly amplifying the unexplained share of the gender pay gap.
By contrast, using linked worker-firm data from the manufacturing sectors, thereby enabling perfect controls of the employer effects on earnings, Nordman and Wolff (2009b, 2009c) show that the magnitude of the adjusted gender wage gap is almost insignificant. Yet no general conclusion on Madagascar can be drawn from this analysis as it only concerns the formal sector of the economy whereas informal activity largely dominates the Malagasy labour market.
Nordman and Roubaud (2009) adopt a different approach by matching two original urban surveys conducted in Madagascar in 1998 – a labour force survey and a biographical survey. They build a dataset that enables them to combine the original information gathered from each survey, particularly the earnings from current employment and the workers’ entire professional trajectories. They results lead to a reassessment of the returns to human capital for both males and females. They show that using more precise labour force attachment variables greatly increases the portion of the gender gap explained by observable characteristics.
In this study, we extend the analysis of the previous authors to the entire country (rural and urban), though with more data constraints concerning the workers’ and employers’ observed characteristics, notably the lack of precise labour force attachment variables. However, the originality of our study lies in the longer time perspective of gender differences in labour market performances that is made possible by the availability of two cross-sectional household surveys (2001 and 2005). During this period, the Madagascar economy experienced several large scale shocks: in addition to recurrent weather problems, the 2002 political crisis resulted in a major disruption of economic activity due to general strikes and roadblocks on major national roads. More recently, the Madagascar economy had to face the strong depreciation of the currency and rise in international oil and rice prices in 2004 and 2005 as well as the final phase-out of the Multi-Fibre Arrangement in 2005 (Cling, Razafindrakoto and Roubaud, 2007). These shocks may have affected men and women differently and, as result, changed their relative positions on the labour market. In order to address that
question, we examine two aspects of gender differences in labour market outcomes: (i) employment status, and (ii) wages and earnings.
Our results for labour allocation show that the structure of employment has changed between 2001 and 2005. We find a strong positive impact of education on the probability of getting a paid job, for both males and females. This effect is also increasing with the education levels. For men and women alike, education has the strongest positive impact on the probability of accessing the public sector, followed by private formal wage employment and finally informal self-employment. Interestingly, education seems to be more favourable to having a self-employed job in the informal sector rather than a salaried job in this sector.
Regarding gender inequality in earnings5, the results show that the average gender wage gap (i.e. for wage workers, including farm salaried workers) is relatively small and stable over time. In non-farm self-employment, however, the gap is much higher and declined between 2001 and 2005. Earnings equations estimates indicate that human capital is an important determinant of earnings for both men and women and across sectors of employment. Decompositions of the gender wage gap show that differences in individual characteristics of men and women account for almost 70 percent of the gap in 2001. However, this share is down to less than 40 percent in 2005. When also taking into account job characteristics of men and women, differences in characteristics explain over 60 percent of the gap and the share remains stable over time. Across wage employment sectors, the gender gap appears to be the lowest in the public sector and the highest in the informal sector. Using full sectoral decomposition techniques, we also highlight that gender specific sectoral location explains a significant share of the gender wage gap in both years. This result is mainly driven by the fact that the proportion of women is higher in the self-employed sector where earnings are lower. Augmented earnings equations estimates carried out for the non-farm self-employment sector suggest that the gap in this sector is driven by the very unequal distribution of micro-firm attributes between men and women. This result points to a potential source of earnings differential often ignored in the gender earnings gap literature which is access to physical capital.
The remainder of the paper is divided as follows. Section 2 briefly presents the background of the Malagasy labour market and its main characteristics. Section 3 discusses the data, concepts and methods used in this study. In section 4 we comment on the results. Finally, in section 5, we draw together the main findings and conclude.
5
2. Characteristics of Malagasy labour market
6Workforce participation in Madagascar is high. Table 1 provides some basic labour market indicators for 2001 and 2005. These numbers show that 86.9 percent of the population report some form of productive activity in 2005, an increase of 4.4 percentage points from 2001. This growth in activity was driven by greater participation among women, with female activity rate growing from 77.7 percent to 84.6 percent, relative to male activity rate rising from 87.5 to 89.4. Open unemployment is structurally low, though it may be problematic in urban areas and is found to be higher for women than for men.
Table 1: Selected labour market indicators in Madagascar
All (%) Male (%) Female (%)
2001 2005 2001 2005 2001 2005
Activity rate 82.5 86.9 87.5 89.4 77.7 84.6
Employment ratio 81.5 84.7 86.8 87.8 76.5 81.7
Wage employment ratio 18.2 14.6 22.6 17.5 13.5 11.6
Unemployment rate 1.2 2.6 0.9 1.8 1.6 3.5
Source: Madagascar EPM 2001 & EPM 2005; authors’ calculations. Note: Individuals aged 15 and above.
Over 85 percent of workers in Madagascar were employed in nonwage activities in 2005 and this share of nonwage to total employment rose by 3.4 percentage points between 2001 and 2005. Unsurprisingly, the informal sector dominates the labour market in Madagascar. A conservative estimate places 64.5 percent of the 1.2 million wage workers in the informal sector. Considering the total workforce, including nonwage workers, approximately 95 percent of the 8.3 million working age adults are informally employed.
Despite relatively equal access to the general workforce, men have greater access to “good” jobs than women, i.e. non-agricultural wage employment. Men and women have similar nonwage agricultural earnings, but men fare better than women in terms of earnings in every other employment category. Women tend to be employed more in agriculture and the informal sector where earnings are relatively low, while men tend to have higher rates of employment in the formal sector where earnings are relatively high. Further, for those women who are employed in the formal sector and/or better wage jobs, their earnings fall below those of men in the same sectors on average.
6
See Stifel, Rakotomanana and Celada (2007) for more details on labour market conditions in Madagascar based on an analysis of EPM 2001 and 2005.
The Malagasy labour market is characterized by the coexistence of different types of employment sectors with different entry, exit, and wage setting rules. However, according to Stifel, Rakotomanana and Celada (2007), there is no evidence of labour market segmentation between the private formal and informal wage sectors. Differences in earnings between those employed in the private formal and informal sectors appear to be driven by differences in endowments, not by differences in returns to education and labour market experience. The exception is that the gap between men’s earnings (higher) and women’s earnings (lower) is larger in the informal sector than in the formal sector. However, there does appear to be some segmentation between the private and public sectors as there are higher returns to education in the latter.
3. Data, definitions and methods
In this section, we first describe the data and concepts used in this study before discussing the methodology of earnings equations and gender earnings decompositions, an essential aspect of our investigation of the gender disparities in the labour market.
3.1. Data and definitions
This study is based primarily on an analysis of the 2001 and 2005 Enquête Périodique auprès des
Ménages (EPM). The EPM are nationally representative integrated household surveys of 5,080
households (23,167 individuals) and 11,781 households (55,995 individuals) in 2001 and 2005, respectively. Our study is carried out on the sub-sample of individuals aged 15 years and older. In 2005, women represent 51.3 percent of this sample of individuals.
The multipurpose questionnaires include sections on education, health, housing, agriculture, household expenditure, assets, non-farm enterprises and employment. Employment and earnings information are available in the employment, non-farm enterprise and agriculture sections.
The choice of these databases to analyse gender disparities on the Malagasy labour market can be justified on the following grounds:
• The EPM is the only survey that provides information on labour market conditions and is representative at the national and regional level without any restriction on the type of jobs (paid or unpaid, wage or non wage), on the sectors (agricultural or not), and on the institutional sector (public or private, formal or informal).
• Another advantage of these data bases lies in their multipurpose characteristic. The fact of having access to a large set of data in different domains stemming from the same survey allows analyzing a wide range of issues within a comprehensive and coherent framework. It improves the quality of analysis carried out on determinants of labour participation such as individual characteristics (age, gender, education) and household living condition (household size and structure, consumption and wealth).
• The questionnaires in 2001 and 2005 are very similar thus allowing for a consistent analysis of the evolution of labour market indicators.
Among the 15 sections of the questionnaire, the employment section covers more specifically the supply side of the labour market with information on the main variables used in our study: employment status, sector of employment, wage labour earnings, hours worked, as well as other data on employment conditions. The section on non-farm enterprises (NFE) provides information on earnings for self-employed workers as well as some characteristics of NFEs. The other variables used in this study are derived from the section on the demographic composition of the household as well as from the section on education.
Gender differences on labour market performances will be grasped through the analysis of two types of labour market outcomes: employment status and earnings. As pointed out in Section 2, more than 85 percent of workers in Madagascar are employed in nonwage activities. Although the EPM are designed to measure both wage and non wage earnings, this latter type of earnings are typically often generated at the household level, making it difficult to analyse in relation with individual characteristics such as gender. Another issue is that non wage earnings are usually derived not only from human capital but also from physical capital. However, the data at hand does not allow separating labour from capital income. We therefore chose to estimate modified earnings equations for independent workers taking into account the value of capital.
The construction of the earnings variable was based upon the following rules:
• For wage workers, earnings data is collected at the individual level and wage earnings are defined as the sum of net wages paid, other advantages (rent, clothes, transport or gas, etc.) and food provided by the employer earned as compensation for the main activity (secondary activities are excluded from our analysis7).
7
We chose to exclude secondary wage activities from our analysis for reasons of homogeneity of our earnings measures. The gender dimension of multiple jobs holdings is left for further research.
• For self-employed workers, earnings are collected in two different sections depending on whether the self-employment activity is related to the operation of a farm or of a non-farm enterprise.
• In the case of non-farm self-employment, earnings are defined as the net income of non-farm enterprises (sales minus paid wages, non wage costs and taxes). This information is collected at the level of the firm but family members involved in the activity are listed. In the case of multiple family member participation, it is however not possible to attribute individual earnings to each member involved: the income is therefore attributed exclusively to head of the enterprise and other household members are treated as unpaid family workers.
• Since agricultural incomes cannot be assigned similarly to a single household member, these earnings are excluded from the analysis. In the participation equation agricultural self-employment is treated as a specific category.
• All earnings are divided by the number of hours worked in the corresponding activity.
Given that, as mentioned above, the two types of income (wages and earnings from self-employment) uncover different types of incomes and are measured using different rules and different parts of the questionnaire, we analyse separately gender earnings differences for wage employment (including farm salaried workers) and for non-farm self-employment.
3.2. Methods
The empirical analysis is carried out for the two years separately (2001 and 2005). We rely on three different types of approaches: First, we tackle the question of employment status and sector allocation across gender (section 4.1). After a preliminary discussion using descriptive statistics, we make use of multinomial logit models that allow disentangling the determinants of labour allocation across different institutional sectors: public employment, private formal wage employment, private informal wage employment, private informal self-employment and agricultural self-employment.8
Our analysis of gender differences then focuses on another main labour market outcome, namely earnings. Average earnings are first compared across gender. We then rely on estimations of Mincer-type earnings functions for men and women to decompose the earnings gap. The objective is to determine the extent to which the average gender wage gap is due to differences in human
8
In a previous version of this study, we analysed the determinants of hours worked in productive activities and housework production across gender. Due to important heterogeneity issues in the estimation of hours worked, we preferred to drop this section which was arguably difficult to make sense of. The related results remain available from the authors upon request.
capital attributes such as schooling and work experience, versus differences between genders in wages paid for given attributes (Blau and Kahn, 2000).
The specifications of the earnings equations and an additional discussion on sample selection issues related to paid-work participation and sector choice are reported in Appendix A. In this appendix, we also present the most common approach to identifying sources of gender earnings gaps (Oaxaca-Blinder and Neumark decompositions) together with a full sectoral decomposition that takes explicitly into account the sectoral structures between genders in the measure of the gender earnings gaps (Appleton et al., 1999).
4. Results
We examine in turn two aspects of labour market performances of men and women in 2001 and 2005: (1) employment status, (2) earnings.9
4.1. Employment status
Before turning to the determinants of employment status across sectors and sexes, we describe global statistics of labour allocation in Madagascar.
9
Summary statistics of the various variables used in these econometric analyses are reported in Table B1 and B2 in Appendix B.
4.1.1. Labour allocation across sectors
Statistics of employment status are reported in Tables C1, C2 and C3 in Appendix C. The main results are summarised in Figure 1 below.
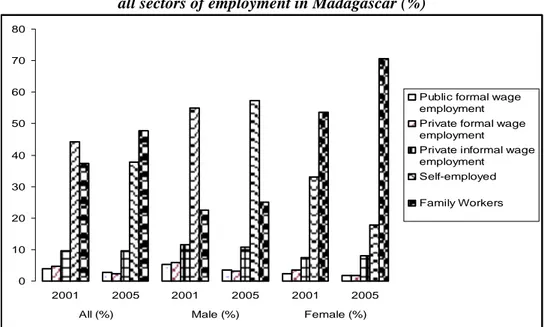
Figure 1. Distribution of individuals aged 15 and above across all sectors of employment in Madagascar (%)
0 10 20 30 40 50 60 70 80 2001 2005 2001 2005 2001 2005
All (%) Male (%) Female (%)
Public formal wage employment Private formal wage employment
Private informal wage employment
Self-employed Family Workers
Source: Madagascar EPM 2001 & EPM 2005; authors’ calculations.
Overall, the structure of employment has changed between 2001 and 2005. This is mainly due to the increase in the proportion of family workers (37.4 percent to 47.7 percent) and to the slight concomitant decrease in the share of self-employed workers (44.3 percent to 37.8 percent). This change in the structure of employment is mostly explained by the shift in women’s labour allocation whose proportion in the category of family workers has substantially increased from 53.5 percent to 70.6 percent in four years. The expansion went along with the decline in the share of women in the category of self-employed workers. In fact, according to these figures, the nature of employment differs a lot between men and women:
• Women are much more often family workers than men (70.6 percent versus 25.1 percent in 2005), and less often declare themselves as self-employed (17.8 percent versus 57.4 percent of men in 2005).
• Only 3.5 percent of women are employed in the formal sector, versus 6.7 percent of men.
The evolution in employment status can be explained in part by some of the shocks experienced by the Malagasy labour market between 2001 and 2005. More specifically, the final phase-out of the Multi-Fibre Arrangement in 2005 generated massive layoffs in the textile sector and induced self-employment in that sector to diminish.
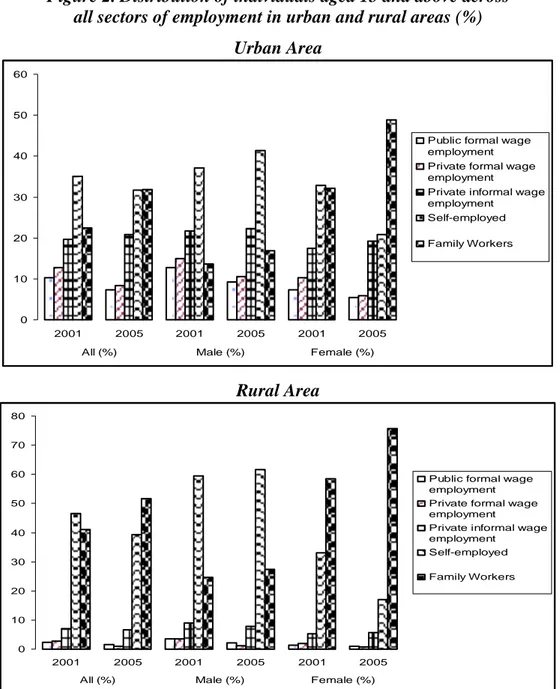
The distribution of labour greatly differs between rural and urban areas as well (Figure 2). First, private formal and informal wage workers are scarce in rural areas whilst their proportion is much higher in towns. Employment structure in rural location is thus essentially made of self-employed workers (39 percent in 2005) and family workers (51 percent in 2005). Men are much more likely to be self-employed than women in rural area (respectively 61 percent versus 17 percent in 2005) and women are found predominant in the category of family workers (75 percent versus 27 percent in 2005)10.
Figure 2. Distribution of individuals aged 15 and above across all sectors of employment in urban and rural areas (%)
Urban Area 0 10 20 30 40 50 60 2001 2005 2001 2005 2001 2005
All (%) Male (%) Female (%)
Public formal wage employment Private formal wage employment
Private informal wage employment Self-employed Family Workers Rural Area 0 10 20 30 40 50 60 70 80 2001 2005 2001 2005 2001 2005
All (%) Male (%) Female (%)
Public formal wage employment Private formal wage employment
Private informal wage employment
Self-employed Family Workers
Source: Madagascar EPM 2001 & EPM 2005; author’s calculations.
10
Additional statistics reporting the distribution of workers across activity sectors and occupations can be found in Tables C1 to C3 in Annex C.
4.1.2. The determinants of labour allocation across sectors
We now turn to discussing the determinants of labour allocation across sectors using multinomial logit models. Our estimates proceed in the following way. First, gender specific multinomial logit models of labour allocation are carried out using three broad categories: “inactive, unemployed, family worker” (thus defining a category of “unpaid” individuals in the labour market), “non-farm paid employment” (including public, private formal and informal wage employment, and non-agricultural self-employment), and “non-agricultural self-employment”. The results of these estimations are reported in Table C4 in Appendix C.
A second model refines the second modality of the preceding model (non-farm paid employment) in order to account for differentiated determinants of labour allocation, in particular for “public employment”, “private formal wage employment”, “private informal wage employment”, and “private informal self-employment”. The “agricultural self-employment” category is left unchanged. Tables C5 and C6 report the coefficient estimates of this multinomial logit model with six modalities. All the coefficients must be interpreted in relation to the reference category which is “unpaid” individuals.11
The list of covariates includes a set of human capital variables and individual demographics deemed to influence labour supply. Household characteristics are also accounted for as well as three variables reflecting physical capital endowments. These variables, namely the Log of other household members earnings per capita, the Log of the amount of land and value of livestock owned by the individual’s household, are indeed good candidates to affect both the opportunity cost of labour, and labour allocation across sectors.
From Table C4, we observe the following results. First, unsurprisingly, education has differentiated effects on the sector ‘choice’. While schooling attainment positively affects the likelihood of being in paid work for both males and females (the result being also robust to both years), the reverse is true for agricultural self-employment which is often negatively associated with higher levels of schooling, in particular for males. For women, however this negative association is actually not observed in particular for low levels of education. For instance, reaching the first cycle of secondary education is positively associated with access to self-employed agricultural employment for females in 2005.
11
We performed Hausman-type tests proposed by Hausman and McFadden (1984) which provide evidence that the Independence of Irrelevant Alternatives (IIA) assumption is not violated for both male and female samples with the exception of males in public wage employment.
Second, other human capital indicators such as potential experience in the labour market and past vocational training are positively associated with access to paid employment (with a decreasing marginal effect for experience). Experience in the labour market is also positively related to agricultural self-employment for males and females as compared to unpaid individuals. Nonetheless, vocational training is significantly negatively associated with a job in agriculture for males in both years.
The marital status (married versus single or divorced or widow) presents an interesting pattern. For men, being married is associated with a greater likelihood of having access to a farm and non farm paid employment, whatever the considered sector. The reverse is observed for women whose marriage appears to be negatively associated to access to a paid job.
Finally, the additional household and property (land and livestock) variables are always highly significant. The variable indicating the sum of other household members’ earnings is positively associated with the probability of having access to paid employment. Conversely, its effect is always negative on the ‘choice’ of an agricultural self-employed job. A possible explanation for these findings is that this variable is capturing an income effect of the household, i.e. reflecting the fact that workers in wealthier households are mostly found in non farm paid employment rather than in agricultural self-employment. Similarly, the opposite – and expected – effect is found for the land value variable: the higher the land value owned, the higher the probability of having a self-employed agricultural job. Interestingly, the magnitude of this effect is stronger for males than for females, especially in 2005. The same comment can be made as for the variable of livestock value in 2001 which exhibits positive coefficients for self-agricultural jobs and negative coefficients for paid jobs. However, the coefficient shifts sign for females in 2005 indicating a negative association between the value of the livestock and the probability to have a self-employed job in agriculture. In the meantime, the coefficient loses significance for self-employed agricultural males. This could reflect the improvement in the profitability of cropping activities that could have resulted in a shift away from cattle.
We now turn to more detailed estimates reported in Tables C5 (males) and C6 (females). For men and women alike, education has the strongest positive impact on the probability of accessing the public sector, followed by private formal wage employment and finally informal self-employment. This finding is robust to both years considered. Interestingly, then, education seems to be more favourable to having a self-employed job in the informal sector rather than a salaried job in this
sector. This is may be reflective of the fact that schooling is necessary to acquire managerial skills, even in informal activities. Note that the main difference across sexes is that education has a much stronger impact for females, especially in the formal sector of the economy, and that schooling is negatively associated with an informal wage employment in 2001 for women whereas, for men, the impact is insignificant.
The other human capital variables (vocational training, experience) exhibit expected signs (positive and concave profile for experience), with the exception of vocational training in agricultural self-employment where it is insignificant for females and even found to have a negative effect for men. Concerning marital status being married is again positively associated to being in paid employment for men, and negatively for women.
Finally, other household members’ earnings are significantly and positively associated to having a wage employment while this variable is negatively related to self-employed jobs. This result is robust to both years and sexes (with the exception of females’ informal self-employment). Also, the effect of the land value owned is consistent with expectation and across years and sexes: its effect is significantly negative for non-agricultural jobs and positive for agricultural self-employment. The same comment can be made for the livestock value, with the exception that its effect is not systematically positive for self-employed agricultural jobs in 2005 (notably, significantly negative for females).
We now turn to explaining workers’ earnings in their jobs, thus disentangling the various determinants of earnings differentials across sectors and sexes.
4.2. Decomposing the gender earnings gap
Before turning to the gender earnings gaps decompositions, it is necessary to discuss simple descriptive statistics of the gender earnings gap across years. This is followed by an analysis of the determinants of earnings for wage and non wage employment (excluding agriculture) across gender and for the two years of the survey. We then comment on the results of the various gender earnings gap decompositions.
4.2.1. Gender earnings gaps in Madagascar
Both monthly and hourly gender earnings gaps are reported. Taking into account the hours worked by gender is important if one wants a proper view of the gender pay gap as there also exist important gender-specific time allocation choices. This is apparent in Table 2 that shows that men work on average longer wage hours than women. This holds true across wage employment sectors. Concerning non-farm self-employment, individuals appear to be working longer hours than in other sectors and the gender difference is smaller.12
Table 2: Monthly hours worked in Madagascar
2001 2005
Males Females Males Females Wage Employment
Full sample (15+) 185.9 162.7 198.2 168.1
Public formal wage employment 170.3 146.9 181.5 151.9
Private formal wage employment 189.9 179.8 218.1 197.2
Private informal wage employment 191.0 159.1 198.2 165.6
Non-Farm Self-employment
Full sample (15+) 230.0 213.3 203.3 187.2
Source: Madagascar EPM 2001 & EPM 2005; authors’ calculations.
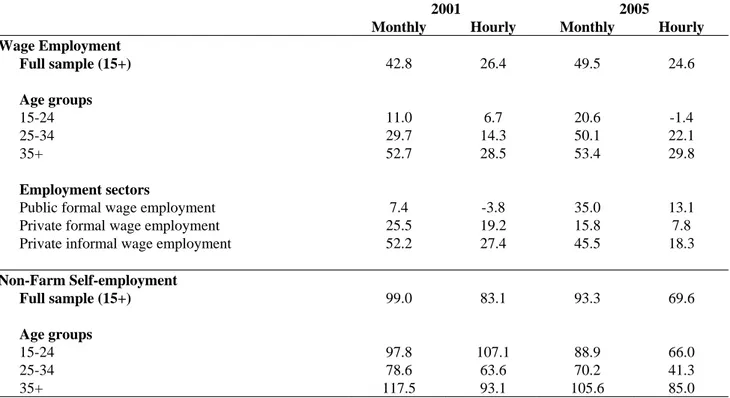
Earnings gaps are here computed as the difference in average earnings of men and women expressed as a percentage of average men earnings13. Figures from Table 3 indicate that, for wage employment, the aggregate monthly earnings gap increased from 42.8 percent to 49.5 percent between 2001 and 2005, while the aggregate hourly earnings gap decreased slightly. The lower hourly earnings gap is coherent with the fact that men work longer hours in the wage and non-farm self-employment sector. Moreover, the concomitant increase in the monthly earnings gap and decrease in hourly earnings gap between the two years is reflective of the fact that the gender gap in hours worked increased between 2001 and 2005 in the formal sectors and in the non-farm self-employment sector (Table 2). More specifically, the growth in hours worked has been greater for men in all sectors but the informal wage sector.
12
Data on housework hours collected in the 2005 survey indicate that, on total, women work much more hours than men: 38.8 weekly hours on average versus 18.9 for men. In previous analysis (not shown but available upon request), we disentangle the determinants of housework hours across gender. We find that being married strongly affects the number of hours worked at home for both males and females, but with an opposite effect. Married men work less hours at home whereas the reverse is true for married women. This result is robust across urban and rural areas. Another interesting pattern is revealed by the coefficient estimates on the number of children at different ages. While the number of young children (below 5) does not seem to affect men’s labour intensity at home, it does so positively for women, as we could expect. The reverse pattern is observed, however, when we consider children aged 5 to 14. Then, men’s hours of housework are sensitive (negatively) to the number of their children, while those of women are not.
13
In the decomposition techniques that follow, the gap is defined instead as the difference in log earnings of men and women. This difference is identical to the coefficient of a female dummy in a regression of log earnings carried out over a pooled sample of wage workers with no other control variables.
Table 3: Gender earnings gaps (%) in Madagascar
2001 2005
Monthly Hourly Monthly Hourly
Wage Employment Full sample (15+) 42.8 26.4 49.5 24.6 Age groups 15-24 11.0 6.7 20.6 -1.4 25-34 29.7 14.3 50.1 22.1 35+ 52.7 28.5 53.4 29.8 Employment sectors
Public formal wage employment 7.4 -3.8 35.0 13.1
Private formal wage employment 25.5 19.2 15.8 7.8
Private informal wage employment 52.2 27.4 45.5 18.3
Non-Farm Self-employment Full sample (15+) 99.0 83.1 93.3 69.6 Age groups 15-24 97.8 107.1 88.9 66.0 25-34 78.6 63.6 70.2 41.3 35+ 117.5 93.1 105.6 85.0
Source: Madagascar EPM 2001 & EPM 2005; authors’ calculations.
Note: Gaps are computedas the difference in average earnings of men and women expressed as a percentage of average men earnings.
Although lower than the monthly earnings gap, the gender gap in hourly earnings is still significant in Madagascar. It was equal to 26.4 percent (resp. 24.6 percent) in 2001 (resp. 2005) for wage employment and to 83 percent (resp. 69 percent) in 2001 (resp. 2005) for non-farm self-employment.
Data from Table 3 also suggest that the earnings gap varies across cohorts: it is higher for older workers than for younger ones. In 2005, the hourly earnings gap is actually slightly negative (i.e. to the advantage of females) for the 15-24 cohort.
Finally, the size of the gap differs across wage sectors. For both years, it is highest in the informal wage sector. In 2001, it is smaller in the public sector and actually negative when one accounts for hours worked. In 2005, the smallest gap is in the private formal sector. For non-farm self-employed workers, the gap appears much higher but slightly decreased between the two years.
Whether these gaps are due to differences in endowments between males and females (the “explained” share of the gap) or to differences in returns to endowments (the “unexplained” portion of the gap, which may be attributed in part to discrimination) is an empirical question that is
addressed using the decomposition techniques presented in Appendix A. These techniques rely on the estimation of earnings equations which are presented in the following section.
4.2.2. Earnings determinants
In order to eliminate the effect of the number of hours worked on earnings, hourly earnings are used to analyse gender differences.14 Earnings equations are estimated separately for men and for women over the sample of individuals with positive earnings.
Wage Employment
The sample of wage workers includes all wage workers and excludes self-employed workers, unpaid family workers as well as agricultural workers. The sample contains 1,845 men and 1,089 women in 2001 and includes 2,390 men and 1,474 women in 2005. Table D1 in Appendix D reports Ordinary Least Squared (OLS) as well as selectivity corrected earnings equations for 2001 and 2005. Selection into labour force participation is accounted for using the methods advocated in Appendix A, Section A2.
Let us first discuss the question of selection before turning to the main results. As indicated by the coefficients on the selection correction terms (Mill’s ratios) in the Heckman versions of the different models15, selection into labour force participation does not appear to be an issue here: the correction terms are never significantly different from zero for men and for women for both years. In other words, the mechanism of allocation between the two groups (individuals for which individual earnings can be computed versus other individuals) does not affect earnings significantly. As a result, the different coefficients on the human capital variables are only marginally modified from OLS to Heckman equations. We then focus our comments on the OLS estimates.
Table D1 shows evidence of significant and positive returns to human capital variables for both sexes and years. The coefficients on the three education dummies highlight an increasing premium to schooling attainment in reference to the category of workers with no schooling or incomplete primary education. There are some differences across gender and years though. First, in 2001, education returns are always larger for men than for women, in particular at low and high levels of
14
Although monthly earnings are frequently used in this type of analysis, it may be problematic when the number of worked hours per month varies significantly across sexes, as is the case here, and if variations in hours reflect discriminatory practices and/or individual choices. Using hourly earnings is a way to avoid this problem and is equivalent to comparing gross wage rate across individuals, i.e. referring to the same quantity of work.
15
schooling attainment. This pattern holds true in 2005 except that education of female workers having achieved the first cycle of secondary schooling is given more value than that of their male counterparts. The experience-earnings profile is found to be slightly concave for both men and women (i.e. increasing, but less and less as workers age), with slightly greater returns for men in 2001. In 2005, the reverse pattern for experience is observed however, with greater return for women. This difference between 2001 and 2005 may in part reflect the increased labour market participation of women over this period (see Section 2) which may have accrued the market value of experience of those women already working relative to new entrants. Indeed, a strong increase of inexperienced workers in the labour market has presumably the consequence of enhancing the average returns to experience.
Among the other regressors introduced in the earnings functions, vocational training received in schools appears to be an important determinant of earnings for both males and females. Training is indeed likely to increase workers’ productivity. For this reason, Weichselbaumer and Winter-Ebmer (2005) have shown that omitting it in wage equations by gender can result in serious biases in the calculation of the unexplained component of the gender wage gap.16 The fact of being married affects positively the earnings of men in 2005 only while it has no impact on earnings elsewhere. On developed country data, marriage is usually found to have a positive impact on earnings, at least for men (Korenman and Neumark, 1991). However, the insignificant impact of marriage for females is also an expected result when one uses such cross-sectional dataset (Korenman and Neumark, 1992).17
We also present earnings equations estimated for each of the three wage employment sectors using both OLS and Lee’s method to correct for sectoral selection (Tables D2 to D4 in Appendix D). A first result worth noting is that correcting for selectivity into the public sector is significant for males only (Table D2), while sectoral selection does not appear to affect the distribution of earnings in the two other wage employment sectors (private formal and informal). The only exception is for females in the informal wage sector in 2005 (Table D4). The significant negative effect of the selection term in this equation means that females’ unobserved characteristics that positively affect
16
However, as other human capital variables, training is not immune from the common criticism that it might be the result of individual choices and hence be correlated with individual ability.
17
Economic theories of fertility and marriage suggest that marital status and number of children may be endogenous with respect to wages: women may be selected or may self-select into different marital or fertility states on the basis of unmeasured characteristics that are correlated with wages. Then, individual heterogeneity may lead to biased estimates of the "direct" effects of marriage and motherhood on wages. Therefore, one should be careful in inferring any causal relationship between marriage, motherhood and wages with such cross-sectional dataset.
their probability to participate in the informal wage sector in 2005 also influence their earnings levels, but negatively.
In the public sector, once sectoral selection is accounted for, the returns to education are almost null for both males and females. This may be the result of high entry costs into the public sector where earnings differentials have no direct relation with educational attainment. In other words, earnings in this sector are probably determined by a number of factors orthogonal to productive ability, so that the returns to education have a different interpretation in this sector than in the private ones18. Still, we rely on the OLS estimates in the following analysis (decompositions) given that sample selection does not appear to be an issue for females, and so as to preserve perfect comparability across the other sectors of the analysis where selection appears mostly insignificant.
Turning to the OLS estimates in the formal public and private sector, returns to education are higher for men in 2001, while the reverse is true in 2005, which is consistent with the previous finding using aggregate equations. In the informal wage sector, returns are greater for men in both years, especially at low and high levels of educational attainment.
Non-Farm Self-Employment
For the non farm self-employed (Table D5), the specification of the earnings equations is slightly different. Indeed, there are many other aspects deemed to influence self-employed workers’earnings other than their demographic characteristics and human capital endowments. We believe it is important to account for the micro-firm attributes as they arguably constitute crucial determinants of the dispersion of earnings in self-employment. For that purpose we include two variables: the first one indicates the eventual number of employees in the informal production unit while the second is a measure of the value of physical capital used in the workers’ activity.19 Two comments are in order.
First, the two measures of the micro-firm attributes are highly significant and exert a positive effect on the self-employed earnings differentials. This is an expected effect as they act as production factors in the earnings determination. Interestingly enough, we observe greater micro-firm attribute returns for men in 2001 and higher micro-firm attribute returns for women in 2005.
18
Alternatively, we cannot exclude the possibility that our model in the public sector is poorly identified due to the difficulty of finding valid identifying instruments for the sectoral selection (see Appendix A, Section A2 for details). 19
Other potential sources of earnings differentials across self-employed workers have been introduced in the regressions (such as access to credit or the rate of salaried workers in the informal production unit) and failed to provide meaningful results.
Second, returns to self-employed workers’ education are significant and positive even after taking account of the micro-firm effects on earnings. However, returns are systematically higher for women in 2001 while, in 2005, they are higher for men at the intermediate level of schooling.
To summarize, our results on earnings determination across gender point to a number of stylized facts:
Not surprisingly, human capital variables, particularly education, are strong predictors of earnings for both men and women and across years.
This holds true across sectors of activity. In particular, returns to education are high in the non-farm self-employment sector, notably for higher levels of education and for women in both years.
However, returns vary markedly across sectors and years and no clear sectoral or dynamic pattern emerges from our data.
In line with similar work on Africa using different data sources (e.g. Söderbom et al., 2006; Kuepie et al., 2009; Nordman and Wolff, 2009a, 2009b), our results suggest that marginal returns to education are non-constant with a convex profile, i.e. increasing with the level of education.20
The experience-earnings profile is found to be slightly concave for wage employment for both men and women, with somewhat greater returns for men in 2001, while the reverse is observed in 2005.
Earnings functions for non-farm self-employed workers provide evidence that the quantity of labour and the amount of physical capital used in their activity are important determinants of their earnings. We find greater returns to these production factors for men in 2001, while a reverse pattern to the advantage of women is observed in 2005.
The results presented in this section are interesting in that they highlight gender-specific earnings determination processes. In particular, these estimates point to possible explanations of the differences in the earnings levels of men and women. As mentioned previously, the gender gap may be due to differences in the rewards for human capital attributes, but also to differences in average human capital characteristics across gender. The earnings equation analysis conducted above indicates that returns to attributes differ between genders but is unable to provide a synthetic
20
This result is obtained by replacing the dummy variables indicating educational level achievements by a continuous variable for years of education as well as a quadratic term (years of education squared). We find that the sign of the quadratic term is positive, an indication of a convex profile of returns to education.
decomposition of these different effects. This decomposition will be carried out in the following section.
4.2.3. Gender earnings gaps decomposition
Gender earnings gap decompositions are presented in turn for wage and non wage employment based on the OLS earnings equations estimates presented in the previous section.
Wage Employment
Table E1 in Appendix E reports the decomposition of the gender gap for wage earnings in 2001 and 2005 respectively based on OLS estimations of the earnings equations. Indeed, given that sample selection did not appear to be a major issue in the previous section, the OLS estimations were preferred.21 Two specifications are considered for the earnings equations. The first specification corresponds to the specification presented in the previous section where explanatory variables are limited to human capital endowments (education, experience and training), socio-demographics (marital status, ethnic group, religion) and geographical dummies indicating place of residence. In the second specification, variables describing job characteristics are added. They include dummies characterizing the type of occupation (executive, skilled or unskilled worker) and the nature of employment (permanent or temporary). Since it is debatable whether job characteristics such as occupations should be taken into account in earnings equations, we choose to introduce them in a separate decomposition. Indeed, controlling for occupations in earnings equations by sex amounts to considering the possibility of occupational segregation across gender and, for instance, the existence of high-paying occupations for men and low-paying occupations for women. The difficulty, however, is to establish whether these occupational outcomes are the result of discrimination practices from the employer or of gender-specific occupational choices.
In 2001, differences in socio-demographic characteristics, human capital endowments and geographical location explain 68.6 percent of the raw hourly earnings gap using Neumark’s decomposition rule. Human capital endowments explain up to 51.3 percent. Among human capital variables, it is the difference in educational attainment that explains most of the gap (about 30 percent). This result stems from the fact that education returns are positive and that men have on
21
A similar rationale for this choice is given by Appleton et al. (1999) in their paper analysing the gender gap in three African countries. They state “[We focus (…) on uncorrected estimates] partly for comparability with existing studies but also because of methodological controversies surrounding the selectivity corrections.”
average more education than women. The distribution of experience and training between genders also contributes positively to explaining the earnings gap but at a much lower level than education.
Surprisingly, including job characteristics such as occupation and terms of employment actually leads to a small decrease of the explained share of the gap from 68.6 percent to 66.5 percent using Neumark’s decomposition. As pointed out earlier, it is unclear whether the employment status is an outcome of employer practice or an outcome of individual choice and productivity differences. In other words, the share explained by job characteristics could be at least in part attributable to occupational segregation.
In 2005, the decomposition varies according to the specification of the earnings equation. Not taking into account occupations, the explained share of the gap amounts to 37.5 percent. This is an important decrease compared to the same decomposition computed for 2001 where the explained share of the gap attains 68.6 percent. This fall in the explained share is principally explained by the significant decrease in the explanatory power of human capital variables in 2005, in particular education and professional experience. These two variables explain indeed respectively only 11.2 percent and 9.9 percent of the gender earnings gap in 2005 whereas the respective proportions are 30.1 percent and 13.7 percent in 2001.
Introducing job characteristics increases the explained share up to 61.7 percent in 2001, a figure similar to the figure obtained for 2001. Among other observables, job characteristics explain 41.2 percent of the gap, hence much more than in 2001 where this proportion is only 23.8 percent.
The other significant contribution to explaining the earnings gap comes from the distribution of human capital endowments: the gender difference in endowments contributes to 14.9 percent of the gap. However, among human capital variables, education no longer is the main contributor.
By sector of wage employment
The Malagasy labour market is characterized by the coexistence of different types of wage employment sectors with different entry, exit, and wage setting rules. As noted earlier, the hourly gender gap appears negative (i.e. in favour of women) in the public sector in 2001 and relatively high in the informal wage employment sector for both years. Several results emerge from the decomposition of earnings by sector and for each surveyed year (Table E2 in Appendix E).
First, in any given wage employment sector, the gap is lower than the average gap over all wage employment sectors (except for informal wage employment in 2001), a possible indication of non-random gender allocation between wage employment sectors.
Second, the share of explained gap varies across sectors and years. In particular, looking at the decompositions without job characteristics, the patterns are somewhat different across the two years, especially for the formal sectors. For instance, while human capital endowments positively explain the gender gap in 2001 in the public sector, the pattern is reversed in 2005 as the contribution of human capital to the gender gap shifts sign and becomes negative. In other words, women have more favourable human capital characteristics in 2005 than in 2001 in the public sector (on average, women in the public sector are actually more educated than men in 2005). As for the informal wage sector, the explained share of the gap falls dramatically between the two years. This fall in the explained share probably reveals a greater heterogeneity in earnings and/or greater unobserved heterogeneity among the sample of workers in this sector in 2005. This result may of course be interpreted in light of the several shocks endured by the labour market between 2002 and 2005, a period where the explanatory power of traditional human capital attributes as determinants of earnings has declined. Third, job characteristics contribute positively to explaining the gap in most sectors and the explained share of the gaps generally increases with the inclusion of job characteristics in the earnings equations. The only exceptions are the informal wage sector in 2001 where job characteristics add nothing to the explanation of the gap and, more importantly, the formal wage sector in 2005 where the explained portion actually decreases from 43.7 to 21.0 percent once occupations and terms of employment are accounted for. This finding is somewhat difficult to explain and may be due to the fact that occupational distribution across gender is already partly the result of differences in educational attainment, therefore possibly creating colinearity issues in the earnings equations which include both human capital and job characteristics. The reader should then put more confidence into the decompositions that do not include job characteristics, especially where the results are difficult to interpret.
Full decomposition
As mentioned in the previous section, the fact that the gap in any given wage employment sector is usually lower than the aggregate gap suggests that gender location between sectors is not random. That of course is expected since observable characteristics determine sectoral allocation. For instance, more educated individuals tend to work in formal sectors, and this characteristic is not distributed evenly between genders. However, this gender specific sectoral location can possibly
also be the result of different effects of observable characteristics on sectoral location, a reflection either of choice or discrimination. In order to examine the contribution of different sectoral structures between men and women in Madagascar, we apply to our data sets a full decomposition approach developed by Appleton, Hoddinott and Krishnan (1999).
Table 4: Full Decomposition of the Gender Wage Gap (OLS estimates)
2001 % 2005 %
Raw wage gap 0.232 100 0.220 100
Difference due to within-sector differences in earnings attributable to:
A. Characteristics 0.090 38.7 0.020 8.9
B. Deviation in male returns 0.029 12.5 0.051 23.0
C. Deviation in female returns 0.047 20.4 0.074 33.8
Sub-total 0.166 71.6 0.145 65.7
Difference due to differences between sectoral location attributable to:
D. Characteristics 0.079 34.1 0.069 31.2
E. Deviation in effect of characteristics on male location -0.004 -1.9 0.002 1.1 F. Deviation in effect of characteristics on female location -0.009 -3.9 0.005 2.0
Sub-total 0.066 28.3 0.076 34.3
Source: Madagascar EPM 2001 & EPM 2005; authors’ calculations.
As explained in Appendix A (section A.3.2), the first three terms of this full decomposition (A, B and C) are similar to those found in the decompositions discussed previously (Neumark’s) and account for the within-sector earnings gaps. The last three terms (D, E and F) measure the difference in earnings due to differences in distribution of male and female workers in the different sectors. More precisely, the last two terms account for differences in earnings resulting from the deviations between predicted and actual sectoral compositions of men and women not accounted for by differences in characteristics.
Results from Table 4 indicate that within-sector differences in earnings contribute to 71.6 percent of the gender gap in 2001. In 2005, this share is smaller but still represents 65.7 percent of the gap. Differences in characteristics account for more than half of that share in 2001, but only to 15 percent in 2005. Given that the “non discriminatory” wage structure is estimated on the pooled sample of males and females, it is possible to compare the “distance” between this non discriminatory wage structure and the returns to individual characteristics for men on one hand (this term is interpreted as “nepotism”22), and the distance between this non discriminatory wage structure and returns to individual characteristics for women (the so-called “pure discrimination”) on the other hand. Our results suggest that both “nepotism” and “pure discrimination”, using the
22
Neumark (1988) refers to “nepotism” as this deviation in returns represents the distance between actual males’ returns and lower returns that would be associated with competitive wages (the non-discriminatory benchmark of the pooled sample). See Appendix A, section A.3.1 for more details.
terminology of Neumark (1988, see Appendix A, Section A.4.1), contribute to the unexplained component of the gap with however a bigger share explained by the latter: the contribution of the deviation in females’ return (C) to the unexplained share of the gender gap appears indeed higher than the contribution of the deviation in males’ return (B).
Results also show however that gender specific sectoral location explains a significant share of the gender-earnings gap in both years. This is highlighted by the positive sums of the last three terms (D+E+F) for both years which suggest that thedifferences in sectoral locations are more favourable to men than to women. The genderearnings gap would have been 28.3 percent and 34.3 percent smaller, respectively for 2001 and 2005, if men and women had been “equally”distributed across the three sectors. These results are driven by the fact that the proportion of women is higher in both years in the informal wage employment sector where earnings are lower. Moreover, the increase in the sectoral location effect between the two years (from 28 to 34 percent) is reflective of the greater proportion of women in the lower paying wage sector in 2005 compared to 2001 (67 percent versus 59 percent of female wage workers).
Finally, the decomposition of the contribution of the sectoral location further indicates that characteristics explain an important part of sectoral location both in 2001 and in 2005. In other words, our results suggest that sectoral location differences are mostly attributable to differences in characteristics and not to difference in returns. This is apparent in the very small values of terms E and F in Table 4. On the contrary, differences in returns accounts for an important share of the difference in within-sector earnings both through “nepotism” (B) and “discrimination” (C). This stylized fact holds true across years although the unexplained share of gap (B+C) appears to have increased between 2001 and 2005
Non-Farm Self-Employment
As noted above, the gender gap in the non-farm self-employment sector is much higher than in wage employment sectors in both years. This stems in part from the way earnings from self-employment are computed since income of nonfarm enterprises was attributed entirely to the head of the enterprise. Male owned enterprises are likely to have at least one additional worker (the wife of the firm owner) than female owned enterprise. Indeed, descriptive statistics confirm that micro-firms owned by women are on average much smaller than those owned by men. In what follows, we take into account these differences in the decomposition of the earnings gap by including firm characteristics as determinants of the earnings equations.