Monitoring Health Inequalities in France:
A Short Tool for Routine Health Survey to Account
for Lifelong Adverse Experiences
Emmanuelle Cambois (Ined)
Florence Jusot (Université Paris-Dauphine, Leda-Legos, Ined, Irdes)
Mars 2010
DT n° 30
No copying allowed in other websites, but direct link to the document is authorized:
l Director of publication: Yann Bourgueil l Scientific adviser: Thierry Debrand
Monitoring Health Inequalities in France:
A Short Tool for Routine Health Survey to
Account for Lifelong Adverse Experiences
Emmanuelle Cambois
a* and Florence Jusot
bAbstract
Conventional health surveys focus on current health and social context but rarely address past experiences of hardship or exclusion. However, recent research shows how such experiences contribute to health status and social inequalities.
In order to analyse in routine statistics the impact of lifelong adverse experiences (LAE) on various health indicators, a new set of questions on financial difficulties, housing difficulties due to financial hardship and isolation was introduced in the 2004 French National health, health care and insurance survey (ESPS 2004). Logistic regressions were used to analyze associations between LAE, current socioeconomic status (SES) (education, occupation, income) and health (self-perceived health, activity limitation, chronic morbidity), on a sample of 4308 men and women aged 35 years and older.
In our population, LAE were reported by 1 person out of 5. Although more frequent in low SES groups, they concerned above 10% of the highest incomes. For both sexes, LAE are significantly linked to poor self-perceived health, diseases and activity limitations, even controlling for SES (OR>2) and even in the highest income group. This pattern remains significant for LAE experienced only during childhood.
The questions successfully identified in a conventional survey people exposed to health problems in relation to past experiences. LAE contribute to the social health gradient and explain variability within social groups. These questions will be useful to monitor health inequalities, for instance by further analyzing LAE related health determinants such as risk factors, exposition and care use.
Keywords: Health inequalities; Lifelong adverse experiences; Health surveys. JEL codes: I12; I32.
a Institut national d’études démographiques (Ined). b Université Paris-Dauphine (Leda-Legos) / Ined, Irdes.
* Corresponding author: Emmanuelle Cambois, 133 Boulevard Davout 75980 Paris cedex 20, France
Résumé
Les enquêtes santé usuelles renseignent l’état de santé et le statut socio-économique actuels des individus mais ne permettent que rarement d’aborder les expériences passées de précarité ou d’exclusion. Des recherches récentes montrent pourtant l’impact de ce type d’expérience sur l’état de santé et qui expliquent en partie les inégalités sociales. En 2004, de nouvelles questions ont été incluses dans l’Enquête sur la santé et la protection sociale (ESPS) afin d’étudier l’influence sur l’état de santé de plusieurs types d’expériences difficiles vécues au cours de la vie : difficultés financières, difficultés de logement dues à des problèmes financiers, période d’isolement. Les régressions logistiques sont utilisées pour analyser les associations entre ces expériences difficiles vécues au cours de la vie, le statut socio-économique actuel (éducation, occupation, revenu) et l’état de santé (santé perçue, limitation d’activité et maladie chronique) pour un échantillon de 4 308 hommes et femmes âgées de 35 ans et plus.
Dans cette population, une personne sur cinq déclare avoir connu au cours de sa vie au moins l’une des experiences considérées. Même si les personnes appartenant aux groupes sociaux les plus défavorisés sont plus fréquemment concernées, 10 % des personnes appartenant au plus haut quintile de revenu le sont également. Chez les hommes comme chez les femmes, la déclaration d’expériences difficiles passées est associée à une plus mauvaise santé, quel que soit l’indicateur de santé utilisé, y compris après contrôle par le statut socio-économique actuel. Enfin, les résultats restent très similaires lorsque l’on ne considère que les expériences difficiles vécues pendant l’enfance.
Ces questions permettent donc d’identifier avec succès dans une enquête traditionnelle des personnes vulnérables en termes de santé en raison d’expériences difficiles passées. Ces expériences difficiles vécues au cours de la vie contribuent non seulement à expliquer les inégalités de santé entre groupes sociaux mais également les inégalités de santé au sein de chaque groupe. Ces questions constituent donc un bon instrument de surveillance des inégalités de santé, par exemple à travers l’analyse des comportements de santé et du recours aux soins en lien avec ces expériences.
Mots-Clefs : inégalités de santé ; expériences difficiles au cours du cycle de vie ;
enquêtes santé.
1.
Introduction
In France, social inequalities in mortality are large and persistent over time 1-3. Education,
occupation and income, which reflect current social and material context, are predictors of mortality and are significantly associated with the risk of diseases or disability 4-7.
However, life course epidemiology points out that not only the current socioeconomic status but also past trajectories are linked to health. The accumulation of exposure to risk factors over the life course (childhood deprivation, damaging work conditions, etc.) and their impact at critical periods of life and health construction contribute to health deterioration 8-14.
Regarding the impact of social context during childhood, studies show clear associations with mortality risk and specific causes of death such as stomach cancer 10, 15. The
childhood context is significantly linked to various health problems in later life such as chronic diseases, psychological and psychosocial problems 16-19 and in France with poor
functional health, poor self-assessed health status or obesity 20-22. The health impact
of childhood circumstances is explained by specific early life factors has to do with material deprivation but also stress and conflict on a child 23, or isolation, social support
and attachment 24, 25.
In later life, adverse experiences such as hardship, downward occupational mobility or family disruptions are also significantly associated with poor health or high mortality risks 26-29. In France, mortality is associated with occupational careers or experience of
isolation 30-33.
Such adverse experiences can lead to social marginalization and can contribute, together with the current context of hardship and deprivation, to a higher health risk for groups of the population considered as excluded. For Shaw and colleagues, social exclusion “refers not only to the economic hardship of relative economic poverty but also incorporates the notion of the process of marginalization” 34. The triggers of a
marginalization process, such as job loss, migration, isolation or conflict could indeed be health damaging through a disruption in social networks, habits and support. Research in the field of exclusion and health in France has shown that the poor health status of specific groups such as homeless people or free-care center users, can be explained by the lack of material resources, poor living conditions, inadequate access to health care and health-damaging behaviors but also may be due to psychosocial factors such as lack of emotional and social support, poor self-esteem and life control 35-37. For these groups
of people, the combination of current material deprivation, psychosocial disadvantage and past experiences of disruptions and failures that led to exclusion might explain their poor health. Moreover whilst these circumstances may be only temporary, having undergone them over the life course might still be health damaging.
Therefore, lifelong adverse experiences, leading or not to exclusion, can increase health risks beyond the current social context. They are important social factors to be considered in monitoring population health, but routine statistics lack accurate tools. The link between adverse experiences and health is generally analyzed through ad-hoc surveys or cohorts, which are not fully representative of the general population and are usually not repeated, preventing time trends analysis. When population based surveys incorporate information on past experiences, collected through biographic tools, they have limited data on health outcomes. Finally, biographic tools are generally too large to be included on a regular basis in population health surveys.
In this study, we have explored the feasibility of identifying lifelong adverse experiences in conventional health surveys with a simple and short tool in order to provide more regular general information on this topic to complement specific studies. This would be a relevant tool to document variations in health exposure and behaviors and explain the health and mortality social gradients. The issue is to identify experiences over the life course rather than concentrating on the current situation while regular survey samples tend to exclude people currently experiencing them (not living in households, hard to reach, not willing to participate etc.). Indeed, we consider that most of the adverse experiences are temporary and do not systematically result in permanent social exclusion. In 2004, a short set of questions on lifelong adverse experiences (LAE) was introduced in a population health survey in France. The questions relate to selected situations of material and social difficulties that might have occurred during the whole life. This study explores how these LAE questions are reported in the general population, how they are associated with current social situation and impact on health and finally how they can bring new insights in the analysis of social health inequalities.
2.
Methods
2.1. The National Health, Health Care and Insurance Survey
The National Health, Health Care and Insurance Survey is a biannual health interview survey coordinated by the Institute for Research and Information on Health Economics (IRDES), with a sample based on an ongoing random sample of French major health insurances’ beneficiaries (covering over 95% of the household community). In 2004, about 40% of households sampled could not be reached (mostly due to incomplete or wrong addresses); 70% of the contacted households agreed to participate 38. Initially,
households are contacted by telephone to obtain a key respondent to answer the core questionnaire eliciting the demographics of the household members and a selection of questions including, in the 2004 wave, the set of questions on lifelong adverse experiences (LAE). As a second step, a self-completion health questionnaire is sent to each household member for return by mail. In 2004, 75% of the initial sample returned the questionnaire.
2.2. Lifelong adverse experiences
LAE were assessed through three questions aimed at identifying lifetime experiences of deprivation and hardship in a general population. We adapted existing questions on financial deprivation but which had focused only on recent experiences of financial difficulties or housing difficulties. An additional question was included to elicit social disruption through experiences of isolation. The question wording was as follows: Has the person ever, during his/her life, 1) “experienced serious financial difficulties so that he/she could not meet basic needs or that he/she did not cope with these difficulties”; 2) “needed to move in with relatives or friends or to move into sheltered housing as a result of financial difficulties”; 3) “experienced a long term period of isolation following an event such as a breakup, conflict or a move to another area or country”. In order to assess the long term impact of LAE, for the last two questions, individuals were asked whether these experiences had occurred during childhood only, during adulthood only or both (financial difficulties might be less obvious to children and therefore less reliably reported as childhood experience by the surveyed persons).
2.3. Health indicators
We used the Eurostat Minimum European Health Module 39 incorporated to this survey
and which contains three questions: chronic morbidity (“Do you have any chronic or long-lasting illness or health problem?”); self-perceived health (“How is your health in general?”); long term activity limitations (“Because of health problems, to what extent have you been limited, for at least 6 months, in activities people usually do?”). They cover complementary health dimensions which reflect potential need for care. Three binary indicators were built based on the three questions: reporting chronic illness vs no
to the others, reporting being limited vs not limited, and reporting to have fair to very
poor health vs good or a very good.
2.4. Indicators of current social status
To control for current socioeconomic status (SES), three indicators were used: education, income and occupation. Income was measured as household income, whatever the source, divided by the OECD equivalence scale (1 for the first household member, 0.5 for the second one, and 0.3 for the additional ones). Five quintiles were defined and an additional category was added corresponding to missing information (approximately 12%). We considered four educational levels and the occupational status was measured by current occupation, or the previous occupation for those retired or unemployed. We used the French professional and social status classification: Highly qualified occupations (professionals, managers, and intellectual professions); Skilled white-collar workers (nurses, elementary school teachers, technicians…); Farm owners; Other self-employed (trade and craft business owner); Trade and craft clerks; Clerical employees; Skilled manual workers; Unskilled manual workers and farm workers; Inactive (other than retired).
2.5. Statistical method
In order to explore the long-lasting influence of LAE on health status, we used a series of logistic regression models, with adjustment for age, to assess:
a) the association between LAE and each SES indicator (income, occupation, educationseparately (model 1) and in the presence of the others (model 2), b) the association between each health indicator of the LAE and SES, considered
separately (model 3) and together (model 4),
c) the association between each health indicator and the period in which the LAE occurred (model 5 and 6).
Men and women were analyzed separately due to the gender specific association between the usual SES indicators and health or mortality 30, 40.
The LAE are based on self-reported retrospective information, and therefore respondents may be more likely to report LAE that have resulted in diseases or activity limitations and to omit others, and it is difficult to test for such bias. Furthermore, respondents currently experiencing health problems and poor psychological well-being, and/or material and emotional difficulties, may be more likely to “darken” their past (reconstruction phenomena) 24. To control this, we ran additional models integrating
variables for current emotional well-being and psychological distress and see if a LAE effect remains. We used survey variables corresponding to “self-reported symptoms of depression” and/or “reported intake of psychotropic medication” in a self-reported medication intake classified a posteriori by physician.
3.
Results
3.1. Frequency of LAE and current SES
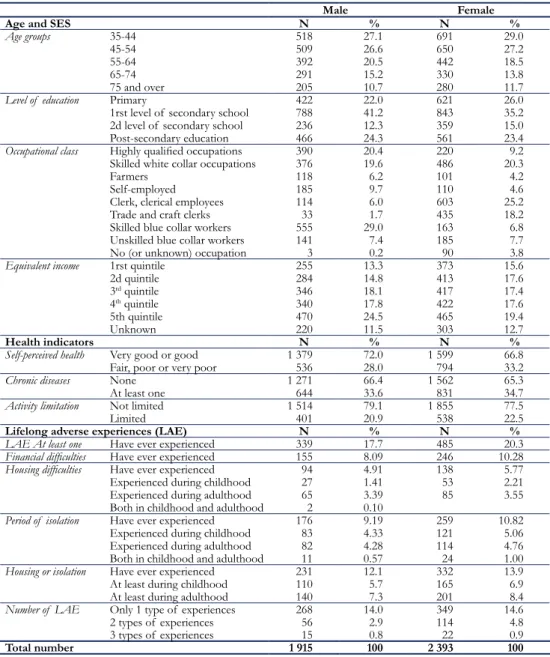
This study is based on 1915 men and 2393 women, aged 35 and over who responded to both the background and health questions. Table 1 provides the distribution of the sample according to the SES status, LEA and health indicators.
Table 1: Descriptive analysis of the study Sample (2004 ESPS survey)
Male Female
Age and SES N % N %
Age groups 35-44 518 27.1 691 29.0
45-54 509 26.6 650 27.2
55-64 392 20.5 442 18.5
65-74 291 15.2 330 13.8
75 and over 205 10.7 280 11.7
Level of education Primary 422 22.0 621 26.0
1rst level of secondary school 788 41.2 843 35.2
2d level of secondary school 236 12.3 359 15.0
Post-secondary education 466 24.3 561 23.4
Occupational class Highly qualified occupations 390 20.4 220 9.2
Skilled white collar occupations 376 19.6 486 20.3
Farmers 118 6.2 101 4.2
Self-employed 185 9.7 110 4.6
Clerk, clerical employees 114 6.0 603 25.2
Trade and craft clerks 33 1.7 435 18.2
Skilled blue collar workers 555 29.0 163 6.8
Unskilled blue collar workers 141 7.4 185 7.7
No (or unknown) occupation 3 0.2 90 3.8
Equivalent income 1rst quintile 255 13.3 373 15.6
2d quintile 284 14.8 413 17.6 3rd quintile 346 18.1 417 17.4 4th quintile 340 17.8 422 17.6 5th quintile 470 24.5 465 19.4 Unknown 220 11.5 303 12.7 Health indicators N % N %
Self-perceived health Very good or good 1 379 72.0 1 599 66.8
Fair, poor or very poor 536 28.0 794 33.2
Chronic diseases None 1 271 66.4 1 562 65.3
At least one 644 33.6 831 34.7
Activity limitation Not limited 1 514 79.1 1 855 77.5
Limited 401 20.9 538 22.5
Lifelong adverse experiences (LAE) N % N %
LAE At least one Have ever experienced 339 17.7 485 20.3
Financial difficulties Have ever experienced 155 8.09 246 10.28
Housing difficulties Have ever experienced 94 4.91 138 5.77
Experienced during childhood 27 1.41 53 2.21
Experienced during adulthood 65 3.39 85 3.55
Both in childhood and adulthood 2 0.10
Period of isolation Have ever experienced 176 9.19 259 10.82
Experienced during childhood 83 4.33 121 5.06
Experienced during adulthood 82 4.28 114 4.76
Both in childhood and adulthood 11 0.57 24 1.00
Housing or isolation Have ever experienced 231 12.1 332 13.9
At least during childhood 110 5.7 165 6.9
At least during adulthood 140 7.3 201 8.4
Number of LAE Only 1 type of experiences 268 14.0 349 14.6
2 types of experiences 56 2.9 114 4.8
3 types of experiences 15 0.8 22 0.9
Total number 1 915 100 2 393 100
In our sample, 20% of women and 18% of men reported one or more LAE, being in majority a long term period of isolation and financial difficulties. One third of those who reported housing difficulties and/or isolation experienced them in childhood only. Adverse experiences in both childhood and adulthood were scarce. LAE were reported in all SES groups with a decreasing gradient with increasing social advantage, for instance income. Farmers reported less LAE than the other occupational groups. Women were more likely to report LAE than men, except for farmers, self-employed and clerks. After controlling for age (model 1), LAE remained strongly associated with current SES (Table 2). Once age and the other SES indicators were controlled for (model 2), only income remained strongly associated with LAE. Farmers is the only occupation remained with remaining significant relationship while much of the association with education disappeared.
Table 2: Odds ratios of lifelong adverse experiences (LAE) associated with the level of education, occupation and income. Men and women aged 35 years and over
Male Female
Model 1 Model 2 Model 1 Model 2
Post-secondary education 1.0 1.0 1.0 1.0
2d level of secondary school 1.5 [1.0-2.3] 1.2 [0.8-2.0] 1.2 [0.8-1.6] 1.0 [0.7-1.4]
1rst level of secondary school 1.7 [1.2-2.3] 1.1 [0.7-1.6] 1.4 [1.1-1.9] 1.0 [0.7-1.5]
Primary education 2.2 [1.5-3.2] 1.3 [0.8-2.1] 2.3 [1.6-3.1] 1.5 [0.9-2.3]
Highly qualified occupations 1.0 1.0 1.0 1.0
Skilled white collar occupations 1.2 [0.8-1.9] 1.0 [0.7-1.6] 0.9 [0.6-1.4] 0.8 [0.5-1.3]
Farmers 0.7 [0.3-1.4] 0.4 [0.2-0.8] 0.4 [0.2-1.0] 0.2 [0.1-0.4]
Self-employed 1.8 [1.2-2.9] 1.4 [0.8-2.3] 1.2 [0.7-2.3] 0.8 [0.4-1.5]
Clerk, clerical employees 1.5 [0.9-2.7] 1.0 [0.6-1.9] 1.3 [0.9-2.0] 0.9 [0.6-1.5]
Trade and craft clerks 2.7 [1.2-6.1] 1.8 [0.7-4.2] 1.7 [1.1-2.6] 0.9 [0.6-1.6]
Skilled blue collar workers 2.1 [1.5-3.0] 1.4 [0.9-2.2] 1.3 [0.8-2.2] 0.7 [0.4-1.4]
Unskilled blue collar workers 2.1 [1.3-3.4] 1.1 [0.6-2.0] 2.1 [1.3-3.4] 1.0 [0.6-1.8]
No (or unknown) occupation * * 3.0 [1.7-5.4] 1.4 [0.7-2.8]
5th income quintile 1.0 1.0 1.0 1.0 4th income quintile 1.3 [0.8-2.0] 1.2 [0.7-1.8] 1.1 [0.8-1.6] 1.1 [0.7-1.6] 3rd income quintile 2.0 [1.4-3.0] 1.8 [1.2-2.8] 1.6 [1.1-2.3] 1.4 [1.0-2.1] 2d income quintile 2.4 [1.6-3.6] 2.1 [1.4-3.4] 1.9 [1.3-2.7] 1.7 [1.1-2.5] 1rst income quintile 3.2 [2.2-4.8] 3.1 [2.0-4.9] 4.0 [2.9-5.7] 3.8 [2.6-5.6] Unknown income 2.0 [1.3-3.2] 1.9 [1.2-3.0] 1.4 [0.9-2.1] 1.3 [0.9-2.0]
* Less than 10 individuals (excluded from the model).
Model 1: Univariate logistic regression, adjusted on age only.
Model 2: Multivariate logistic regression, adjusted on age and all variables of model 1.
3.2. Health and LAE
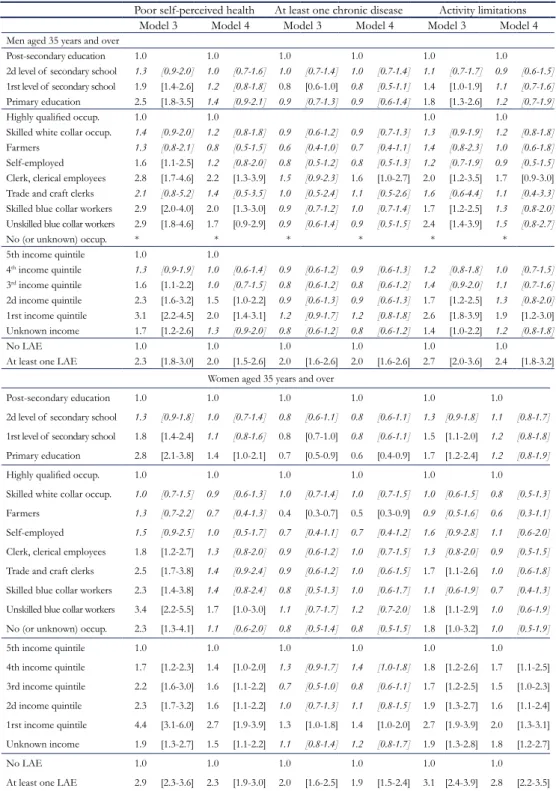
In our study population, 34% of men and women reported chronic disease or health problems, 28% of men and 33% of women reported fair-to-poor self-perceived health and 21% of men and 22% of women reported long term activity limitations (Table 1). Model 3 shows that LAE were significantly associated with poor self-perceived health, activity limitations and chronic disease for both men and women, with a more than doubling of the odds ratios compared to those who did not report LAE (Tables 3). In the multivariate model (model 4), reporting LAE remained strongly associated with deteriorated health for both sexes and for each health indicator, with only a slight attenuation of the odds ratios compared to model 3.
More detailed analysis (available upon request) showed that each of the three types of LAE contributed to the overall association with health (borderline significant effects for perceived health and chronic disease for men). We also found an interaction between LAE and income and repeating the models for those in the highest income quintile only, we found that LAE still impacted significantly on poor perceived health and chronic diseases after controlling for age, education and occupation (the odds ratio for long term activity limitation was only significant with a 10% confidence interval). Finally, incorporating indicators of current psychological distress led to a slight (not significant) reduction in the link between LAE and health, suggesting this may contribute to the association.
Table 3: Odds ratios of poor health associated with education, occupation, income and lifelong adverse experiences (LAE). Men and women aged 35 years and over
Poor self-perceived health At least one chronic disease Activity limitations
Model 3 Model 4 Model 3 Model 4 Model 3 Model 4
Men aged 35 years and over
Post-secondary education 1.0 1.0 1.0 1.0 1.0 1.0 2d level of secondary school 1.3 [0.9-2.0] 1.0 [0.7-1.6] 1.0 [0.7-1.4] 1.0 [0.7-1.4] 1.1 [0.7-1.7] 0.9 [0.6-1.5] 1rst level of secondary school 1.9 [1.4-2.6] 1.2 [0.8-1.8] 0.8 [0.6-1.0] 0.8 [0.5-1.1] 1.4 [1.0-1.9] 1.1 [0.7-1.6] Primary education 2.5 [1.8-3.5] 1.4 [0.9-2.1] 0.9 [0.7-1.3] 0.9 [0.6-1.4] 1.8 [1.3-2.6] 1.2 [0.7-1.9]
Highly qualified occup. 1.0 1.0 1.0 1.0
Skilled white collar occup. 1.4 [0.9-2.0] 1.2 [0.8-1.8] 0.9 [0.6-1.2] 0.9 [0.7-1.3] 1.3 [0.9-1.9] 1.2 [0.8-1.8] Farmers 1.3 [0.8-2.1] 0.8 [0.5-1.5] 0.6 [0.4-1.0] 0.7 [0.4-1.1] 1.4 [0.8-2.3] 1.0 [0.6-1.8] Self-employed 1.6 [1.1-2.5] 1.2 [0.8-2.0] 0.8 [0.5-1.2] 0.8 [0.5-1.3] 1.2 [0.7-1.9] 0.9 [0.5-1.5] Clerk, clerical employees 2.8 [1.7-4.6] 2.2 [1.3-3.9] 1.5 [0.9-2.3] 1.6 [1.0-2.7] 2.0 [1.2-3.5] 1.7 [0.9-3.0] Trade and craft clerks 2.1 [0.8-5.2] 1.4 [0.5-3.5] 1.0 [0.5-2.4] 1.1 [0.5-2.6] 1.6 [0.6-4.4] 1.1 [0.4-3.3] Skilled blue collar workers 2.9 [2.0-4.0] 2.0 [1.3-3.0] 0.9 [0.7-1.2] 1.0 [0.7-1.4] 1.7 [1.2-2.5] 1.3 [0.8-2.0] Unskilled blue collar workers 2.9 [1.8-4.6] 1.7 [0.9-2.9] 0.9 [0.6-1.4] 0.9 [0.5-1.5] 2.4 [1.4-3.9] 1.5 [0.8-2.7]
No (or unknown) occup. * * * * * *
5th income quintile 1.0 1.0 4th income quintile 1.3 [0.9-1.9] 1.0 [0.6-1.4] 0.9 [0.6-1.2] 0.9 [0.6-1.3] 1.2 [0.8-1.8] 1.0 [0.7-1.5] 3rd income quintile 1.6 [1.1-2.2] 1.0 [0.7-1.5] 0.8 [0.6-1.2] 0.8 [0.6-1.2] 1.4 [0.9-2.0] 1.1 [0.7-1.6] 2d income quintile 2.3 [1.6-3.2] 1.5 [1.0-2.2] 0.9 [0.6-1.3] 0.9 [0.6-1.3] 1.7 [1.2-2.5] 1.3 [0.8-2.0] 1rst income quintile 3.1 [2.2-4.5] 2.0 [1.4-3.1] 1.2 [0.9-1.7] 1.2 [0.8-1.8] 2.6 [1.8-3.9] 1.9 [1.2-3.0] Unknown income 1.7 [1.2-2.6] 1.3 [0.9-2.0] 0.8 [0.6-1.2] 0.8 [0.6-1.2] 1.4 [1.0-2.2] 1.2 [0.8-1.8] No LAE 1.0 1.0 1.0 1.0 1.0 1.0
At least one LAE 2.3 [1.8-3.0] 2.0 [1.5-2.6] 2.0 [1.6-2.6] 2.0 [1.6-2.6] 2.7 [2.0-3.6] 2.4 [1.8-3.2] Women aged 35 years and over
Post-secondary education 1.0 1.0 1.0 1.0 1.0 1.0 2d level of secondary school 1.3 [0.9-1.8] 1.0 [0.7-1.4] 0.8 [0.6-1.1] 0.8 [0.6-1.1] 1.3 [0.9-1.8] 1.1 [0.8-1.7] 1rst level of secondary school 1.8 [1.4-2.4] 1.1 [0.8-1.6] 0.8 [0.7-1.0] 0.8 [0.6-1.1] 1.5 [1.1-2.0] 1.2 [0.8-1.8] Primary education 2.8 [2.1-3.8] 1.4 [1.0-2.1] 0.7 [0.5-0.9] 0.6 [0.4-0.9] 1.7 [1.2-2.4] 1.2 [0.8-1.9] Highly qualified occup. 1.0 1.0 1.0 1.0 1.0 1.0 Skilled white collar occup. 1.0 [0.7-1.5] 0.9 [0.6-1.3] 1.0 [0.7-1.4] 1.0 [0.7-1.5] 1.0 [0.6-1.5] 0.8 [0.5-1.3] Farmers 1.3 [0.7-2.2] 0.7 [0.4-1.3] 0.4 [0.3-0.7] 0.5 [0.3-0.9] 0.9 [0.5-1.6] 0.6 [0.3-1.1] Self-employed 1.5 [0.9-2.5] 1.0 [0.5-1.7] 0.7 [0.4-1.1] 0.7 [0.4-1.2] 1.6 [0.9-2.8] 1.1 [0.6-2.0] Clerk, clerical employees 1.8 [1.2-2.7] 1.3 [0.8-2.0] 0.9 [0.6-1.2] 1.0 [0.7-1.5] 1.3 [0.8-2.0] 0.9 [0.5-1.5] Trade and craft clerks 2.5 [1.7-3.8] 1.4 [0.9-2.4] 0.9 [0.6-1.2] 1.0 [0.6-1.5] 1.7 [1.1-2.6] 1.0 [0.6-1.8] Skilled blue collar workers 2.3 [1.4-3.8] 1.4 [0.8-2.4] 0.8 [0.5-1.3] 1.0 [0.6-1.7] 1.1 [0.6-1.9] 0.7 [0.4-1.3] Unskilled blue collar workers 3.4 [2.2-5.5] 1.7 [1.0-3.0] 1.1 [0.7-1.7] 1.2 [0.7-2.0] 1.8 [1.1-2.9] 1.0 [0.6-1.9] No (or unknown) occup. 2.3 [1.3-4.1] 1.1 [0.6-2.0] 0.8 [0.5-1.4] 0.8 [0.5-1.5] 1.8 [1.0-3.2] 1.0 [0.5-1.9] 5th income quintile 1.0 1.0 1.0 1.0 1.0 1.0 4th income quintile 1.7 [1.2-2.3] 1.4 [1.0-2.0] 1.3 [0.9-1.7] 1.4 [1.0-1.8] 1.8 [1.2-2.6] 1.7 [1.1-2.5] 3rd income quintile 2.2 [1.6-3.0] 1.6 [1.1-2.2] 0.7 [0.5-1.0] 0.8 [0.6-1.1] 1.7 [1.2-2.5] 1.5 [1.0-2.3] 2d income quintile 2.3 [1.7-3.2] 1.6 [1.1-2.2] 1.0 [0.7-1.3] 1.1 [0.8-1.5] 1.9 [1.3-2.7] 1.6 [1.1-2.4] 1rst income quintile 4.4 [3.1-6.0] 2.7 [1.9-3.9] 1.3 [1.0-1.8] 1.4 [1.0-2.0] 2.7 [1.9-3.9] 2.0 [1.3-3.1] Unknown income 1.9 [1.3-2.7] 1.5 [1.1-2.2] 1.1 [0.8-1.4] 1.2 [0.8-1.7] 1.9 [1.3-2.8] 1.8 [1.2-2.7] No LAE 1.0 1.0 1.0 1.0 1.0 1.0
At least one LAE 2.9 [2.3-3.6] 2.3 [1.9-3.0] 2.0 [1.6-2.5] 1.9 [1.5-2.4] 3.1 [2.4-3.9] 2.8 [2.2-3.5]
*Less than 10 individuals (excluded from the model)
Model 3: Univariate logistic regression, adjusted on age only
Models 5 and 6 provided evidence of the long-lasting influence of LAE (Table 4): after controlling for age and current social status, LAE occurring during childhood only were still significantly associated with the risk of poor self-perceived health, chronic diseases and activity limitations.
Table 4: Odds ratios of poor health associated with the period of housing difficulties or long period of isolation.
Men and women aged 35 years and over
Poor self-perceived health At least one chronic
disease Activity limitations Model 5 Model 6 Model 5 Model 6 Model 5 Model 6
Men aged 35 years and over
None of the LAE 1.0 1.0 1.0 1.0 1.0 1.0
in childhood only 2.4 [1.5-3.8] 2.3 [1.5-3.7] 1.9 [1.2-3.0] 2.0 [1.3-3.1] 2.4 [1.5-3.9] 2.4 [1.5-3.9] in adulthood only 1.6 [1.1-2.5] 1.4 [0.9-2.2] 1.7 [1.2-2.6] 1.7 [1.1-2.6] 2.3 [1.5-3.6] 2.1 [1.4-3.3] in childhood and adulthood 16 [5.1-53] 15 [4.5-51] 6.1 [2.2-17] 6.0 [2.1-17] 8.1 [3.0-22] 6.7 [2.4-19]
Women aged 35 years and over
None of the LAE 1.0 1.0 1.0 1.0 1.0 1.0
in childhood only 2.4 [1.6-3.5] 2.3 [1.6-3.4] 2.0 [1.4-2.9] 1.9 [1.3-2.8] 2.1 [1.4-3.1] 2.0 [1.3-3.0] in adulthood only 2.2 [1.5-3.0] 1.7 [1.2-2.5] 1.9 [1.3-2.6] 1.8 [1.3-2.6] 3.4 [2.4-4.8] 3.0 [2.1-4.3] in childhood and adulthood 7.1 [3.3-15] 6.1 [2.8-13] 3.4 [1.7-6.8] 3.3 [1.6-6.9] 6.1 [3.0-13] 5.9 [2.9-12]
Model 3: Univariate logistic regression, adjusted on age only.
Model 4: Multivariate logistic regression, adjusted on age and all variables of model 3.
4.
Discussion
This study demonstrates that adverse experiences throughout lifetime (LAE) can be captured using a short and simple tool in a routine health population survey, and that up to 20% of the population reported them. Our results showed that, although more frequent in the most disadvantaged groups, LAE were reported by a significant proportion of men and women in all social groups. We found evidence of a strong and long-lasting association between LAE and deteriorated health for a number of health dimension and that differences remained significant after controlling for current socioeconomic status.
Although 20% reporting LAE seems high, it appears to be consistent with estimates from the late 1990’s for France 41. The LAE questions proved to be specific, targeting
a relevant group with increased risk of deteriorated health. Furthermore, this 20% may even be an underestimate due to the survey methodology. First, since it is a household survey, as most conventional population health surveys, conducted on a selected population who could be contacted and agreed to participate, it misses those who currently experience adverse circumstances, specifically people not living in a household, and those who could not respond due to health problems. Second, the study sample excludes persons who did not return the health questionnaire, which may be related to health and/or social status and LAE. However, as we had collected the background questionnaire, we could test the magnitude of the bias related to non-responses to the health questionnaire by considering that they were 1) all in poor health status, 2) all in good health status. Neither of these scenarios significantly changed our conclusions:
the effect of LAE on health was slightly increased with the “missing in good health” assumption and decreased with the “missing in poor health” assumption.
Our questions may also overestimate LAE related health risks due to their retrospective nature and the possible a posteriori reconstruction effect. We did not find significant change
in our results by incorporating information on current psychological distress. However, it is not possible to disentangle to what extent LAE actually induced psychological distress and poor health or whether current psychological distress and health problems increased the propensity to report LAE24. Only a longitudinal approach could help clarify this point
and since part of the ESPS survey is followed up and re-interviewed, we will have the opportunity of further testing this issue looking at the incidence of health problems rather than the prevalence.
Despite these limitations, LAE successfully identified a specific group exposed to health risks due various possible determinant: deleterious effect of economic hardship11, 12, 24, 42, stressful events11, 13, 14, job loss33, disruption or
isola-tion25, 27, 29, 32. The increased health risks may also be explained by a reverse causation
process: long term health problems may have been responsible for adverse experiences such as job loss43, decreasing earnings44, isolation, family breakups etc.
The contribution of life events to socioeconomic inequalities in health has been discussed in prior research45. Our results show that the association between LAE and
health remains strongly significant after adjustment for current social situations. Being much more frequent in lower social groups, LAE is a risk factor that contributes to the social health gradient. Nevertheless, this life time social factor has impact above and beyond the current socioeconomic situation. LAE in the highest income group also increased the probability of reported diseases and bad perceived health. Therefore, even when LAE did not prevent people attaining the highest income group, they are still at an increased risk of ill health. However, this is not true with respect to activity limitation which is not significantly higher for those reporting LAE in the highest income group. Interestingly, studies on disability show unequal risks of activity limitation due to differentiated mobilization of resources and accurate compensation strategies (assistive devices, workplace or home adaptation etc.)46. This finding suggests that a favorable
social status does not offset the health impact of such LAE but might help managing health problems and limiting their consequences in terms of disability. Analysis of health care consumption and behaviors would shed the light on this issue.
The recent report of the World Health Organization’s Commission on the Social Determinants of Health presents a wealth of evidence identifying social determinants as the most important determinants of health47. It makes three broad sets of recommendations
that taken together would help to ‘close the gap’ in various health inequities by: (1) improving daily living conditions – housing, early child development, health care, and social protection; (2) tackling the unequal distribution of resources; and (3) measuring and understanding the problem. While life course epidemiology pleads for lifelong experiences to be included not only in ad-hoc studies but in routine health statistics, our study shows the feasibility of this, using a short set of questions. It allows identification of the population at risk for poor health outcomes above and beyond the usual socioeconomic indicators.
There are few studies in France which permit the study of past experiences and health based on cohorts or population surveys using biographic tool. This is even more scarce that such a topic is studied in a routine population health survey exploring several health dimensions and many other health related variables. The results encourage us to go
further and analyze time trends and the LAE related determinants (exposition, use of care, risk factors) in order to explain the social health gradient as well as variability within social groups. This should contribute to better monitoring of lifelong social factors, health inequalities and lead to policies to reduce them.
Keypoints
We explore the feasibility of accounting for lifelong adverse experiences (LAE) as health determinant in a conventional health survey
.
We analyse a short set of LAE questions included in a French population health survey in 2004.
The LAE questions successfully identified a 20% adult group with an increased risks of poor health, whatever their current social situation.
The LAE short set will be helpful for public health to monitor health inequalities through regular analysis of LAE related health factors (risk factors, use of care…).
Acknowledgements
We are very grateful to Myriam Khlat and to Carol Jagger for their helpful comments and suggestions on previous versions of that pape.
References
1 Saurel-Cubizolles M-J., Chastang J-F., Menvielle G., Leclerc A., Luce D. (2009). Social Inequalities in Mortality by Cause Among Men and Women in France. Journal of epidemiology and community health; 63(3):197-202.
2. Leclerc A., Chastang J-F., Menvielle G., Luce D. (2006). Socioeconomic Inequalities in Premature Mortality in France: Have they Widened in Recent Decades? Social Science and medicine (1982); 62(8): 2035-45.
3. Cambois E. (2004). Occupational and Educational Mortality Differentials: Magnitude and Trends over Last Decades. Demographic Research(2): 278-304.
4. Cambois E., Robine J-M., Hayward M. (2001). Social Inequalities in Disability-Free Life Expectancy in the French Male Population (1980-1991). Demography;
38(4): 513-24.
5. Mackenbach JP., Stirbu I., Roskam A-J., et al. (2008). Socioeconomic Inequalities in
Health in 22 European Countries. The New England Journal of Medicine;
358(23): 2468-81.
6. Leclerc A., Kaminski M., Lang T. (2008). Inégaux face à la santé. Du constat à l’action. Paris : Inserm/La découverte.
7. Jusot F. (2006). The Shape of the Relationship Between Mortality and Income in France». Annales d’Economie et de Statistique (special issue «Health - Insurance- Equity»); 83-84: 89-122.
8. Kuh DLJ., Ben Sholmo Y. (1997). A Life Course Approach to Chronic Disease Epidemiology Oxford: Oxford University Press.
9. Davey Smith G., Hart C., Watt G., Hole D., Hawthorne V. (1997). Life Time in Socio-Economic Position and Mortality: Prospective Observational Study. British Medical Journal; 314: 247-452.
10. Hayward MD., Gorman BK. (2004). The Long Arm of Childhood: the Influence of Early-Life Social Conditions on Men’s Mortality. Demography; 41(1): 87-107.
11. Kahn JR., Pearlin LI. (2006). Financial Strain over the Life Course and Health Among Older Adults. Journal Health and Social Behavior; 47(1): 17-31.
12. McDonough P., Berglund P. (2003). Histories of Poverty and Self-Rated Health Trajectories. Journal of Health and Social Behavior; 44(2): 198-214.
13. Lantz PM., House JS., Mero RP. Williams DR. (2005). Stress, Life Events, and Socioeconomic Disparities in Health: Results from the Americans’ Changing Lives Study. Journal Health and Social Behavior; 46(3): 274-88.
14. Pearlin LI., Schieman S., Fazio EM., Meersman SC. (2005). Stress, Health, and the Life Course: Some Conceptual Perspectives. Journal Health and Social Behavior;
46(2): 205-19.
15. Elo I., Preston S. (1992). Effects of Early Life Conditions on Adult Mortality. A Review Population Index; 58: 186-212.
16. Blackwell MD., Hayward M., Crimmins E. (2001). Does Childhood Health Affect Chronic Morbidity in Later Life?.» Social Science and Medicine; 52: 1269-84.
17. Gilman S., Kawachi I., Fitzmaurice G., Buka S. (2002). Socioeconomic Status in Childhood and the Lifetime Risk of Major Depression. International Journal of Epidemiology;
31(2):359-67.
18. Gliksman MD., Kawaschi I., Hunter D., Colditz GA., Manson JAE., Stampfer MJ. (1995). Childhood Socioeconomic Status and Risk of Cardiovascular Disease in Middle aged US women: a prospective study. Journal of Epidemiology and Community Health; 49: 10-5.
19. Richards M., Hardy R., Kuh D., Wadsworth M. (2002). Birthweight, Postnatal Growth and Cognitive Function in a National UK Birth Cohort. International Journal of Epidemiology; 31(2): 342-8.
20. Trannoy A., Tubeuf S., Jusot F., Devaux M. (2008). Inequality in Opportunities in Health in France: A first pass. Health Economics In Press;DOI. 10.1002/hec.1528.
21. Khlat M., Jusot F., Ville I. (2009). Social Origins, Early Hardship and Obesity: a Strong Association in Women, but not in Men? Social Science and Medicine (1982).
22. Melchior M., Lert F., Martin M., Ville I. (2006). Socioeconomic Position in Childhood and in Adulthood and Functional Limitations in Midlife: Data from a Nationally- Representative Survey of French Men and Women. Social Science and Medicine
(1982); 63(11): 2813-24.
23. Montgomery SM., Bartley MJ., Wilkinson R. (1997). Family Conflict and Slow Growth. Arch Dis Child; 77: 326-30.
24. Stansfeld S., Head J., Bartley M., Fonagy P. (2008). Social Position, Early Deprivation and the Development of Attachment. Social psychiatry and psychiatric Epidemiology;
43(7): 516-26.
25. Caspi A., Harrington H., Moffitt TE., Milne BJ., Poulton R. (2006). Socially Isolated Children 20 Years Later: Risk of Cardiovascular Disease. Archives of Pediatrics and Adolescent Medicine; 160(8): 805-11.
26. Moore DE., Hayward MD. (1990). Occupational Careers and Mortality of Elderly Men.
Demography; 27: 31-53.
27. Zhang Z., Hayward MD. (2006). Gender, the Marital Life Course, and Cardiovascular Disease in Late Midlife. Journal of Marriage and Family; 68(3): 639-57.
28. Bartley M., Plewis I. (2002). Accumulated Labour Market Disadvantage and Limiting Long-term Illness: data from the 1971-1991 Office for National Statistics’ Longitudinal Study. International Journal of Epidemiology; 31: 336-41.
29. Hughes ME., Waite LJ. (2009). Marital Biography and Health at Mid-Life. Journal Health Social Behavior; 50(3): 344-58.
30. Cambois E. (2004). Careers and Mortality: Evidences on How far Occupational Mobility Predicts Differentiated Risks. Social Science and Medicine; 58: 2545–58.
31. Melchior M., Berkman LF., Kawachi I., et al. (2006). Lifelong Socioeconomic
Trajectory and Premature Mortality (35-65 years) in France: Findings from the GAZEL Cohort Study. Journal of Epidemiology and Community Health; 60(11): 937-44.
32. Berkman LF., Melchior M., Chastang JF. Niedhammer I., Leclerc A., Goldberg M. (2004). Social Integration and Mortality: a Prospective Study of French Employees of Electricity of France-Gas of France: the GAZEL Cohort. American Journal of Epidemiology; 159(2): 167-74.
33. Saurel-Cubizolles MJ., Bardot F., Berneron B., et al. (2001). Etat de santé perçu et perte
d’emploi. In: al Ce, ed. Travail, santé, vieillissement : relations et évolutions colloque des 18 et 19 novembre 1999, Paris Toulouse: Octarès; 53-68.
34. Shaw M., Dorling D., Davey Smith G. (1999). Poverty, Social Exclusion, and Minorities. In: Marmot M., Wilkinson RG., eds. Social Determinants of Health Oxford: Oxford University Press; 211-39.
35. Kovess V., Mangin-Lazarus C. (1999). The Prevalence of Psychiatric Disorders and Use of Care by Homeless People in Paris. Soc Psychiatry Psychiartr Epidemiol;
34: 580-7.
36. Parizot I., Chauvin P. (2003). The Access to Care of Underserved Populations: a Research Among Free Clinics Patients in the Paris Area. Revue d’Epidémiologie et de santé publique; 51(6): 577-88.
37. Pascal J., Abbey-Huguenin H., Leux C., Lombrail P., Lert F. (2009). Social Vulnerability and Unmet Preventive Care Needs in Outpatients of Two French Public Hospitals.
38. Allonier C., Dourgnon P., Rochereau T. (2006). L’Enquête Santé protection sociale 2004, un outil d’analyse pluridisciplinaire de l’accès aux soins, de la couverture maladie et de l’état de santé des Français. Questions d’Economie de la Santé;105:1-4.
39. Cox B., Van Oyen H., Cambois E., et al. (2009). The reliability of the Minimum European
Health Module. International Journal of Public Health; (54): 55-60.
40. Arber S. (1997). Comparing Inequalities in Women’s and Men’s Health: Britain in the 1990s. Social Science and Medicine; 44(6): 773-87.
41. Haut Comité de la Santé Publique.(1998). La progression de la précarité en France et ses effets sur la santé. Paris: La Documentation Française.
42. McDonough P., Duncan GJ., Williams D., House J. (1997). Income Dynamics and Adult Mortality in the United States, 1972 Through 1989. American journal of public health; 87(9): 1476-83.
43. Jusot F., Khlat M., Rochereau T, Sermet C. (2008). Job Loss from Poor Health, Smoking and Obesity: a National Prospective Survey in France. Journal of epidemiology and community health; 62(4): 332-7.
44. Chandola T., Bartley M., Sacker A., Jenkinson C., Marmot M. (2003). Health Selection in the Whitehall II Study, UK. Social science and medicine (1982); 56(10): 2059-72.
45. Hatch S., Dohrenwend B. (2007). Distribution of Traumatic and other Stressful Life Events by race/ethnicity, gender, SES and age: a review of the research.
American Journal of Community Psychology; 40(3-4): 313-32.
46.Verbrugge L., Rennert C., Madans J. (1997). The Great Efficacy of Personal and Equipment Assistance in Reducing Disability. American journal of public health;
87(3): 384-92.
47.Commission on the Social Determinants of Health. (2008). Closing the Gap in a Generation: Health Equity Through Action on the Social Determinants of Health. Final Report on the Commission on the Social Determinants of Health, World Health Organization, Geneva. http://whqlibdoc.who.int/ publications/2008/9789241563703_eng.pdf.
General Practitioners and Nurses on Efficacy and Cost of
Type 2 Diabetes Patients Care/ Mousquès J. (Irdes, Prospere), Bourgueil Y. (Irdes, Prospere), Le Fur P. (Irdes, Prospere), Yilmaz E. (Drees)
Document de travail IRDES n° 29, January 2010.
l What are the Motivations of Pathways to Retirement in
Europe: Individual, Familial, Professional Situation or Social
Protection Systems?/ Debrand T. (Irdes), Sirven N. (Irdes) Document de travail Irdes n° 28, octobre 2009.
l Are Health Problems Systemic? Politics of Access and Choice under Beveridge and Bismarck Systems/ Or Z. (Irdes), Cases C. (Irdes), Lisac M. (Bertelsmann Stiftung), Vrangbaek K. (University of Copenhagen), Winblad U. (Uppsala University), Bevan G. (London School of Economics)Document de travail Irdes n° 27, septembre 2009.
l Quelles sont les motivations des départs à la retraite en
Europe : situation personnelle, familiale, professionnelle,
ou rôle de la protection sociale ?/Debrand T., Sirven N. Document de travail Irdes n° 26, juin 2009.
l Les écarts des coûts hospitaliers sont-ils justifiables ? Réflexions sur une convergence tarifaire entre les secteurs public et privé en France/ Or Z., Renaud T., Com-Ruelle L. Document de travail Irdes n° 25, mai 2009.
l Income and the Demand for Complementary Health
Insurance in France/ Grignon M., Kambia-Chopin B.
Document de travail Irdes n° 24, avril 2009.
l Principes et enjeux de la tarification à l’activité à
l’hôpital (T2A). Enseignements de la théorie économique
et des expériences étrangères/ Or Z., Renaud T. Document de travail Irdes n° 23, mars 2009.
l The Preferred Doctor Scheme: A Political Reading of a French Experiment of Gate-keeping/ Naiditch M., Dourgnon P.
Document de travail Irdes n° 22, mars 2009.
France, Germany and the United Kingdom/ Grandfils N.,
Sermet C.
Document de travail Irdes n° 21, février 2009.
l Dynamic Estimation of Health Expenditure: A New Approach for Simulating Individual Expenditure/ Albouy V., Davezies L., Debrand T.
Document de travail Irdes n° 20, janvier 2009.
l La qualité des soins en France : comment la mesurer pour l’améliorer ?/ Or Z., Com-Ruelle L.
Document de travail Irdes n° 19, décembre 2008.
l A Refutation of the Practice Style Hypothesis: The Case of Antibiotics Prescription by French General Practitioners for Acute Rhinopharyngitis/ Mousquès J., Renaud T., Scemama O. Document de travail Irdes n° 18, octobre 2008. l Impact of Health Care System on Socioeconomic
Inequalities in Doctor Use/ Or Z., Jusot F., Yilmaz E.
Document de travail Irdes n° 17, septembre 2008.
l Drug Price Setting and Regulation in France/ Grandfils N. Document de travail Irdes n° 16, Septembre 2008.
l Comparability of Health Care Responsiveness in Europe. Using Anchoring Vignettes from SHARE/ Sirven N., Santos-Eggimann B., Spagnoli J.
Document de travail Irdes n° 15, septembre 2008.
l État de santé des populations immigrées en France/ Jusot F., Silva J., Dourgnon P., Sermet C.
Document de travail Irdes n° 14, juillet 2008.
l The Sooner, the Better? Analyzing Preferences for Early Retirement in European Countries/ Blanchet D., Debrand T. Document de travail Irdes n° 13, juillet 2008.
l Social Heterogeneity in Self-Reported Health Status
and Measurement of Inequalities in Health/ Tubeuf S.,
Jusot F., Devaux M., Sermet C.
Document de travail Irdes n° 12, juin 2008.
Rapports 2008-2009
l Volume d’activité et résultats des soins en France : une analyse
multiniveaux des données hospitalières/ Or Z., Renaud T.
Rapport Irdes, décembre 2009, 80 pages. Prix : 21 €.
l Volume d’activité et qualité des soins dans les établissements
de santé : enseignements de la littérature/ Com-Ruelle L.,
Or Z., Renaud T. Avec la collaboration de Ambroise C. et Marek A.
Rapport Irdes n° 1734, décembre 2008, 146 pages. Prix : 30 €.
Questions d'économie de la santé 2009
l Qui a souscrit une surcomplémentaire ? Une analyse dynamique
de l’auto-sélection/ Franc C., Perronnin M., Pierre A., en collaboration avec Cases C.
Questions d’économie de la santé Irdes n° 150, janvier 2010.
l Quel lien entre volume d’activité des hôpitaux et qualité des
soins en France ?/ Or Z., Renaud T.
Questions d’économie de la santé Irdes n° 149, décembre 2009.
Conventional health surveys focus on current health and social context but rarely address past experiences of hardship or exclusion. However, recent research shows how such experiences contribute to health status and social inequalities.
In order to analyse in routine statistics the impact of lifelong adverse experiences (LAE) on various health indicators, a new set of questions on financial difficulties, housing difficulties due to financial hardship and isolation was introduced in the 2004 French National health, health care and insurance survey (ESPS 2004). Logistic regressions were used to analyze associations between LAE, current socioeconomic status (SES) (education, occupation, income) and health (self-perceived health, activity limitation, chronic morbidity), on a sample of 4308 men and women aged 35 years and older.
In our population, LAE were reported by 1 person out of 5. Although more frequent in low SES groups, they concerned above 10% of the highest incomes. For both sexes, LAE are significantly linked to poor self-perceived health, diseases and activity limitations, even controlling for SES (OR>2) and even in the highest income group. This pattern remains significant for LAE experienced only during childhood.
The questions successfully identified in a conventional survey people exposed to health problems in relation to past experiences. LAE contribute to the social health gradient and explain variability within social groups. These questions will be useful to monitor health inequalities, for instance by further analyzing LAE related health determinants such as risk factors, exposition and care use.
Surveiller les inégalités de santé en France :
un outil de prise en compte des expériences difficiles vécues au cours de la vie dans les enquêtes santé
Emmanuelle Cambois (Ined), Florence Jusot (Université Paris-Dauphine, Leda-Legos, Ined, Irdes)
Les enquêtes santé usuelles renseignent l’état de santé et le statut socio-économique actuels des individus mais ne permettent que rarement d’aborder les expériences passées de précarité ou d’exclusion. Des recherches récentes montrent pourtant l’impact de ce type d’expérience sur l’état de santé et qui expliquent en partie les inégalités sociales.
En 2004, de nouvelles questions ont été incluses dans l’Enquête sur la santé et la protection sociale (ESPS) afin d’étudier l’influence sur l’état de santé de plusieurs types d’expériences difficiles vécues au cours de la vie : difficultés financières, difficultés de logement dues à des problèmes financiers, période d’isolement. Les régressions logistiques sont utilisées pour analyser les associations entre ces expériences difficiles vécues au cours de la vie, le statut socio-économique actuel (éducation, occupation, revenu) et l’état de santé (santé perçue, limitation d’activité et maladie chronique) pour un échantillon de 4 308 hommes et femmes âgées de 35 ans et plus.
Dans cette population, une personne sur cinq déclare avoir connu au cours de sa vie au moins l’une des experiences considérées. Même si les personnes appartenant aux groupes sociaux les plus défavorisés sont plus fréquemment concernées, 10 % des personnes appartenant au plus haut quintile de revenu le sont également. Chez les hommes comme chez les femmes, la déclaration d’expériences difficiles passées est associée à une plus mauvaise santé, quel que soit l’indicateur de santé utilisé, y compris après contrôle par le statut socio-économique actuel. Enfin, les résultats restent très similaires lorsque l’on ne considère que les expériences difficiles vécues pendant l’enfance.
Ces questions permettent donc d’identifier avec succès dans une enquête traditionnelle des personnes vulnérables en termes de santé en raison d’expériences difficiles passées. Ces expériences difficiles vécues au cours de la vie contribuent non seulement à expliquer les inégalités de santé entre groupes sociaux mais également les inégalités de santé au sein de chaque groupe. Ces questions constituent donc un bon instrument de surveillance des inégalités de santé, par exemple à travers l’analyse des comportements de santé et du recours aux soins en lien avec ces expériences.