Identification of Tribolium castaneum (Herbst)
haplotypes, the pest of stocked millet in Senegal.
Cheikh Abdou Khadre Mbacké DIA 1,2,3*, Toffène DIOME 1,3, Ibrahima Victorin HOUMENOU 1, Mbacké SEMBENE 1,2,3
1 Animal Biology’s department, Faculty of Sciences and technics, University Cheikh Anta DIOP of Dakar. B.P. 5005
Dakar, Senegal.
2 Entomology and Acarology’s laboratory, Department of Animal Biology, Faculty of Sciences and technics, University
Cheikh Anta DIOP of Dakar. B.P. 5005 Dakar, Senegal.
3 Laboratory of Animals Biology’s populations Sahelo-soudanian (BIOPASS). Institute of Development Research
(IRD) / Institute Senegalese of Agricole Research (ISRA) Bel-Air, B.P. 1386, Dakar, Senegal
Corresponding author : Cheikh Abdou Khadre Mbacke DIA, e-mail : cheikhabdoukhadrembacke.dia@ucad.edu.sn Original submitted in on 23rd June 2016. Published online at www.m.elewa.org on 31st July 2016
http://dx.doi.org/10.4314/jab.v103i1.2 ABSTRACT
Objective: Millet is the staple food of millions of people living in the Sahelian zone and the tropical countries of West Africa. It occupies an important place in the Senegalese alimentation. The major damages to this cereal are caused by the beetle Tribolium castaneum Herbst (Tenebrionidae) whose adults give a repulsive smell of stored food and making them unusable. The objective of this study is to identify the different haplotypes of T. castaneum and their distribution in Senegal.
Methodology and Results: To achieve this, a sampling was performed in seven (7) localities of Senegal belonging to four agro-ecological zones. The DNA of each individual was extracted and the cytochrome b was amplified with Qiagen protocol and then sequenced. The results showed the existence of nine (9) haplotypes in Senegal and the haplotype Hap_1 prevailed among them and was present in all sampled areas. Haplotypes Hap_4 of Mbam, Hap_3 of Diaroumé, Hap_5 of Koungheul and Hap_7, Hap_8 and Hap_9 of Sandiara were individuals. Sandiara had a market for cereals, which may be a plausible reason for getting the largest number of haplotypes. The Hap_5 comes in all networks as the central Haplotype. Changes of nucleotide composition did not affect the amino acid composition of the haplotypes. Thus, all the mutations were synonymous.
Conclusion and application of results: From 2012 to 2015, 9 haplotypes on 12 of Tribolium castaneum imposed themselves in these localities. 9 haplotypes were identified in Senegal including 6 (six) of them are individual. The locality of Sandiara has the largest number of haplotype of T. castaneum because of the very strong marketing of cereals and vegetables in that area. The mutations are synonymous; Haplotypes therefore would have the same behaviour towards biopesticides.
Keywords: Tribolium castaneum, Cytochrome b, haplotype, Senegal, identification, distribution
Journal of Applied Biosciences 103:9784 – 9799
INTRODUCTION
The world population has been growing significantly since the end of World War II while giving birth to an imbalance between demographic evolution and food self-sufficiency in many regions through the world (Rosenzweig & Parry, 1994) But it becomes more and more difficult to increase that agricultural production due to climate changes that can cause drought, floods and the emergence of new pests jeopardizing the most vulnerable species or plant varieties. In Africa, especially in the Sahel region, food security is mainly based on cereal and some farming activities for private income; among them production of millet, which occupies a very important place (Saidou et al., 2009). Millet, Pennisetum spp, is the most tolerant cereal to drought. Its cultivation covered more than 30 million hectares in 1994, and was distributed mainly in arid and semi arid areas of Africa. Millet, being the staple of the people, is squarely the most important cereal in Senegal for both the planted area and for the production (MAE, 2001). Millet represents on average more than 60% of cereal production in Senegal (about one million tons / year) mainly from the groundnut bassin and Tambacounda. Pearl millet (scientific name) is the type almost exclusively used in Senegal as human food and/or animal feed (Diakhaté, 2013). Farming average yields varies between 0.5 and 0.6 t / ha. These low yields that vary between 0.5 and 0.6 t / ha, result from a combination of abiotic constraints:
mainly drought, and biotic constraints: diseases (mildew, coal and ergot) and insects (beetles, drillers and cantharides). Many studies are focused on the attack and the loss of stocked cereals and legumes by insects (Philogène et al., 1989; Ratnadass et al., 1989; Ashamo, 2006). They are responsible under the tropics of losses ranging from 30% (Gueye et al., 2011) to 44% (Fouabi 1989 in Sezonlin, 2006). The main pest of millet is the beetle Tribolium castaneum (Herbst). It is a primary pest, even if the development of its larva upon the whole seeds is very slow (Diome et al., 2013). The insect caused major damages on beaten stocked millet throughout the entire Sahel region (Roorda et al., 1982). Then it would be necessary to seek effective methods to fight against that pest in accordance with the environment standards and public health. It is therefore essential to perfectly know the insect T. castaneum and to find an integrated fight against this pest of millet, which is the main cereal of Senegal. This study aims to identify the haplotypes of T. castaneum and to know their distribution in Senegal’s territories. For this, we seek to determine the polymorphism of the T. castaneum’s population; to identify its haplotypes and individuals, which constitute them, and to study the geographical distribution of these haplotypes in Senegal.
MATERIAL AND METHODS
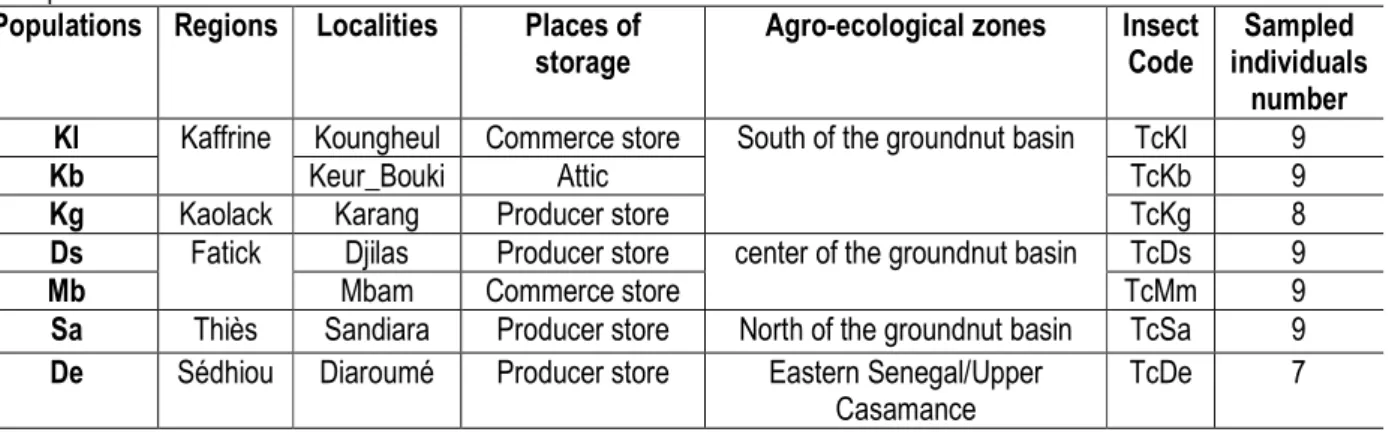
Sampling: The study has been conducted in seven localities of five regions of Senegal (Figure 1): Kaffrine (Koungheul and Keurbouki), Fatick (Djilas and Mbam), Thies (Sandiara) Kaolack (Karang) and Sédhiou (Diaroumé). In each locality, 205 grams of millet was taken from the fields and the resulting samples were placed in a plastic packet of 500 grams of transparent colour with closing and opening device at the end of the bag. Then they were brought back to the laboratory and were transferred into daily monitored jars. In the laboratory, the samples were distinguished then encoded according two criteria: the studied insect (T.
castaneum) of which we used the first letter of the genus’ name in uppercase and the first letter of the species’ name in lowercase; and the geographical origin by taking the first letter and the last letter of the area’s name, if there were two localities beginning with the same letter and if the locality is written with two words, the first letter of each word was taken/ considered. Seven populations were defined according the fields and each of them was composed of several individuals of T. castaneum from the same locality as shown in Table 1.
Figure 1: Location of sampled areas in the regions of Senegal According to agro-ecological zones, Djilas (14 ° 14
'45''N, 16 ° 38'04''O) and Mbam (14 ° 07' 06''N, 15 ° 37 '04''O) are in the center of the groundnut basin, Sandiara (14 ° 26'02''N, 16 ° 47 '33''O) is in the agro-ecological zone of the North of the groundnut basin, Keur Bouki (14 ° 08' 14''N, 15 ° 49 '44' '), Karang (13 °
35'N, 16 ° 42'W) and Koungheul (13 ° 59'N, 14 ° 48'W) are in the south of the groundnut basin and Diaroumé (12 ° 59' 08''N, 15 ° 37 '04''O) belongs to the agro-ecological zone of eastern Senegal / Upper Casamance.
Table 1: Number of individuals, each individual code , localities, agro-ecological zones and places of storage of sampled individuals
Populations Regions Localities Places of storage
Agro-ecological zones Insect Code
Sampled individuals
number Kl Kaffrine Koungheul Commerce store South of the groundnut basin TcKl 9
Kb Keur_Bouki Attic TcKb 9
Kg Kaolack Karang Producer store TcKg 8
Ds Fatick Djilas Producer store center of the groundnut basin TcDs 9
Mb Mbam Commerce store TcMm 9
Sa Thiès Sandiara Producer store North of the groundnut basin TcSa 9 De Sédhiou Diaroumé Producer store Eastern Senegal/Upper
Casamance
TcDe 7
Extraction of total DNA, PCR and sequencing of Cytochrome b: DNA extractions of T. castaneum were done by using the Qiagen DNeasy Tissue Kit. The insect was dissected first. Only the thorax and legs were used for extraction. After grinding they were placed in a 1.5 ml tube, wherein was added 180 µl of ATL digestion buffer that contained detergents, which caused dissociation of tissues and an individualization of cells. 20 µl of K proteinase were added to degrade all proteins after incubation at 55 ° C for 3 h. Tissues debris were removed after a quick centrifugation and
recovery of the supernatant. In the case where the sample was not completely digested, the mixture was centrifuged again and the liquid was decanted into a new tube to eliminate cells debris. To that solution, 200 µl of cell lysis buffer was added then an immediate passage to the vortex and incubation for 10 minutes at 70 ° C. After this incubation, ethanol 96-100% was added to the mixture, placed in a column and then centrifuged at 1361.357 rad.s-1 (13,000 rpm) for one minute to retain the DNA at the column’s membrane. The DNA being negatively charged was absorbed by
ionic interaction on the column’s membrane (positively charged). Proteins, lipids and polysaccharides were not retained by the membrane and will end up at the bottom of the collecting tubes and will be discarded. The DNA, fixed on the column was then purified in order to remove any traces of contaminants. This washing was carried out by adding successively two wash buffers (500 µl) which passed through the membrane by centrifugation at 1361.357 rad s-1 (13,000 rpm) for respectively 1 and 3 minutes. The column was then placed in a 1.5 ml tube. Due to the small size of these insects, two elutions of 40 µl and 20 µl were carried out respectively with Buffer AE previously incubated at 70 ° C to increase the yield from 15 to 20%. After this elution, the DNA was conserved at -20 ° C. The PCR was performed on fragments of the mitochondrial gene coding: the cytochrome b. CB1 primers (5'-GTA TAT CTA CCA TGA GGA CAA ATA TC-3 ') and CB2 (5'-ACA ATT CCT CCT GGA TTA AAT TTA AT-3') were used for the amplification of the gene of cytochrome b. The amplification was performed in a reactionnal volume of 25 µl containing a mixture of 21 µl and16.3 µl of milli water Q; 2.5 µl of 10x buffer; additional 1 µl of MgCl2; 0,5µl dNTP; 0.25 µl of each primer (forward and reverse); 0.2 µl of Taq polymerase and 4 µl of DNA extract. It was done by the repetition of cycles that ensures a multiplication by 2 of the target DNA in each cycle. This was carried out in an equipment known as Eppendorf thermocycler with the following amplification conditions: initial denaturation at 94 ° C for three minutes, followed by 35 cycles of denaturation at 94 ° C for 1 minute, annealing at 48 ° C for 1 minute, an elongation of the complementary DNA strand at 72 ° C for 1 minute and a final elongation at 72 ° C for 10 minutes ended the PCR. This technique consisted in determining the nucleotide sequence of one DNA fragment. It allowed, by comparing the sequences of the same gene of different individuals, to bring out point mutations. Sequencing was based on a PCR reaction using, in addition to the usual compounds (matrix DNA, polymerase, primers, dNTPs, Mg2 +), modified nucleotides: the dideoxyribonucleotides (ddNTPs). These ddNTPs had the distinction of being coupled to fluorochromes: green-ddATP, red-ddTTP, blue-ddCTP and yellow-ddGTP but also of lacking an OH group at the extremity 3’ of the deoxyribose. The ddNTPs incorporation by polymerase blocked the elongation of the complementary DNA molecule being copied and resulted in generated fragments of different sizes. The gel reading was effectuated by the scanning of an
automatic laser, which allowed the detection of the different coupled fluorochromes to the 4 ddNTPs. Genetic Analyses:
- The analysis of polymorphism and the genetic variability of T. castaneum population. The sequences were manually corrected and aligned first by using the Clustal-W algorithm (Thomson et al., 1997) with the Bio Edit 7.0.8.0 software (Hall, 1999). Variables sites such as singletons or uninformative sites and parsimony informative sites were determined with DnaSP software. The nucleotide composition depending on the codons’position, the synonymous and non-synonymous mutations were analyzed using the software MEGA Version 06 (Tamura and al., 2011). -Identification of Haplotypes: The DnaSp software enabled determination of the number of haplotypes of the overall population. Thus, the DnaSp software also determined the number of individuals within each haplotype. Polymorphic sites were manually identified and grouped by haplotype in a new alignment with Bio Edit to determine the nucleotide notable differences between one haplotype to another and thus identify haplotypes, which had more mutations. The amino acid composition of each haplotype was also determined using the Bio Edit software. The MEGA6 (Tamura et al., 2011) Software was used to elicit the nucleotide frequencies and the amino acid composition with the frame 3 (no stop codon) by haplotype. The minimum haplotype network was traced with the Network software v 4.6.14 through the Median-Joining method (Bandelt et al., 1999). For its achievement, each haplotype was represented by a single sequence to see the exact location of the mutational steps and the haplotype, which had the most similar sequence among the others. Phylogenetic trees of haplotypes with the maximum parsimony and the maximum likelihood method were built by the MEGA6 software (Tamura et al., 2011). The Kimura-2-parameter model was used for the method of distance and the Corrected Akaike Information Criterion (CAIC), which measured the quality of a statistical model. It allowed us to estimate the best model of evolution for the maximum likelihood tree and Bayesian inference. Thus, the employed evolution model uses the substitution matrix HKY (Hasegawa-Kishino-Yano) model for both probabilistic methods. The robustness of nodes for the maximum likelihood method was evaluated for 1,000 repetitions. The MEGA6 software built the maximum likelihood tree. The tree of the Bayesian approach was built by the Mrbayes software 3.1.2 (Huelsenbeck & Ronquist, 2001). This is an approach that uses the concept of
posterior probabilities, which could be estimated, by using the Monte Carlo method with the Markov Chains (MCMC). This method used simultaneously four channels (three were "heated" gradually) using the HKY model. 10 000 000 generations were performed for each channel by sampling the various parameters every 1000 generations. Generations effectuated during the ignition period were eliminated from the analysis. Conservatively, the first generations of 2500000 were eliminated (25%) and inferences were then realized on the 7500000 next generations. The
reconstructions were rooted with a sequence of Tribolium confusum (Coleoptera, Tenebrionidae). -Distribution of haplotypes: The distribution of haplotypes was studied by using the haplotype network traced initially according to localities and secondly according to agro-ecological zones with the Network software v. 4.6.14 and with the Median-Joining method (Bandelt et al., 1999). Each haplotype is represented this time by the whole set of sequences that determine them.
RESULTS
Polymorphism and genetic variability: After the cleaning and the alignment of sequences, no deletion or undefined nucleotide were observed in this dataset. 60 sequences, each having 398 sites of which 97.73% were invariable or monomorphic and 2.27% were polymorphic or variables by two variants induced by 9
mutations (Eta equal to 9). Among the polymorphic sites, 1% were singletons at positions 9, 24, 45 and 203, the remaining 1.27% were informative sites in parsimony at positions 63,212,273,302 and 395. Polymorphic sites with more than two variants were not observed. (Table2)
Table 2: Total number of scanned sites and percentage of polymorphic and invariable sites. Parameters
Population Total number of sites
Monomorphic Sites
Polymorphic sites Singletons Sites Informative
Sites in parsimony
Total Population 399 97,73% 1% 1,27%
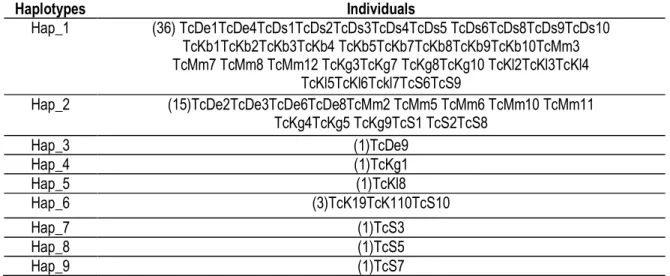
Identification of haplotypes: After the alignment, the 60 obtained sequences were divided in nine (9) haplotypes (Table 3). Among them, the haplotype Hap_1 prevailed with 36 individuals or 60% of the sample, followed by the haplotype Hap_2 with 15
individuals representing 25% and the haplotype Hap_6 with 3 individuals or 5%. The remaining haplotypes such as Hap_3, Hap_4, Hap_5, Hap_7, Hap_8 and Hap_9 were individual and each represented 1.67% of the overall population.
Table 3: Different haplotypes and the individuals within them
Haplotypes Individuals Hap_1 (36) TcDe1TcDe4TcDs1TcDs2TcDs3TcDs4TcDs5 TcDs6TcDs8TcDs9TcDs10 TcKb1TcKb2TcKb3TcKb4 TcKb5TcKb7TcKb8TcKb9TcKb10TcMm3 TcMm7 TcMm8 TcMm12 TcKg3TcKg7 TcKg8TcKg10 TcKl2TcKl3TcKl4 TcKl5TcKl6Tckl7TcS6TcS9 Hap_2 (15)TcDe2TcDe3TcDe6TcDe8TcMm2 TcMm5 TcMm6 TcMm10 TcMm11 TcKg4TcKg5 TcKg9TcS1 TcS2TcS8 Hap_3 (1)TcDe9 Hap_4 (1)TcKg1 Hap_5 (1)TcKl8 Hap_6 (3)TcK19TcK110TcS10 Hap_7 (1)TcS3 Hap_8 (1)TcS5 Hap_9 (1)TcS7
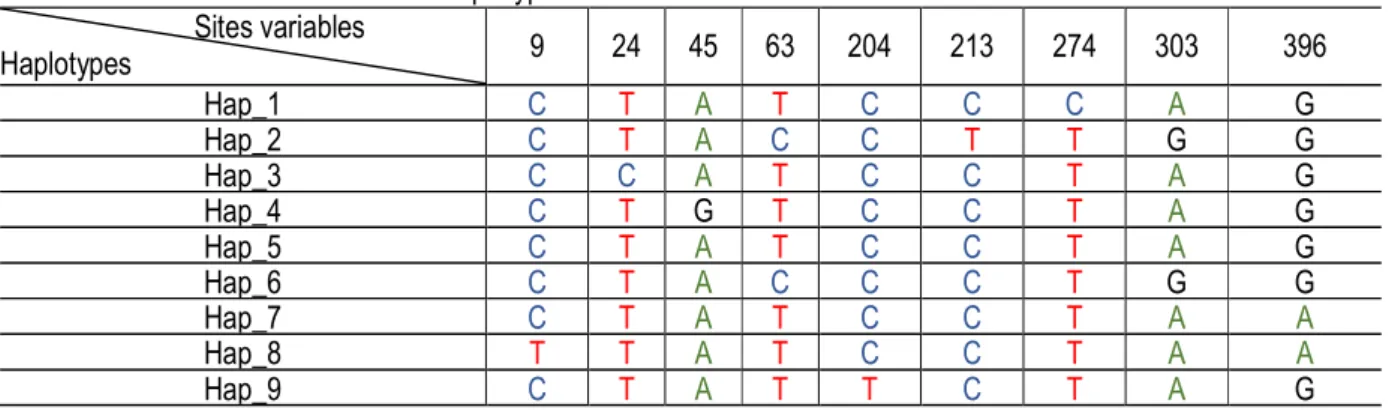
For the all haplotypes, the mutations were substitutions between purine bases in one hand and pyrimidine
bases on the other. Therefore, all mutations were transitions. The haplotypes hap_2 hap_9 had more
transitions than others did if we took as reference the haplotype hap_1, which had the majority (Table 4). Table 4: Different mutations between haplotypes
Sites variables Haplotypes 9 24 45 63 204 213 274 303 396 Hap_1 C T A T C C C A G Hap_2 C T A C C T T G G Hap_3 C C A T C C T A G Hap_4 C T G T C C T A G Hap_5 C T A T C C T A G Hap_6 C T A C C C T G G Hap_7 C T A T C C T A A Hap_8 T T A T C C T A A Hap_9 C T A T T C T A G
Frequencies of nucleotides according to positions: Frequency in nucleotides for all the sequences showed that, at the first, the second and even the third position of codons, Thymine and Adenine were more represented with higher frequencies than Guanine and Cytosine. Globally, the percentage of A-T was greater than that of C-G (1st, 2nd and 3rd position of the
codon). Taking into account the double link between Thymine and Adenine with higher frequencies and the triple link between Guanine and Cytosine, the Cytochrome b of the T. castaneum species was exposed to changes and these will result in most cases to an amino acid change (Table5) if that mutation was localized in the first two positions of codon.
Table 5: Nucleotide frequencies according to the positions on the triplet of the total population
Positions T C A G Average Total 33,4% 25,5% 29,8% 11,3% 1st P 27% 25,3% 26,3% 21,1% 2nd P 41% 24,8% 24,1% 9,8% 3rd P 32% 26,3% 38,9% 3,2%
Amino acid composition: The amino acid composition was obtained according to the FRAME 2 (2nd reading frame), which revealed less stop codon (any stop codon for Cytochrome b of T. castaneum). It revealed that, despite the transitional substitutions observed between haplotypes, they all had the same protein
chain. Therefore, mutations leading to the appearance of these haplotypes were not synonymous. Minimum network of haplotypes: Each ellipse represented one haplotype. The separate lines between haplotypes were mutational steps. (Figure 2).
The network of haplotypes revealed that Hap_5,being a private haplotype of Koungheul, was also the central haplotype. Hap_1, which had the majority, stemmed from Hap_5 with the transitional substitution of Thymine by Cytosine. Haplotypes Hap_3, Hap_4, Hap_9 and Hap_7 stemmed also from Hap_5 with the respective transitional replacements of Thymine by Cytosine at the 24th position, of Adenine by Guanine at the 45th position, of Cytosine by Thymine at the 204th position, and of Guanine by Adenine at the 396th position. The Hap_6 came from Hap_5 after two mutational steps to positions 303 and 63 with respective transitions of Adenine to Guanine and of Thymine to Cytosine. Haplotypes, Hap_8 and Hap_2 came respectively from transitional substitutions of Cytosine by Thymine of haplotypes Hap_7 at position 9 and Hap_6 at the 213th position.
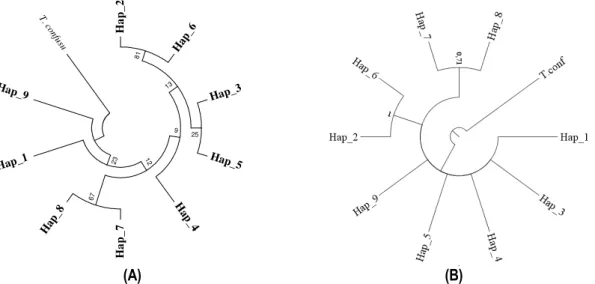
Phylogenetic trees of haplotypes: The obtained samples in seven localities in Senegal were divided in four agro-ecological zones. Sampled individuals were divided into 9 haplotypes. Trees were rooted with an individual of the species Tribolium confusum (Figure 3). The phylogenetic tree of maximum likelihood (ML) accented the existence of three haplogroups and the Bayesian inference (BI) revealed only two. With posterior probabilities of 81% with ML and 100% with BI, haplotypes Hap_2 and Hap_6 formed the first haplogroup. The second, with the posterior probabilities, smaller than those of the first haplogroup, with 67% with ML and 71% with BI was formed by haplotypes Hap_7 and Hap_8. The third haplogroup, revealed by the ML reconstruction, was composed by haplotypes Hap_5 and Hap_ (Figure 3).
H a p _ 2 Hap _6 81 Hap_3 Hap_5 25 13 H ap _4 9 H a p _ 7 Hap _8 67 12 Hap_1 23 Hap_9 T . c onfu su (A) (B)
Figure 3: Phylogenetic trees of haplotypes by Maximum Likelihood method (A) and Bayesian Inference (B). Distribution of haplotypes in Senegal: Distribution
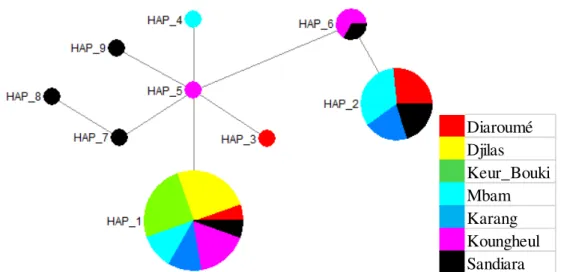
based on the sampled localities: According to localities, the network of haplotypes showed that the haplotype Hap_1which had the majority was represented in all sampled areas (Figure 4). It was the only haplotype present in the localities of Djilas and Keur_Bouki. Hap_2 was absent from these two localities, but was present in Diaroumé, Sandiara, Karang, Koungheul and
Mbam. After Hap_1, the haplotype Hap_2 was the most distributed. Hap_7, Hap_8 and Hap_9 were private haplotypes of the locality of Sandiara. Haplotypes Hap_4, Hap_3, were private respectively in Mbam and Diaroumé. Hap_5, being the central haplotype of the network, was a private haplotype in the locality of Koungheul (Figure 4).
Diaroumé Djilas Keur_Bouki Mbam Karang Koungheul Sandiara Figure 4: The haplotypes network based on sampled localities in Senegal Distribution based on sampled agro-ecological areas:
The distribution of haplotypes according to agro-ecological areas showed that Hap_1 and Hap_2 were the most distributed haplotypes; the most shared and they were found in all sampled agro-ecological areas (Figure 5). Hap_1 was much more common in the south and in the Center of the Groundnut Basin (SBA), less common in the North of the Groundnut Basin (NBA) and in the area of the Low Casamance (BA). The haplotypes number was higher in the North of the Groundnut Basin (6 identified haplotypes: Hap_1,
Hap_2, Hap_6, Hap7, Hap_8 and Hap_9) and in the South of the Groundnut Basin (5 identified haplotypes: Hap_1, Hap_2, Hap_4, Hap_5 and Hap_6). Haplotypes Hap_7, Hap_8 Hap_9 were private in the Northern Zone of the Groundnut Basin, haplotypes Hap_4, Hap_5 were private in the southern area of the groundnut basin and the haplotype Hap_3 was a private one in the Low Casamance. The Center of the Groundnut Basin (CBA) had no private haplotypes and had only haplotypes Hap_1 and Hap_2 (Figure 5).
SBA
CBA
NBA
BC
Figure 5: Haplotypes network based on sampled agro-ecological areas in Senegal: SBA: South Groundnut Basin; CBA: Center of the Groundnut Basin; NBA: North of the groundnut Basin; BC: Low Casamance.
DISCUSSION
The objective of this work was to firstly identify the different haplotypes of T. castaneum, pest of millet in stock, and secondly to see its distribution in the different agro-ecological zones and in the sampled localities of Senegal. After a careful alignment of the 60 sequences in seven localities belonging to four agro-ecological zones, we noticed a degree of polymorphism with a rate of 2.27% of variable sites. These variables sites were caused by 9 mutations, which were all transitional substitutions, that gave birth to 9 haplotypes. These results confirmed those of Dia et al. (2014) who had found 9 haplotypes with 71 sampled individuals in Senegal. It confirmed also the decrease of 3 haplotypes from 2012 to 2014 based on the results of Diome et al. (2012), which had recorded 12 haplotypes in Senegal while those of Dia et al. (2014) found only 9.The haplotypes had the same protein chain, it implied that the observed transitional substitutions were synonymous. This was due to the redundancy of the genetic code. Therefore, these changes would have any effect in the role of the cytochrome b, on the insect physiology and phenotype. The space of development cycle between individuals of Djilas and Karang in one hand and Diaroumé and Djilas on the other, which was revealed by the studies of Diome et al. (2015), would not be determined then by the variability of cytochrome b. In terms of numbers, the haplotype Hap_1 had the majority with 60% of individuals and was found in all the sampled localities and agro-ecological zones. This haplotype would be national in Senegal and this result confirmed those of Dia et al. (2014) and Diome et al. (2008), according to them the haplotype Hap_1 was fixed and national. Hap_2 was the most different haplotype of Hap_5, which was considered as the central haplotype, with three nucleotide replacements that occurred for its formation. Despite this difference, Hap_2 was found in all agro-ecological zones and in almost all localities except in Djilas and Keur_Bouki. According to Diome et al. (2012), Isman (2012) and Dia et al. (2014), the trade flow between these areas might be the cause of such a distribution of haplotypes Hap_1 and Hap_2. They showed that the marketing of cereal was the cause of the genetic variability of Tribolium castaneum in Senegal. The Hap_5 is identified in the locality of Karang and, according to the minimum haplotype network, it is the central haplotype, according to the minimum network haplotype which originate from other haplotypes by some transitional nucleotide substitutions .In addition, the haplotype Hap_1 was the most
distributed and the only one that was identified in Djilas (Closed population (Isman, 2012)) and in Keur_Bouki (No differentiation due to a founder effect, or their way of traditional storage in granary which influenced the proliferation of the insect thus its genetic diversity (Seck et al., 1992)). This allowed us to think that Djilas and Keur_Bouki could not be infested by Hap 5, which would be the first insect’s strain in Senegal. Since the appearance of the first haplotype of T. castaneum in Koungheul until the occurrence of one mutation of Cytosine by Thymine giving birth to Hap_1, this pest would not attack millet of Djilas and Keur_Bouki. This allowed us to think that the proliferation of this insect would coincide with the birth of the haplotype Hap_1. That is the reason why haplotype Hap_5 was not distributed in any other parts of Senegal. With trade flows Hap_1 would be scattered almost everywhere in Senegal but with this topology revealed by all haplotype networks, despite having the majority, it could not be the ancestral haplotype as the work of Diome et al. (2012) and Dia et al. (2014) had revealed. The low diversity observed in Djilas and Keur Bouki due to the fact that they had no markets and they grew millet in large quantities, that’s why these communities rarely import millet (Diome, 2014), therefore rare importation of new haplotypes. The Haplotype Hap_4 observed in Karang mighty come from Gambia because they share some borderlands. T. castaneum haplotypes might be then imported with products from Gambia by the inhabitants of this town and increased the haplotype diversity (Dia et al., 2014). These same causes would be the cause of the specific presence of the haplotype Hap_3 in Diaroumé (belonging to the low Casamance), which is close to Guinea Bissau. Mbam is an open population and that would be probably the cause of the presence of Hap_1 and Hap_2, therefore they would have been imported. The largest number of haplotypes was observed in Sandiara (town hosting a large market where farming products were mixed in trade stores), Diaroumé (town hosting a large market where farming products were mixed in trade stores) and Mbam (locality where farmers stored their products (millet, maize, rice, groundnuts and black-eyed peas in warehouses). They were hosting the largest number of haplotypes, some were private to them but some among the biggest part of the individuals belong to shared haplotypes between all localities and all agro-ecological areas, we can mention among them haplotypes Hap_1 and Hap_2. In addition, obtained trees with the method of Maximum Likelihood and
Bayesian Inference revealed that haplotypes Hap_2 and Hap_6 were the closest phylogenetically with strong posterior probabilities and showed also a topology of Haplogroups grouping haplotypes from different localities and different agro-ecological zones. This tally with the results of Dia et al. (2014), according
to them, the phylogenetic groupings and the distribution of haplotypes were done neither by different localities, nor by agro-ecological zones of Senegal. Grain Marketing would be the cause of such a distribution of haplotypes.
CONCLUSION
This work allowed us to identify the different haplotypes of T. castaneum Herbst and their location in the Senegalese territory by using the mitochondrial gene cytochrome b. Thus the genetic characterization of T. castaneum shows that the haplotypes of this insect are (9), 6 (six) of them are individual. The locality of Sandiara has the largest number of haplotype of T. castaneum because of the very strong marketing of cereals and vegetables in that area. Haplotype Hap_1 is the most distributed and is located in all areas and in all sampled agro-ecological zones in Senegal but it cannot be considered at this level as the ancestral haplotype. This study also allowed us to see that the
distribution of haplotypes was not done according to localities and sampled agro-ecological zones despite the large number of individual haplotypes compared to the total number of haplotypes. However, for a better understanding of this insect population, it would be important to expand the sampling in Senegalese territory up to Ferlo, the Senegal River Valley and the total area of Casamance, in order to better know its distribution throughout the national territory. This study will be considered as a gap in the geographical distribution of this insect in Africa and all around the world in order to know its phylogeography.
ACKOWLEDGEMENT
This work was funded by ‘‘World Bank Program’’ (WAPP) National centres of Excellence and OHMi ‘‘ObservatoireHomme Milieu’’ Tessékéré.
REFERENCES
Bandelt H-J, Forster P, Röhl A (1999) Median-joining networks for inferring intraspecific phylogenies. Molecular Biology and Evolution 16:37-48 Dia C. A. K. M., Diome T., Thiaw C., Diop M. Et
Sembene M. (2014). Impact of storage infrastructures and agroecological areas in genetic demographic evolution of Tribolium castaneum Herbst (Coleoptera: Tenebrionidae) Senegalese populations. International Journal of Science and Advanced Technology (ISSN 2221-8386) Volume 4, Page : 12 – 23
Diome T., Thiaw C., Ndong A., Sarr M., Kane M. & Sembène M. (2012). Haplotype diversity of Tribolium castaneum H. (Coleoptera, Tenebrionidae) pest of stored millet in Senegal. Journal of cell and animal biology.6 (13): 192-199,
Diome T. (2014). Biodémographie et diversité génétique des populations de Tribolium castaneum Herbst (Coleoptera, Tenebrionidae) ravageur des grains de mil (Pennisetum glaucum Brown) en stock au Sénégal. Thèse de Doctorat unique.
Diome T., Thiaw C., Sarr M., Ndong A., Kane M., Cissé N., Sembène M. (2013). Genetic diversity of Tribolium castaneum (Herbst) population in storage infrastructures and agro ecological zones in Senegal
Excoffier L., Laval G., Schneider S. (2005).Arlequin ver. 3.0: An integrated software package for population genetics data analysis. Evolutionary Bioinformatics Online. 1: 47–50. Guèye MT., Dogo S., Wathel et JP., Lognay Georges
(2011). Lutte contre les ravageurs des stocks de céréales et de légumineuses au Sénégal et en Afrique occidentale : synthèse bibliographique. Biotechnol. Agron. Soc. Environ. 2011 15(1), 183-194.
Hall T.A. (1999). BioEdit: a user-friendly biological sequence alignment editor and analysis program for Windows 95/98/NT. Nucl. Acids. Symp. Ser. 41:95-98.
Huelsenbeck JP., Bollback JP. (2001). Application of the likelihood function in phylogenetic analysis. In: Balding DJ, Bishop M. & C. Cannings (Eds.). Handbook of Statistical Genetics. 415-439.
Isman Abdi b. (2012). Diversity and genetic structuring of the populations of a devastating insect of stocks of millet in Senegal: Tribolium castaneum Herbst (Coleoptera: Tenebrionidae). Memory of master of Genetics of the populations, University Cheikh Anta Diop of Dakar. 29p
MAE: Ministry for Agriculture and breeding (2001) Culture and production of millet and Sorghum in Senegal: Assessment – Diagnosis and prospects. 130p.
Philogène B.J.R, Armson J.T. & Lambert J.D.H., (1989). Phylogenetic analysis: 14 promising candidates. Systematic Biology, 41, 483-490. polymorphisms. Nature, 432: 717–722. Ratnadass A. & Sauphanor B., (1989). Les pertes dues
aux insectes sur les stocks paysans de céréales en Côte d’Ivoire. Céréales en régions chaudes. Paris : Aupelf- Uref, John Libbey Eurotext, 141-150.
Roorda FA. (1982). Laboratory observations on the development of Tribolium castaneum HERBST. (Col., Tenebrionidae) on millet at different temperature and relative humidities. Zeit schriftfürangewandte Entomologie 93: 446-452.
Rozas J., Librado P., Sánchez-Del Barrio JC.,Messeguer X. &Rozas R. (2010). DnaSP Version 5 Help Contents [Help File].
Rosenzweig C. & Parry M. L. (1994). Potential impact of climate change on world food supply. Nature. 367: 133-138.
Saïdou A. A., Mariac C., Luong V., Pham J. L., Bezançon G. & Vigouroux Y. (2009). Association studies identify natural variation at PHYC linked to flowering time and morphological variation in pearl millet. Genetics. 182: 899-910.
Seck D., Sidibé B. &Fall A., (1992).Observation sur le développement de Tribolium castaneum Herbst sur le mil (Pennisetum typhoïde L.), en fonction du taux de brisure dans le substrat. Soc. r. belge Ent. 35 : 471-475.
Sezonlin M. (2006). Phylogeographie et genetique des populations du foreur de tiges de cerealesbusse olafusca (fuller) (Lepidoptera, noctuidae) en afrique subsaharienne, implications pour la lutte biologique contre cet insect. Thèse de doctorat de l’université de Paris XI-Orsay. 152p.
Tamura K., Peterson D., Peterson N., StecherG., Nei M., KumarS., (2011): MEGA 5: Molecular Evolutionary Genetics Analysis using Maximum Likelihood, Evolutionary Distance, and Maximum Parsimony Methods. Molecular Biology and Evolution, 28 (10): 2731-2739. Thompson, J. D., Higgins, D. G., Plewniak, F. Jean
mugin, F. and Higgins, D. G. (1997). The CLUSTAL_X windows interface: flexible strategies for multiple sequence alignment aided by quality analysis tools. Nucleic Acid Research.