HAL Id: hal-00280296
https://hal.archives-ouvertes.fr/hal-00280296
Submitted on 3 Apr 2020
HAL is a multi-disciplinary open access archive for the deposit and dissemination of sci-entific research documents, whether they are pub-lished or not. The documents may come from teaching and research institutions in France or abroad, or from public or private research centers.
L’archive ouverte pluridisciplinaire HAL, est destinée au dépôt et à la diffusion de documents scientifiques de niveau recherche, publiés ou non, émanant des établissements d’enseignement et de recherche français ou étrangers, des laboratoires publics ou privés.
Distributed under a Creative Commons Attribution| 4.0 International License
Altimetry and Its Implications for Water Balance
J.-F. Crétaux, A.V. Kouraev, F. Papa, M. Bergé Nguyen, A. Cazenave, N.V.
Aladin, I.S. Plotnikov
To cite this version:
J.-F. Crétaux, A.V. Kouraev, F. Papa, M. Bergé Nguyen, A. Cazenave, et al.. Evolution of Sea Level of the Big Aral Sea from Satellite Altimetry and Its Implications for Water Balance. Journal of Great Lakes Research, Elsevier, 2005, 31 (4), pp.520-534. �10.1016/S0380-1330(05)70281-1�. �hal-00280296�
Evolution of sea level of the Big Aral Sea from satellite altimetry
and its implications for water balance
J-F Crétaux1, A.V. Kouraev1,2, F. Papa1,3,
M.Bergé-Nguyen1, A. Cazenave1, N. Aladin4, I.S. Plotnikov4
(1) Laboratoire d’Etudes en Géophysique et Océanographie Spatiales (LEGOS), 18 av Ed Belin, 31401 Toulouse Cedex 9, France, email : [email protected], (corresponding author) Tel : 33-5-61-33-29-89, [email protected], tel : 29-30, [email protected], te :l 29-22, [email protected], tel : 33-5-61-33-29-75, Fax for all : 33-5-61-25-32-05,
(2) State Oceanography Institute, St. Petersburg branch 199026, St. Petersburg, 23 linia 2A, Russia, email: [email protected] (3) Goddard Institute for Space Studies, NASA-Columbia University, 2880, Broadway, New York, NY, 10025, USA, tel: 001 212 678 5524, [email protected]
(4) Zoological Institute, Russian Academy of Sciences, Laboratory of Brackish water biology, 1 Universitatskaya Nabereznaya,199034, St Petersburg, Russia, email: [email protected], tel: 812-328-46-09, fax: 812-114-04-44
Abstract- The Aral Sea, one of the biggest lakes in the world, started to shrink in the 1960s
because water was withdrawn for irrigation. The lowering of the Aral Sea level led to the separation of the lake into two basins – the Small Aral in the north, and the Big Aral in the south. For several decades there were no continuous observations of sea level, and the few data that exist are fragmentary or unavailable. We present observations of the Big Aral Sea level estimated from the TOPEX/Poseidon (T/P) altimetry with high temporal resolution over the last decade (1993-2004). Since the sea volume is one of the key parameters for the studies of water balance, we use the T/P-derived time series of sea level to reconstruct, using a dedicated digital bathymetry model (DBM), associated changes in the sea surface and volume. We introduce variations of the sea volume as the new constraint for the water budget of the Big Aral Sea. This is an important step forward towards estimating detailed seasonal and interannual changes of the water budget. We assess various existing components of the water budget of the Aral Sea and discuss the quality of the existing data and their applicability for establishing detailed water balance. In particular, large uncertainties in estimating the evaporation and underground water supply are addressed. Desiccation of the Aral Sea resulted in dramatic changes in the salinity regime and, consequently, affected marine ecosystems. We also discuss changes in the aquatic fauna and its possible evolution under continuing desiccation of the Big Aral Sea. Combination of satellite altimetry with other parameters of the water budget show that this approach offers promising potential for the assessment of the temporal evolution of the water budget in arid or semi-arid conditions, even with poor ground monitoring network.
Index Words
1. Introduction.
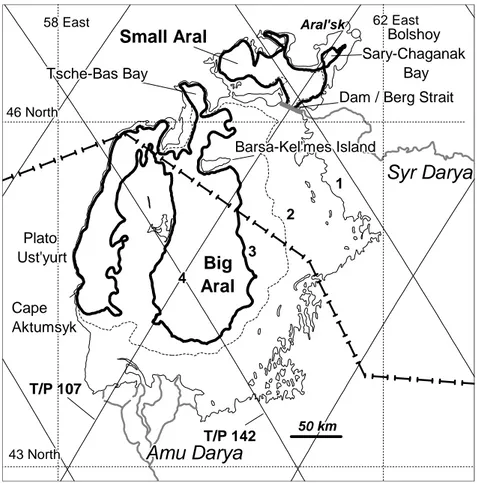
Until recently the Aral Sea was one of the biggest lakes in the world with a surface of 57 000 km2 and a volume of 950 km3. Two tributaries, the Amu Daria and the Syr Daria rivers empty into the
lake and there is no outflow (Figure 1). Until the 1960s, river discharge provided in average of 56 km3/yr (Bortnik, 1999) of water to the Aral Sea which was sufficient to maintain the lake level at +53 m above sea level (Zenkevich, 1963). Before the water diversion, the Aral Sea was a brackish lake with an average salinity of 8-10 ppt , and was characterised by low biodiversity and biological productivity. Only a few free-living invertabrates and fish species and few free-living invertebrates inhabited the lake.
Figure 1
Early in the 1960’s an increased amount of river water was diverted for irrigation in Kazakstan and Uzbekistan. This diversion led to dramatic decreases of the Syr Darya and the Amu Darya discharges - averaging 16.7 km3/year for 1971-1980 and 4.2 km3/year for 1980-1989 (Bortnik, 1999). The lake level declined from +53m to +40 m in 1989 and +30 m in 2004 (see Figure 1); lake surface area and volume also changed significantly - from respectively 67000 km2 and 1083 km3 in 1960 (Bortnik, 1999, Micklin 1988) to 16000 km2 and 100 km3 in 2004 (data from the Digital Bathymetry Model, see section 1.4).
When the lake level decreased to about +40m (Aladin et al., 1995) in 1989, Berg's strait, which connected the northern and southern parts of the sea, dried out and the Aral Sea separated into two distinct water bodies - the Big Aral in the south, and the Small Aral in the north. Since the separation, these two lakes have evolved in different ways. The Small Aral continues to be fed by the Syr Darya and its level decreased more slowly in the 1990s than the level of the Big Aral (Aladin et al., 2005). The Amu Darya water discharge, which feeds the Big Aral was insufficient to compensate for the high rate of evaporation. The precipitation rate in the region is rather low (less than 200 mm/yr) compared to the evaporation that ranges from 1000 to 1200 mm/yr (Small et
al., 1999, 2001). Evaporation minus precipitation for the Big Aral Sea represented an average loss of 25-30 km3/yr during the last decade, while river discharge from the Amu Darya varied from 0 to 15 km3/yr in the 1990s. Thus, in the last decade of the 20th century the water supply deficit reached 10-15 km3/yr depending on the year.
At the time when the Big Aral and Small Aral became separated, the salinity of the Aral Sea was about 28-30 ppt, and the fauna and flora of the Small and Big Aral were similar. After separation, the resulting differences in hydrological regimes rapidly led to biological differences between these two water bodies. While the salinity of the Small Aral remained stable, the Big Aral was quickly transformed from brackish to mesohaline (Plotnikov et al., 1991) and then to hyperhaline with salinity reaching 69-72 ppt in the western and 155-160 ppt in the eastern part (Mirabdullaev et al., 2004). Before the division into two lakes, only seven species of fish, ten common zooplankton species, and eleven common benthos species were present. Since then, typical hyperhaline species started to dominate, while most of the former inhabitants of the Big Aral Sea, including fishes, became extinct. According to our field observations, none of fish species that were present in the Big Aral during at partition time, remained in Autumn 2002, when the salinity exceeded 70 ppt in the western coast. In autumn 2003, when the salinity exceeded 80 ppt, no fishes were found. Only few euryhaline rotifers zooplankton survived and only 4 zoobenthos species remained.
After the separation from the Big Aral, the water level in the Small Aral began to rise due to a positive water balance, and as a result, parts of its waters began to flow southward into the Big Aral. This outflow took place in the central part of the Berg's strait which was dredged earlier (in 1980) in order to facilitate navigation between the northern and the southern basins. This southward current was slow at first but increased as the level of the Big Aral continued to fall. . When the Big Aral level fell to +37 meters the difference of level between the two water bodies reached 3 meters and flow reached 100 m3/s. This canal was dammed in the summer of 1992 and
the flow stopped. Over the next few years the dam in the Berg’s strait was partly destroyed by floods and was restored several times (for details see (Aladin et al., 2005)). In April 1999 the dam was completely destroyed and the water of the Small Aral again flowed southward. But, as the length of the channel between the Big and Small Aral increased, water flowing from the Small Aral was retained in the sands and salt marshes north of the former Barsakelmes Island and did not reach the Big Aral.
Several publications have reported on studies of the water balance of the Aral Sea. Small et al., 1999 resolved the water balance equation by using a regional lake model and obtained values of evaporation minus precipitation (accounting for seasonal but not interannual variability) up to 1990. Small et al. (2001) also evaluated the effect of evaporation and precipitation on the lake level decrease up to 1990 and separated anthropogenic and climatic factors. Benduhn et al. 2003 developed a model of evaporation for the Big Aral based on the Penman equation and used the water mass balance equation to estimate the interannual groundwater inflow to the Big Aral until 1990. They showed that this contribution to the water mass balance has a high variability (from 1 to 15 km3/yr) and has an average value of 8 km3/yr. Jarsjö and Destouni 2004, also estimated the ground water discharge by using the water mass balance equation and different scenarios for the evaporation and precipitation rates. They concluded that ground water has become a major contributor to the hydrological budget of the Aral Sea, with annual values varying from 5 to 30 km3 depending on the scenario.
However, the problem with most of the water balance studies of the Aral Sea is that for several decades there were no continuous observations of lake level, and the few data that do exist are fragmentary or unavailable. Because the historical lake volume cannot be determined accurately, there are large uncertainties in the water balance equations and the reliability of the results has suffered. By using satellite altimetry, it is now possible to observe the level variations of the large continental water bodies (Birkett 1995; Cazenave et al., 1997, 2002; Mercier 2001) with high
precision. In this article we present observations of the Big Aral Sea level from TOPEX/Poseidon (T/P) and Jason-1 altimetry with a high temporal resolution over the last decade (1993-2004). We use the T/P-derived time series of sea level to reconstruct associated changes in the Aral Sea surface and volume, using a dedicated digital bathymetry model (DBM),. We then use the variations of the volume as a new, precise constraint for the water budget of the Big Aral Sea. We assess the various components of the water budget of the Aral Sea and discuss their quality and their usefulness for establishing detailed water balance. Desiccation of the Aral Sea resulted in dramatic changes in the salinity regime and, consequently, affected marine ecosystems. We consequently discuss the changes in the aquatic fauna and its possible evolution under continuing desiccation of the Big Aral Sea.
1. Variations of level, surface and volume of the Big Aral Sea.
One of the fundamental parameters for the studies of inland water bodies and their water budget is the variations of their level, surface and volume. Traditionally, water levels are obtained from gauging stations installed along the coast, but there have been no gauges in the Big Aral Sea for many years. A few scientific expeditions took place along the coast of the Aral Sea, but either the level observations were not acquired or they were not available. A recent measurement of Big Aral level in November 2002 (+30.5 meters above Baltic Sea Level) was published in (Zavialov et al., 2003), but for the period 1993-2004 no in-situ data was ever published. With more than a decade of satellite altimetry available, it is now possible to estimate the variability of the Aral Sea level.
1.1. Satellite altimetry data
In August 1992, the TOPEX/Poseidon (T/P) satellite was launched. Its main objective was to measure the ocean surface topography with an accuracy of few centimeters. In 2002 T/P was followed by a second satellite altimeter (Jason-1) which operates in tandem with T/P. The T/P satellite carries a dual frequency radar altimeter operating in C and Ku bands (5.3 and 13.6 GHz respectively), which transmit a short pulse in the nadir direction reflected by the sea surface. The
measurement of the time delay between emission and reflection provides a measurement of the distance between the satellite and the sea surface Several corrections , for atmospheric refraction, electromagnetic bias, tides, etc … are applied to estimate the sea surface height ((Fu and Cazenave 2001; Birkett 1995)
Although designed to study the open ocean, altimetry has been almost immediately used for studies of continental water bodies such as lakes, inland seas, flooding plains, or rivers (for exhaustive details on application of altimetry to lake study, see (Birkett 1995)). Satellite altimetry offers an invaluable source of information for water level monitoring, with a time resolution of 10 days.
The Big Aral surface is crossed over by two satellite tracks (see Figure 1). The data analysed consist of the merged T/P and Jason altimetry data (GDR-Ms) provided by the Centre for Ocean Topography and Hydrosphere (CTOH) at LEGOS, Toulouse, France for the orbital cycles 1 to 365 for T/P (September 1992 to August 2002) and 1 to 106 for Jason (January 2002 to December 2004). We use the 1Hz data which provide an along track ground resolution of about 6 km.
1.2. Data correction and selection
Due to the inhomogeneity in the mass distribution of the Earth, the altimetry measurements are corrected for the geoid height above the ellipsoid of reference (Fu & Cazenave 2001). For the ocean, the mean sea surface is usually used instead of the geoid, because both surfaces can be considered equal. For continental water bodies, however, the mean lake surface is not present in the GDR-Ms. We thus used first a low-resolution terrestrial geoid, deduced from geodetic data (Lemoine et al., 1998), and then averaged the data on the lake over the whole period of available measurements. This process removed all periodical and random fluctuations and produced a more precise mean lake surface estimate for 1993-2004. This mean lake level obtained for the Big Aral was then used to estimated monthly averaged Aral Sea level.
Figure 2
Environmental and geophysical corrections of the altimeter range measurements relevant to the Aral Sea were applied. The corrections include ionospheric, wet and dry tropospheric, solid Earth tide and pole tide corrections, sea state bias, and correction for the satellite’s centre of gravity. We neglected the corrections specific to the open ocean such as ocean tide, ocean tide loading, and inverted barometer effect.
To insure that the observations are not over land (that would otherwise contaminate the measurements), we did a geographical selection of data, taking into account the location of the instantaneous measurements with respect to the Big Aral coastline. For the Big Aral there is an additional difficulty related to the continuous displacement of the coastline due to the drying up of the sea. To solve this problem, we used a two step iterative processing: first computating the instantaneous lake coastline using the lake level data in combination with a dedicated digital bathymetry model (see section 1.4), and then used a geographical selection of the altimeter measurements to account for the variable coastline.
1.3. Precision of altimetry measurements over the Aral Sea.
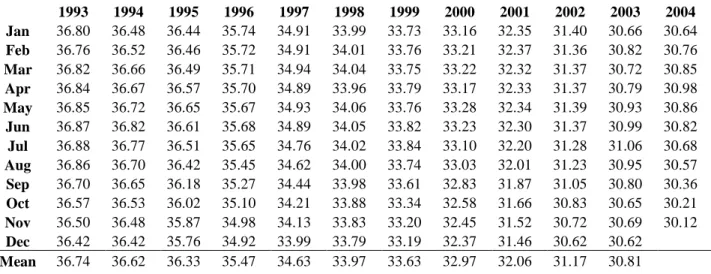
Our determinations of the mean monthly values of the lake level above the EGM96 geoid (for the period 1993-2004) are presented Table 1. In order to tie these values to the existing historical time series (referred to the Baltic sea level) a constant value should be added. We compared our average annuals level of the Big Aral relative to the Baltic Sea levels from 1960 to 2002 that have been recently published (Ashirbekov 2003). We obtained a mean difference (altimetry versus Baltic sea level) of -8cm +/- 17 cm (see table 3).
An exhaustive error budget for altimetry technique over continental water bodies like lakes has been done in (Birkett 1995), where the authors stated that the mean lake level can be determined
with an uncertainty of around 4 centimeters, depending on the availability of some corrections that must be applied to the range altimeter measurement.
The RMS error estimated for our observations shows that for the Aral Sea the errors should be larger then 4 cm. One of the reasons is that the presence of snow and ice during winter in the Big Aral (Kouraev et al., 2003, 2004) generates additional errors in the height measurements, since the reflection of the altimeter signal in the ice differs significantly from the reflection over open water. The existing T/P ocean retracking algorithm is not designed to process the return waveform from ice and this affects the precision of the determination of the altimetric height. Standard deviation for each set of sea level measurement (every ten days in case of T/P) show that the error bar should be about 6 centimeters, which could represent an uncertainty of about 1.5 km3 in the estimation of volume of the Big Aral at the present level.
Table 1
1.4 Surface and volume from Digital Bathymetry Model (DBM)
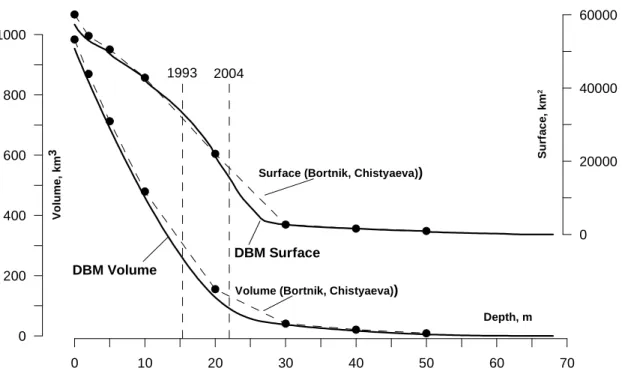
In order to obtain surface and volume for any given sea level mark and construct time series of variations of surface and volume of the Big Aral, we developed a dedicated Digital Bathimetry Model (DBM) of the Aral Sea. We constructed the DBM by using bathymetry data and isobaths contours from the map of the Aral Sea (scale 1: 500 000). Lake bathymetry locations were transformed from degrees onto kilometers, assuming that the length of 1 degree in latitude is 111.15 km and 1 degree in longitude is 78.15 km (Geographical atlas, 1985). These data were interpolated onto a regular grid with a 250 m spatial resolution. Sea surface and volume were calculated for each level mark from 0 to 62 m with a 0.5 m time step (Table 2 and Figure 3).
Figure 3
We compared our results with existing assessments of surface and volume (see Fig. 2) for various parts of the Aral Sea (Nikolaeva, 1969, cited from Bortnik, Chistyaeva, 1990). These historical assessments were made for sea depths (with zero depth at +53 m mark) at 0, 2, 5 m and then from 10 m to 50 m with 10 m depth resolution. For the Big Aral Sea, our results compared well with these. For depths from 0 to 20 m the differences in volume do not exceed 20-30 km3 (less than 4% of absolute values), for deeper marks the difference ranges 3-4 km3. From 0 to 20 m the difference in surface values rapidly decreases from 2700 to 700 km2 (from 5 to 2%), for 30-50 m depths the difference decreases to 9-200 km2. These discrepancies may be related to the various initial data used, to the geographical selection of the region and to the calculation method. However, for the 15-25 m depth (which corresponds to the sea level for the period considered) these published estimates are given with a 10 m step resolution that also may lead to errors if linear interpolation is used between the given values. This is especially evident for the 10-30 m depth values for sea volume and for the 20-30 m depth values for sea surface. Thus, our estimations using digital bathymetry model provide, with significantly increased vertical resolution, more accurate and reliable values for the calculations of the contemporary water budget.
By combining satellite altimetry and DBM data we have obtained time series of variations of the volume and surface of the Big Aral Sea over the last 11 years, with high precision and high temporal resolution. Mean annual values of these and other parameters are presented in Table 3. we used these time series to better constrain the equation of water balance and to assess the coherence with in-situ hydrological data currently available. In the next section we present an assessment of various parameters of the water budget of the Aral Sea.
2. Big Aral Sea water balance
2.1. Water balance equation and its main components.
Usually the variation of volume for an enclosed water body results from differences between the volume of inflow and outflow water. For the Big Aral we can distinguish several components. Inflow is represented by the surface river runoff (R) , the rate of precipitation (P) multiplied by the instantaneous surface of the lake (S(t)), the underground water inflow (Gi) and the inflow of water from the Small Aral. The outflow part consists of the rate of evaporation (E) multiplied by the instantaneous surface of the lake (S(t)), and the underground outflow (Go).
While the construction of the dam in the Berg's strait had a significant influence on the water balance of the Small Aral (Aladin et al., 2005), its influence on the level of the Big Aral is not clearly assessed. In particular, no acceleration of desiccation of the big Aral was observed when the dam was installed and no additional inflow was detected when dam was destroyed. Satellite images (Landsat) however indicate a seasonal stream flow southwards, which is partly lost in the lowland south of Kokaral peninsula, while an other part (about 2-3 km3) flows to the East part of the Big Aral (Letolle et al., in press). We consider that the inflow from the Small to the Big Aral for the period of satellite altimetry observations is very small but should be included within the unknown contribution to the water balance equation which can thus be written as (Mason et al., 1994):
dV/dt = (R +Gi - Go) – (E - P)*S(t) + ε (1)
We now consider the existing data on the components of the water budget of the Aral Sea, their quality and applicability for establishing a detailed contemporary water balance
2.2. Evaporation and precipitation
The analysis of published studies on the Aral Sea shows that evaporation (E) and precipitation (P) are the least known components of the water budget and obtaining accurate values of E-P is still a
significant issue even on an annual time scale. We have based our analysis on three recent articles (Bortnik 1999, Small et al., 1999 and Benduhn & Renard 2003). Bortnik (1999), provides a table with average values for E and P for every decade from 1960 to 1990, and also a figure of inter-annual evolution of these parameters. The average decadal rate of precipitation is between 110 and 143 cm/year, while for evaporation this value varies from 968 to 1050 cm/yr. No specific secular trends have been observed for these parameters in this article.
In (Small et al., 1999) the authors computed E and P by inverting a simplified water balance equation. Their approach assumes negligible underground budget (Gi-Go) and, because they did not have access to the variations of sea volume, considers instead only level variations. Using sea level variations over the period 1988-1992, and runoff for Syr Darya and Amu Darya, they computed a set of monthly data for the term E-P. Then they compared these data with the values they obtained from the evaporation model based on sea surface temperature (Small et al., 1999, 2001) and precipitation data from (Legates and Wilmott, 1990) . The values they obtained varied between 210 and 250 cm/yr for precipitation and 790 to 1220 mm/yr for evaporation.
Benduhn and Renard (2003) have proposed another kind of computation. For the precipitation they used the data given by Bortnik (1999), but for evaporation they used the classical Penman formula which depends on various parameters including salinity, temperature, etc and takes into account the impact of salinity variability on the evaporation rate which tend to decrease when salinity increases. The annual evaporation computed by these authors was around 1180 mm/yr at the end of the 1980s (for salinity around 35 ppt) and 1140 mm/yr at the end of the 1990s (for salinity close to 90 ppt).
However none of these published sources can provide a realistic amount of precipitation and evaporation in the frame of our study. Bortnik (1999) gave only average data without seasonal variations of P and E and didn’t take into account the evolution of both parameters related to
climate change and high salinity change during the last decade. Small et al. (1999) gave an assessment of seasonal evolution of precipitation and evaporation for 1988-1992. Later on, Small et al., (2001) also suggested that from 1960 to 1990, E-P had increased to around 150mm/yr, mainly due to direct effect of global warming (around 100mm/yr) and to positive feedback of the desiccation itself (for around 50 mm/yr which correspond to almost 4 km3/yr inflow to the Big
Aral). The influence of these phenomena should have further increased during the last ten years, largely due to the increase in temperature, but no assessment of this influence has been made so far.
Moreover, Small et al. (2001) based their analysis on the data prior to the separation of the Big and Small Aral (when salinity was around 30 ppt) and did not take into account the very high and non-homogeneous recent increases of salinity of the Big Aral. Even if salinity measurements in the Big Aral Sea are sparse and not well assessed, it is known that salinity has reached in 2002 more than 80 ppt (Zavialov, et al., 2003) in the western part and around 100 ppt to 120 ppt in the western part in 2001 (Mirabdullayev et al., 2004). Due to continuous drying up of the Big Aral it should continue to increase. This extremely high salinity should have for consequence a proportional decrease of evaporation (Benduhn & Renard, 2003). Finally, Benduhn & Renard (2003), presented an analysis of the effect of salinity on evaporation but didn’t give the seasonal variability of these parameters, and didn’t take into account the effect of global warming of the last ten years which tend to increase the evaporation.
Earlier studies also have used data for precipitation collected before 1990 that do not correspond to the period of our analysis (1993-2003). As a consequence, no series of inter-annual fluctuations of E-P exist for this period. Furthermore, none took into account the influence of ice cover on the evaporation. Every year the Aral Sea is covered by ice for several months and ice presence may affect strongly evaporation during winter time. In situ data on ice cover for the Aral Sea are not available since the mid-1980-s. However, our recent research (Kouraev et al., 2003, 2004) shows
that a combination of active and passive satellite microwave data gives the possibility to estimate ice cover extent and dates of ice formation and break-up in the Big Aral Sea. This provides a basis for estimating the influence of ice cover on evaporation rate and is one of the points for our future research.
The cumulating errors of assessment of evaporation and precipitation rate for which direct measurements don’t exist over the Aral Sea, at least for the last years, largely contribute to the budget error in the water balance equation: influence of regional climate change, increase of salinity, and presence of ice cover induces large uncertainties in the E-P term used in the equation of the water balance.
Because various authors provide different values for precipitation we considered several values of mean annual evaporation and precipitation (see table 3) in our calculations. We took the maximum and minimum values provided in the literature for both evaporation and precipitation, and then performed a sensitivity study of the impact of this uncertainty on the water balance equation by varying E and P within the indicated range.
2.3. River discharge
For the Amu Darya river runoff (R) we have used mean monthly runoff values (Figure 4) measured at Kizildgar (also written as - Kiziljar and Kyzljar), which is located several tens of kilometers upstream of the mouth of the delta. These data are available from January 1956 up to December 2000 on the web site (http://water.freenet.uz/post/amu/kizil.htm). These measurements are made far upstream from the Big Aral itself, and it is very difficult to estimate how much water actually reaches the Aral Sea, as noted by (Small et al., 1999, 2001). Part of the water runoff measured at the gauge point may be lost between the observation point and the sea (due to evaporation and infiltration), or may eventually reach the sea as underground water but with a significant time lag. This uncertainty increases the error in water balance estimations.
Figure 4
Our results for the Small Aral Sea (Aladin et al., 2005) with the Syr Darya river runoff show that around 20% of the water is lost within the Syr Darya delta before it reach the sea. Although this result is not directly applicable to the Big Aral case, it provides an of the order of magnitude estimate of the possible error in this parameter for the water balance equation. If we consider that the average annual runoff of Amu Darya over the period 1993-2000 is around 9 km3/yr (with high inter-annual variability: from 0 to 20 km3/yr) we can assume that, in the worst case, the error on this parameter can amount to 1.8 km3/yr.
We have also compared these monthly data with the published mean annual runoff of Amu Darya at Kizildgar from 1959 to 1995 (Zholdasova 1999) for the period of overlap: 1974 to 1995. For these 22 years we obtained a mean difference of 0.6 km3/yr between the two sets of runoff data. By adding this uncertainty to the errors associated with the losses in the delta, and the uncertainty associated to the Syr Darya runoff (2-3 km3), we have error budget of the Amu Darya runoff which amounts to 3 km3/yr.
At least, in contrast to the E-P term, we have a reliable dataset for the inter-annual and monthly fluctuations of the Amu Darya river for almost the entire analysis period.
2.4. Underground discharge
The underground water discharge and outflow is an unknown parameter that is usually neglected in the water balance of the Big Aral, mainly because no reliable information is available. There are very few accurately assessed and / or published data about the hydro geological situation beneath and around the Big Aral that could be used to construct a realistic model of underground discharge into the Aral Sea.
However, it should be noted that many in situ visual indications indicate that underground water could be present in the region of the Aral (presence of reeds, or the remains of trees from ancient time). Based on the "negative correlation between fluvial and groundwater discharge", Benduhn and Renard (2003) also suggested that the amount of underground water that follows the Amu Darya delta plain is probably not negligible. Indeed, in Tsche-Bas Bay the biodiversity is higher than in the rest of the Big Aral. This could be associated with a freshening of the water in these areas by an inflow of the underground freshwater from beneath the cliffs of theUstjurt plateau. This fresh water input provide favourable conditions for the development of benthic organisms. For example, samples taken from Tsche-Bas Bay in Autumn 2002 and 2003 contain a large variety of zoo-benthos.– These include not only species of Caspiohydrobia, Chironomidae and euryhaline ostracod Cyprideis torosa which are also found at other sites in the Big Aral, but also some recent (Abra ovata) and ancient (Cerastoderma isthmicum) invaders. Also the presence of Abra ovata juveniles in the Tche-Bas bay suggests continuing reproduction of this species. Evidence of freshwater inflow from the Ustjurt Plateau has also been found at Cape Aktumsyk (Radjabov, Tahirov, personal communication).
The presence of significant underground water reserves does not necessarily imply a large supply of water into the Big Aral Sea. Any assessment of the underground water transport through the delta plains, the bottom sediments, the deep aquifer, or along the south-western cliffs of the Ustyurt plateau needs to be complemented by in situ measurements which are presently unavailable. Thus, we consider that the underground discharge is an unknown parameter. We have made an assessment of the amount of underground discharge, using an inversion of equation (1) and an inverse least square adjustment. We also estimate the order of magnitude of possible errors within the Big Aral water budget, including uncertainties in the assessment of underground water inflow.
Satellite altimetry observations of the Big Aral sea level and estimations of the sea surface and volume from satellite and DBM data provide unique and important information for water budget studies. It is now possible to assess the water balance for the Big Aral with a much higher precision than was possible in previous studies. We have performed a detailed analysis of the water balance in order to estimate the uncertainties associated with the main constituents of the water budget, to estimate the influence of errors, and to analyse potential future developments within the Big Aral sea.
We have rewritten equation (1) as:
Uw +
ε
= dV/dt - R+ (E-P)*S(t) (2)where Uw is the underground balance (Gi-Go) and ε is an additional contribution related to the uncertainty in the assessment of other parameters of the water balance equation (1).
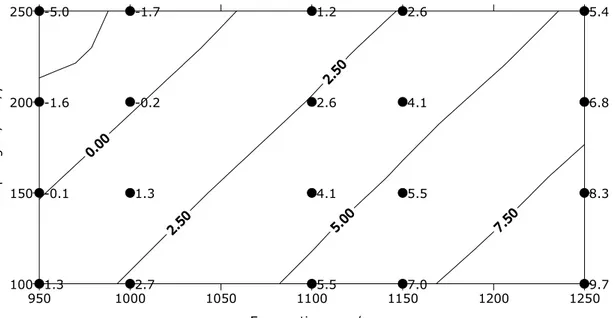
The components dV/dt and R are known (on a 10 day temporal scale for V and on a monthly scale for R). To take into account the uncertainty on the E-P component of the water budget, we choose 20 sets of E and P values ranging from typical low to high values from (Bortnik 1999; Small et al., 1999; and Benduhn & Renard 2003). For each E and P value we have then inverted equation 2 using altimetric data for the variation of volume and surface of the lake, and surface runoff values for the Amu Darya. The results of each inversion are shown in Figure 5.
Figure 5
These values need to be interpreted in relation to the sum of the errors of the river runoff, of the error in the volume variation measurements, and of the possible underground water fluxes. For the river runoff, we have estimated that the errors are in the range of 3 km3/yr, while for the volume variation the error is around 1.5 km3/yr (see sections 2.3 and 1.3). According to standard error theory the total error of our computation is around 3.3 km3/yr. Residual error (Figure 5) depends
on the errors in the evaporation and precipitation rates. If the evaporation is high (that is the effect of global warming is higher than the reduction due to the high salinity) then to close the water budget we would require significant underground water inflow - from 0 to about 6-7 km3/yr depending on the value of annual precipitation. In the low evaporation scenario (preponderant effect of salinity over evaporation ) underground water inflow is negligible (Figure 5), or does not even exist: in this case the left side of equation 2 can only be explained by the errors in the river runoff and volume measurement errors.
The recent study by Bendhun and Renard (2003) estimate a medium evaporation rate over the Aral Sea for the 1990s of about 1150-1160 mm/yr. In this case we would have an underground contribution of about 0 (for high precipitation rate) to around 3-4 km3/yr (for low precipitation rate). This value of underground inflow seems reasonable, especially considering external observations (presence of reeds and an unexpected large number of benthos species along the west coast of Big Aral).
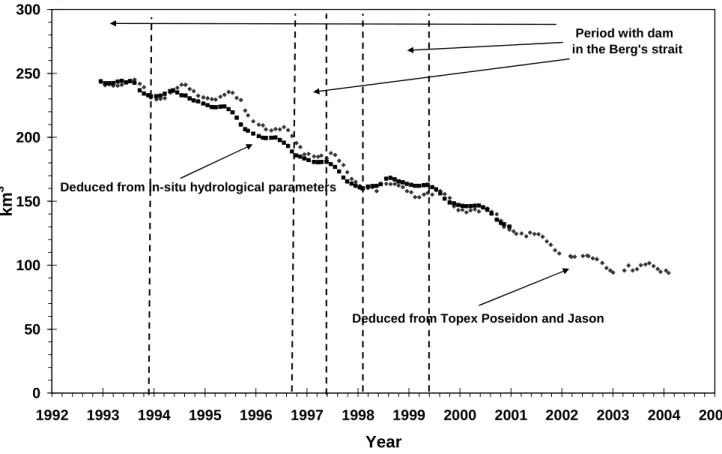
Figure 6 shows the variations of volume deduced from hydrological in situ data and estimates of the underground discharge based on the results listed on Figure 5. Superimposed are the variation of volume deduced from altimetry measurements and a bathymetry map. The annual oscillations of the Aral Sea deduced from hydrology are in good agreement with those deduced from altimetry measurements. This is also good agreement in the long term evolution from equation (1) but a significant disagreement remains for the years 1995-1996 which we can’t explain.
This issue must be investigated further. However without better data on evaporation and precipitation, as more accurate runoff data, our results in Figure 6 indicate that we need to be cautions in assuming a significant effect of underground water.
3. Future evolution of the Big Aral Sea.
After establishing the water budget for the Big Aral Sea with as much precision as possible, we wish to estimate the future evolution of the Big Aral for different climate scenarios based on varying the evaporation, precipitation and underground inflow data. We assume that the discharge of the Amu Darya is zero. We chose three typical scenarios based on values presented in Table 3. In the first (“dry”) scenario we imposed high evaporation (1250 mm/yr) and low precipitation rates (100 mm/yr), giving high underground water inflow (7 km3/yr); in the second (“medium”) scenario we chose medium values for evaporation (1150 mm/yr) and precipitation (200 mm/yr) and underground water inflow of 2 km3/yr; and for the third (“wet”) scenario we took into account
low evaporation (1000 mm/yr) and high precipitation rates (200 mm/yr) and no underground water inflow.
Projecting these constant values into the future, and using the relation between sea level, surface area and volume from DBM, we have estimated that, for the “wet” scenario, the level of the Big Aral Sea will first decrease and then stabilise after 15 years at +27 meters and with a surface area of around 6000 km2. For the “medium” scenario our computation shows that the level will stabilise
after 70 years at +19 meters with a surface area of only 2000 km3. In the case of the “dry” scenario, the Big Aral will become completely dry after 30-40 years. Even if some underground water could supply the Big Aral, the sea level would inevitably fall to a “dried yp” equilibrium level. This equilibrium level is not predictable, because it also depends on future surface runoff. So continued desiccation of the Big Aral is thus almost assured. In a few years, its water area will inevitably be divided into at least 3 parts: Tsche-Bas Bay will soon be separated in the north; a deep basin will be formed in the west and a shallow water body in the east. The shallow eastern part could dry up completely by 2010 or even earlier. The detached Tsche-Bas Bay will slowly become more saline, if underground freshwater inflow is significant. Nevertheless, sooner (2020) or later (2025), Tsche-Bas bay will become too saline, because low mineralized underground water
in arid climate lakes cannot compensate for the evaporation effects for a long time. The deepwater basin of the west will obviously exist the longest, because it has the largest water volume and the lowest area/volume ratio. In addition the deep basin has some subterranean inflow from the Ustjurt Plateau. However, year after year this last part of the Large Aral will become smaller and more saline until an equilibrum level be reached.
How will this impact on the evolution of the Big Aral Sea ecosystems? The rapid decline of the Big Aral Sea level has destroyed the delta of the Amu Darya. Unlike the delta of Syr Darya, where natural rehabilitation processes began after the dam was built, the rapid degradation of the Amu Darya delta continues. Indeed, Although the delta waters of the Syr Darya are regularly fed with fluvial waters, those of the Amu Darya do not receive regular flows. Thus the ecological situation in the south of the Big Aral is more at risk than in the northern Aral Sea.
In the future, before salinity increases to 200-300 ppt, there will only be euryhaline halophylic species, and their number will decrease as the salinity continues to increase. For the Zoo-plankton only the Artemia salina (A. parthenogenetica), which has invaded the Large Aral Sea and is abundant in some areasand may survive in the future. In the short term the Large Aral may become an important center for harvesting brine shrimp cysts for use in aquaculture which could provide some economic value (Letolle et al., 2005). As salinity will reach 300-350 ppt, only bacteria will survive.
Conclusions
Our results shows that a combination of satellite altimetry and a digital bathymetry modellind provides a robust technique for estimating the variability of sea level, surface area and volume, even for regions with poor ground monitoring networks. A combination of this information with
other water budget parameters offers a promising potential for assessing the temporal evolution of the water budget for enclosed water bodies.
Although satellite altimetry and DBM data introduce new and precise constrains into the water balance equation,
there still remain uncertainties in the water balance of the Big Aral Sea, associated with the assessment of evaporation, precipitation and underground inflows. Our results indicate that the underground water inflow maybe not be completely negligible. This conjecture however, needs to be assessed by hydrogeological modelling and more accurate data on evaporation and precipitation rates.
Even if it can be accurately established in future studies, the groundwater flow will likely only slow the desiccation of the Big Aral. To reverse the process or even to stabilise the sea level to the level of the mid 1990’s, would require more underground flow than could be supplied in even the most optimistic scenarios.
Restoration and rehabilitation of the Big Aral is practically impossible as it would require large inputs from both the Syr Darya and Amu Darya rivers which are currently diverted for irrigation. So the Big Aral will continue to desiccate. The only issue left to predict is the time needed to reach an equilibrium sea surface over the next years, under the hypothesis that no political decision will be taken to try to restore the Big Aral by reducing irrigation.
Acknowledgements. - The research was supported by the INTAS Project 00-1053. The authors
gratefully acknowledge Rene Letolle from the University Pierre et Marie Curie of Paris, Philippe Renard from the Center for Hydrogeology of University of Neuchatel, Nelly Mognard Campbell and Rosemary Morrow from Legos laboratory, Toulouse, and Ivan Savitsky from the University of information and technology of Tashkent. We would like to thank the Centre for Ocean Topography
and Hydrosphere (CTOH) at the LEGOS laboratory, Toulouse, France for providing the altimetry data.
References
Aladin N.V., Crétaux J-F., Plotnikov I.S., Kouraev A.V., Smurov A.O., Cazenave A., Egorov A.N., Papa F., 2005. Modern hydro-biological state of the Small Aral Sea, Environmetric, Vol 6, Issue 4.
Aladin N.V., Plotnikov I.S., Potts W.T.W., 1995. The Aral Sea desiccation and possible ways of rehabilitating and conserving its Northern part, Environmetrics 6, 17-29.
Ashirbekov U.A., Zonn I.S., 2003. Aral: the history of Dying Sea, Dushambe, IFAS.
Benduhn F., and Renard P., 2004. A dynamic model of the Aral Sea water and salt balance, Journal of Marine Systems,l 47, 35-50
Birkett S., 1995. Contribution of TOPEX/POSEIDON to the global monitoring of climatically sensitive lakes, Journal of Geophysical Research, Vol 100, No C12, pp 25,179-25,204.
Bortnik V. N., 1999. Alteration of water level and salinity of the Aral Sea, Creeping Environmental Problems and sustainable development in the Aral Sea basin, Cambridge University Press, pp 47-65.
Bortnik, V. N. & Chistyayeva, S. P, 1990. Gidro meteorologiya i gidrohimiya morey. (Hydrometeorology and hydrochemistry of seas.) Vol. VII: Aral Sea. Leningrad: Gidrometeoizdat.
Cazenave A., Bonnefond P., Dominh K., 1997. Caspian sea level from Topex / Poseidon altimetry: level now falling, Geophysical Research Letter, 24, 881-884.
Cazenave A., Bonnefond P., Mercier F., Dominh K., toumazou V., 2002. Sea level variations in the mediterranean Sea and Black Sea from satellite altimetry and tide gauges, Global and Planetary Change, 34, 59-86.
Fu L.L., and A. Cazenave, 2001. Satellite altimetry and Earth Science, a hand book of techniques and applications, International Geophysics Series, Vol 69, Academic press.
Geographical atlas, 1985. Fourth edition. Main Department of Geodesy and Cartography of the Council of Ministers, Moscow, 1985.
J. Jarsjö, G Destouni, 2004. Ground water discharge into the Aral Sea after 1960, Journal of Marine Systems , 47, 109-120
Kouraev A.V., Papa F., Buharizin P.I, Cazenave A, Crétaux J-F, Dozortseva J, and Remy F., 2003. Ice cover variability in the Caspian and Aral Seas from active and passive satellite microwave data. Polar Research, Vol. 22, No 1, p. 43-50.
Kouraev A.V., Papa F., Mognard N.M., Buharizin P.I, Cazenave A, Crétaux J-F, Dozortseva J, and Remy F., 2004. Sea ice cover in the Caspian and Aral Seas from historical and satellite data. Journal of Marine Systems, 47, 89-100.
Legates D.R., and Wilmott C.J., 1990. mean seasonal and spatial variability in gauges-corrected, global precipitation, Int J. Climatol., 10, 111-127.
Lemoine FG, Kenyon SC, Factor JK, Trimmer RG, Pavlis NK, Chinn DS, Cox CM, Klosko SM, Luthcke SB, Torrence MH, Wang YM, Williamson RG, Pavlis EC, Rapp RH, Olson TR, 1998. The Development of the Joint NASA GSFC and the National Imagery and Mapping Agency (NIMA) Geopotential Model EGM96, NASA tech publ 1998-206861. Greenbelt, Maryland, USA.
Letolle R., Aladin N, Filipov I., Boroffka NGO, 2005 , The futur chemical evolution of the Aral Sea from 2000 to the years 2050.Mitigation and Adaptation strategies for Global changes, 10, 51-70.
Mason I.M., M.A.J. Guzkowska, C.G. rapley, and F.A. Street-Perrot, 1994. the response of lake levels and areas to climate change, Climate Change 27, 161-197.
Mercier, F. 2001., Altimétrie spatiale sur les eaux continentales: apport des missions TOPEX/POSEIDON et ERS-1&2 а l'étude des lacs, mers intérieures et bassins fluviaux., PhD thesis, Université Paul Sabatier.
Micklin P. P, 1988. Desiccation of the Aral Sea, a water management disaster in the Soviet Union, Science, Vol 241, pp 1170-1176.
Mirabdullayev I.M., Joldasova I.M., Mustafaeva Z.A., Kazakhbaev S., Lyubimova S.A., Tashmukhamedov B.A. 2004. Succession of the ecosystems of the Aral Sea during its transition from oligohaline to polyhaline water body. Journal of Marine Systems, 47 , pp. 101-107.
Nikolaeva R.V. 1969. Main morphometric characteristics of the Aral Sea / In "The problems of the Aral Sea", Moscow, Nauka publishing, pp. 25-30 (In Russian).
Plotnikov I.S, Aladin N.V., Filippov A.A. 1991. The past and present of the Aral Sea fauna. Zool. zh. 70 (4), 5–15 (in Russian).
Small E.E, F. Giorgi, and Sloan L.C., 1999. Simulating the water balance of the Aral Sea with a coupled regional climate lake model, J. Geophys. Res., 104, pp 6583-6602.
Small E.E, F. Giorgi, L.C. Sloan, and Hostetler S., 2001. the effects of desiccation and climate change on the hydrology of the Aral Sea, Journal of climate, Vol 14, pp 300-322.
Zavialov P.O., A.G. Kostianoy, S.V. Emelianov, A.A. Ni, D. Ishniyazov, V.M. Khan, and Kudyshkin T.V., 2003. Hydrographic survey in the dying Aral Sea, Geoph Res lett., No13, Vol 30, 1659-1662.
Zenkevich L.A. 1963. Biology of the seas of the USSR, Izd. AN SSSR, Moscow (in Russian).
Zholdasova I., 1999. Fish population as an ecosystem component and economic objet in the Aral Sea basin, Creeping Environmental Problems and sustainable development in the Aral Sea basin, Cambridge University Press, pp 204-224.
Table 1: Monthly levels of the Big Aral (in meters above Geoid EGM96, (Lemoine et al., 1998) from 1993 to 2004 deduced from altimetry data from TOPEX/Poseidon and Jason-1 satellites.
1993 1994 1995 1996 1997 1998 1999 2000 2001 2002 2003 2004 Jan 36.80 36.48 36.44 35.74 34.91 33.99 33.73 33.16 32.35 31.40 30.66 30.64 Feb 36.76 36.52 36.46 35.72 34.91 34.01 33.76 33.21 32.37 31.36 30.82 30.76 Mar 36.82 36.66 36.49 35.71 34.94 34.04 33.75 33.22 32.32 31.37 30.72 30.85 Apr 36.84 36.67 36.57 35.70 34.89 33.96 33.79 33.17 32.33 31.37 30.79 30.98 May 36.85 36.72 36.65 35.67 34.93 34.06 33.76 33.28 32.34 31.39 30.93 30.86 Jun 36.87 36.82 36.61 35.68 34.89 34.05 33.82 33.23 32.30 31.37 30.99 30.82 Jul 36.88 36.77 36.51 35.65 34.76 34.02 33.84 33.10 32.20 31.28 31.06 30.68 Aug 36.86 36.70 36.42 35.45 34.62 34.00 33.74 33.03 32.01 31.23 30.95 30.57 Sep 36.70 36.65 36.18 35.27 34.44 33.98 33.61 32.83 31.87 31.05 30.80 30.36 Oct 36.57 36.53 36.02 35.10 34.21 33.88 33.34 32.58 31.66 30.83 30.65 30.21 Nov 36.50 36.48 35.87 34.98 34.13 33.83 33.20 32.45 31.52 30.72 30.69 30.12 Dec 36.42 36.42 35.76 34.92 33.99 33.79 33.19 32.37 31.46 30.62 30.62 Mean 36.74 36.62 36.33 35.47 34.63 33.97 33.63 32.97 32.06 31.17 30.81
Table 2: Morphometric parameter of the Big Aral Sea based on the Digital Bathimetry Model. Sea surface (S, km2) and volume (V, km3) for various depth marks (H, m). Depth mark 0 m
corresponds to +53 m absolute Baltic sea level (Kronstadt mark).
H V S H V S H V S H V S 0 953.3 57342 17 205.9 29786 34 27.9 2088 51 4.1 660 0.5 925.1 55810 17.5 191.3 28579 34.5 26.8 2034 51.5 3.8 623 1 897.5 54695 18 177.3 27405 35 25.8 1986 52 3.5 587 1.5 870.4 53754 18.5 163.9 26172 35.5 24.9 1941 52.5 3.2 555 2 843.7 52986 19 151.1 24924 36 23.9 1900 53 2.9 524 2.5 817.4 52339 19.5 139.0 23581 36.5 23.0 1859 53.5 2.7 496 3 791.3 51818 20 127.6 21307 37 22.0 1819 54 2.5 469 3.5 765.5 51321 20.5 117.4 19682 37.5 21.1 1780 54.5 2.2 444 4 740.0 50845 21 107.9 18327 38 20.3 1740 55 2.0 421 4.5 714.7 50367 21.5 99.0 16962 38.5 19.4 1701 55.5 1.8 398 5 689.7 49321 22 90.9 15539 39 18.6 1662 56 1.6 377 5.5 665.2 48503 22.5 83.5 13992 39.5 17.7 1623 56.5 1.4 357 6 641.1 47853 23 76.9 12313 40 16.9 1585 57 1.3 336 6.5 617.4 47252 23.5 71.1 10851 40.5 16.2 1546 57.5 1.1 316 7 593.9 46645 24 66.0 9643 41 15.4 1507 58 0.9 296 7.5 570.7 45986 24.5 61.5 8558 41.5 14.6 1467 58.5 0.8 276 8 547.9 45352 25 57.5 7461 42 13.9 1425 59 0.7 257 8.5 525.4 44716 25.5 54.0 6469 42.5 13.2 1381 59.5 0.5 238 9 503.2 44060 26 51.0 5382 43 12.5 1334 60 0.4 219 9.5 481.3 43370 26.5 48.6 4343 43.5 11.9 1288 60.5 0.3 200 10 459.8 42119 27 46.6 3670 44 11.3 1245 61 0.2 181 10.5 439.0 41162 27.5 44.8 3432 44.5 10.6 1208 61.5 0.1 151 11 418.6 40358 28 43.2 3222 45 10.0 1179 62 0.1 116 11.5 398.7 39592 28.5 41.6 3043 45.5 9.5 1152 62.5 0.0 63 12 379.0 38852 29 40.1 2870 46 8.9 1125 63 0.0 16 12.5 359.8 38103 29.5 38.7 2771 46.5 8.3 1098 63.5 0.0 5 13 340.9 37345 30 37.3 2680 47 7.8 1071 64 0.0 1 13.5 322.5 36541 30.5 36.0 2597 47.5 7.3 1044 64.5 0.0 1 14 304.4 35685 31 34.7 2515 48 6.8 1017 65 0.0 1 14.5 286.8 34795 31.5 33.5 2435 48.5 6.3 990 65.5 0.0 0 15 269.6 33848 32 32.3 2356 49 5.8 963 15.5 253.0 32849 32.5 31.1 2281 49.5 5.3 936 16 236.8 31889 33 30.0 2212 50 4.8 746 16.5 221.1 30917 33.5 28.9 2147 50.5 4.5 700
Table 3 : Mean annual values of sea level (from satellite altimetry relative to the geoid and above the Baltic Sea level from Ashirbekov and Zonn 2003), morphometric parameters (obtained using DBM) and river discharge (from http://water.freenet.uz/post/amu/kizil.htm) for the Big Aral Sea
1993 1994 1995 1996 1997 1998 1999 2000 2001 2002 2003 Sea level, m (geoid) 36.74 36.62 36.33 35.47 34.63 33.97 33.63 32.97 32.06 31.17 30.81
Sea level, m (Baltic) 36.95 36.60 36.11 35.48 34.80 34.24 33.80 33.30 32.16 30.90 ..
Sea surface, km2 32100 31800 31600 29200 27200 25700 24700 22500 19500 17300 ..
Sea volume, km3 240 236 232 201 179 162 153 138 120 104 ..
Amu Darya runoff,
Figure captions
Figure 1: The Aral Sea. The Aral Sea coastline in 1966 (1), 1992 (2), 2002 (3) and TOPEX/Poseidon ground tracks (4) with their reference numbers.
Figure 2: Mean lake surface level as a function of latitude obtained from all Topex / Poseidon and Jason data over the 11 years (1993-2003) period.
Figure 3: Volume and surface of the Big Aral Sea according to (Bortnik and Chistyaeva, 1990) (thin black line with dots) and calculated using DBM (thick grey line). Dashed lines denote sea depth in 1993 and 2004. Depth mark 0 m corresponds to +53 m absolute Baltic sea level (Kronstadt mark)
Figure 4: Amu Darya river discharge (km3/month) at Kizildgar (data from http://water.freenet.uz/post/amu/kizil.htm).
Figure 5: Underground water balance and error term (left side of equation (2), in km3 for different values of precipitation and evaporation.
Figure 6: Variations of volume of the Big Aral Sea (km3) both from Topex / Poseidon and
thebathymetry model and from in situ data, after removal of residual errors depending on the value of (E-P) as given in Figure 5.
Figure 1 T/P 107 T/P 107 T/P 107T/P 107T/P 107T/P 107T/P 107T/P 107T/P 107 4 4 4444444 Cape Cape Cape Cape Cape Cape Cape Cape Cape Aktumsyk Aktumsyk AktumsykAktumsykAktumsykAktumsykAktumsykAktumsykAktumsyk
Plato Plato Plato Plato Plato Plato Plato Plato Plato Ust'yurt Ust'yurt Ust'yurtUst'yurtUst'yurtUst'yurtUst'yurtUst'yurtUst'yurt
Tsche-Bas Bay Tsche-Bas Bay Tsche-Bas BayTsche-Bas BayTsche-Bas BayTsche-Bas BayTsche-Bas BayTsche-Bas BayTsche-Bas Bay 46 North
46 North 46 North46 North46 North46 North46 North46 North46 North
58 East 58 East 58 East58 East58 East58 East58 East58 East58 East
Small Aral Small Aral Small AralSmall AralSmall AralSmall AralSmall AralSmall AralSmall Aral
2 2 2222222
Big Big BigBigBigBigBigBigBig Aral Aral AralAralAralAralAralAralAral
3 3 3333333 T/P 142 T/P 142 T/P 142T/P 142T/P 142T/P 142T/P 142T/P 142T/P 142 Amu Darya Amu Darya Amu DaryaAmu DaryaAmu DaryaAmu DaryaAmu DaryaAmu DaryaAmu Darya 43 North
43 North 43 North43 North43 North43 North43 North43 North43 North
1 1 1111111
Barsa-Kel'mes Island Barsa-Kel'mes Island Barsa-Kel'mes IslandBarsa-Kel'mes IslandBarsa-Kel'mes IslandBarsa-Kel'mes IslandBarsa-Kel'mes IslandBarsa-Kel'mes IslandBarsa-Kel'mes Island
50 km 50 km 50 km50 km50 km50 km50 km50 km50 km Aral'sk Aral'sk Aral'skAral'skAral'skAral'skAral'skAral'skAral'sk
Dam / Berg Strait Dam / Berg Strait Dam / Berg StraitDam / Berg StraitDam / Berg StraitDam / Berg StraitDam / Berg StraitDam / Berg StraitDam / Berg Strait
62 East 62 East 62 East62 East62 East62 East62 East62 East62 East
Bolshoy Bolshoy Bolshoy Bolshoy Bolshoy Bolshoy Bolshoy Bolshoy Bolshoy Sary-Chaganak Sary-Chaganak Sary-Chaganak Sary-Chaganak Sary-Chaganak Sary-Chaganak Sary-Chaganak Sary-Chaganak Sary-Chaganak
Bay Bay BayBayBayBayBayBayBay
Syr Darya Syr Darya Syr DaryaSyr DaryaSyr DaryaSyr DaryaSyr DaryaSyr DaryaSyr Darya
Figure 2
Mean lake level
-29 -28,5 -28 -27,5 -27 -26,5 -26 58,8 59 59,2 59,4 59,6 59,8 60 60,2 60,4 60,6 Latitude (deg) le v e l (m )
Figure 3 0 10 20 30 40 50 60 70 Depth, m 0 200 400 600 800 1000 Vo lu m e, km 3 0 20000 40000 60000 Su rf ac e, km 2 DBM Volume DBM Surface
Surface (Bortnik, Chistyaeva))
Volume (Bortnik, Chistyaeva))
Figure 4 0 1 2 3 4 5 6 1990 1991 1992 1993 1994 1995 1996 1997 1998 1999 2000 2001 Year Km 3
Figure 5 950 1000 1050 1100 1150 1200 1250 Evaporation, mm/yr 100 150 200 250 P re c ip it a tg io n , m m /y r 1.3 2.7 5.5 7.0 9.7 -0.1 1.3 4.1 5.5 8.3 -1.6 -0.2 2.6 4.1 6.8 -5.0 -1.7 1.2 2.6 5.4
Figure 6 0 50 100 150 200 250 300 1992 1993 1994 1995 1996 1997 1998 1999 2000 2001 2002 2003 2004 2005 Year k m 3
Deduced from Topex Poseidon and Jason Deduced from in-situ hydrological parameters
Period with dam in the Berg's strait