DETECTION D'ENDOMMAGEMENT DANS LES COMPOSITES PAR
VIBROTHERMOGRAPHIE ET RESONANCES LOCALES
DAMAGE DETECTION IN COMPOSITES BY
VIBROTHERMOGRAPHY AND LOCAL RESONANCES
Demy Philippe1, Golinval Jean-Claude1, Simon Daniel21 Département d'aérospatiale et mécanique, Université de Liège, Bât. 52/3, LTAS - Vibrations et identification des structures, chemin des Chevreuils 1, 4000 Liège, Belgique. pdemy@doct.ulg.ac.be , JC.Golinval@ulg.ac.be
2 V2i, 4 Boulevard de Colonster, 4000 Liège. D.Simon@v2i.be
Mots clés : vibrothermographie, thermosonique, délamination, composite, CFRP.
Keywords : vibrothermography, thermosonic, delamination, composite, CFRP.
Résumé
La vibrothermographie est une technique de thermographie active capable de détecter des singularités de type délaminage ou décollement dans un matériau composite comme les laminés en fibres de carbone très utilisés actuellement en construction aéronautique (CFRP). Les causes physiques du mécanisme d'échauffement interne, suite à l'interaction avec les ondes élastiques, peuvent être la friction, l'hystérésis viscoélastique ou encore la déformation plastique. La méthode est efficace également sur des géométries complexes et requiert uniquement que les deux faces internes du délaminage soient libres de vibrer.
Cette étude consiste à déterminer la relation entre l'échauffement observé et la fréquence d'une excitation sinusoïdale entre 8 et 27 kHz. Il apparaît clairement des pics d'échauffement pour certaines fréquences particulières. La comparaison avec les fréquences de résonance locale du défaut modélisé par éléments finis montre des similitudes avec l'apparition de certains de ces pics. Une étude expérimentale visant à exploiter la présence de ceux-ci montre l'intérêt d'un test vibrothermographique de type balayage rapide (chirp), dans l'optique de mettre sur pied un test court et fiable pour le contrôle non destructif de matériaux composites.
1 Introduction
Vibrothermography (abbreviated VT) is an active non destructive technique able to detect singularities like delamination, whether the defect internal faces are in contact or not. Under sonic or ultrasonic mechanical vibrations, a delamination may behave like an internal heat source due to friction between the rubbing faces and/or viscoelastic hysteresis heating in the defect area. Local plastic deformation losses are discarded provided the stress level is kept well within the point of yield [1-3]. Despite numerous finite element simulations and theoretical explanations, there is still a lack of understanding concerning the physics governing the heat generation mechanism and no definitive experimental validation of either theory has been presented and accepted to date to explain the source or sources of heat generation in vibrothermography [4-11].
The present article first focuses on the research of links or evidences concerning a dominant heat generation mechanism in polymer composite related to possible "local resonances" phenomenon produced on one side or the other of the delamination [12]; that is to say the resonances of one or the other laminated sub-plate created and delimited by the delamination. High stress concentrations due to the dynamic amplification at local resonance may be correlated with the presence of corresponding heating peaks observed on the surface right above the defect by an infrared camera. For this purpose,
rate versus frequency curve established by a series of consecutive short sine tests with a 200 Hz frequency interval. According to the comparison, vibration damping related to viscoelatistic effects are expected to play a significant role, especially when matching or close to a local resonance frequency.
Secondly, linear and logarithmic sine sweep and chirp testing results will be presented and discussed exploiting the presence of the specific peaks revealed in the spectrum.
Finally, it should be noted that this paper presents an alternative method to the common usage by the nature of the contact between the vibration transducer and the specimen. Indeed, vibrothermographic devices usually has a pneumatically-driven coupling system pressing the transducer against the sample. The hammering of the surface generates non linearities induced by the acoustic chaos. It follows that the coupling pressure has a strong influence on the detection efficiency and poor coupling creates unwanted heat in the vicinity of the contact. Moreover, the risk of damaging the composite is always present [13-16]. For the purpose of this study, reproducible pure sine testing are performed by the way of a rigid tip-specimen coupling obtained by the gluing of the specimen directly on the vibration transducer head (larger plates may rest on a vibration isolation material like Teflon pieces).
2 Experimental
setup
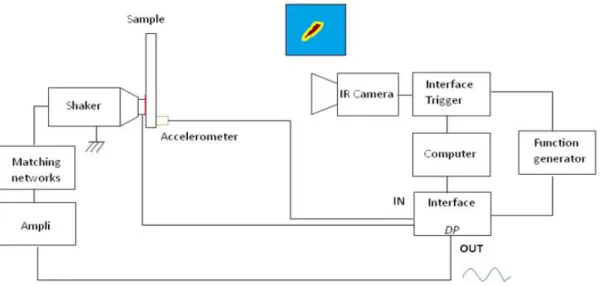
The measurement set-up used for this study is detailed in Fig. 1. A piezoelectric shaker (Wilcoxon model F7) is driven by a Data Physics (DP) interface. A thermal camera (50 mK NEDT, 8-14 µm range) is triggered at the DP start-up signal by a function generator. The excitation signal is monitored via a force sensor located in the shaker head. An additional vibration sensor or a laser vibrometer may be used to provide FRF's (Frequency response Function).
Fig. 1: Test setup
The CFRP (Carbon Fiber Reinforced Plastic) sample is an eight plies symmetric laminated plate [90/03]s, which contains a 25x25 mm Teflon® insert between the third and the fourth ply. The sample plate has been bounded to the shaker head with high performance cyanoacrylate glue. No other contact than this rigid coupling is produced on the plate. Note that for a short time testing, a little Kapton® tape may be placed on the plate at the location of the coupling, the shaker head being bounded to the tape.
This situation is different than usual VT setup which consists in pressing the excitation device by a controlled (or not) static force against the plate, causing some beneficial acoustic chaos but inducing major problems like non reproducibility or fretting of surfaces [13-15].
3
Laminated plate theory and finite element models
3.1 Local resonance model hypothesis
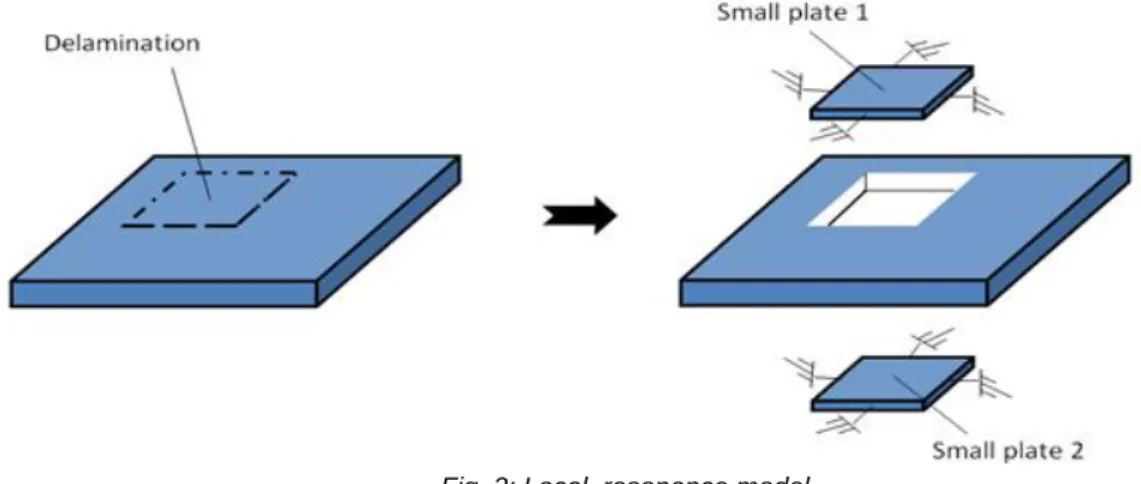
For sake of simplicity, delamination may be modelled as two separated small sub-plates, one on either side of the detachment, both free to resonate with their own dynamics but clamped together along the boundary, disregarding the remainder of the panel (Fig. 2). This idea has been first proposed by E.G. Henneke in 1990 [12]. Local resonances associated to the delamination may then be determined using the laminated plates theory and Hamilton's principle [17-18].
Fig. 2: Local resonance model
The boundary conditions in the delamination region would thus actually be "kinematical continuity" along the edges.
Although any forced response to an excitation signal may lead to internal heating caused by rubbing of the sub-plates, it can be expected higher heating rates at local resonances for which higher amplitude, stress and rubbing are involved in the phenomenon. Otherwise, the proximity of both sub-plates surely induces contact non linearities which are difficult to take into account.
3.2 Finite element models
In this section, modal analysis results obtained with the finite element software SAMCEF are first shown for a clamped laminated rectangular plate (FEM1). The square size of the delamination is 25 mm and the material properties of the tested composite, i.e. HexPly_6376C_HTS(12K)_10_35% are reported in Tab. 1.
CFRP orthotropic ply Index 1: fiber axis, 2,3: transverse axes
Young modulus E1 = 140 GPa, E2 =E3 = 9.2 GPa Poisson ratio Shear modulus Mass density Ply thickness 12 =13 = 0.335 G12 = G13 = 4.4 GPa = 1580 kg/m3 t = 0.268 mm 23 = 0.38 G23 =3.3 GPa
The mode-shapes obtained for a three plies [90/02] and a five plies [90/04] CFRP laminated sub-plate are presented in Fig. 3 for a frequency range up to 27 kHz.
Fig. 3: Three & five plies local resonances (FEM 1)
This model is clearly expected to be stiffer than in reality resulting in overestimated resonance frequencies. A second model (FEM2) consists to model the sample plate in free-free boundary conditions and to include only one of the sub-plate in the middle. Composite shells have been used in this case. (The results extracted from a lot of numerical modes containing also the complete sample plate resonances are provided in Fig. 4).
Fig. 4: Three & five plies local resonances (FEM 2)
Mean values will be used for comparison with experimental data and are summarized in Tab. 2. M(x,y) defines the frequency of the associated mode shape, with x along the fibre axis and y along the in-plane transverse axis.
3 plies sub-plate 5 plies sub-plate
M(1,1) M(1,2) M(2,1) M(2,2) M(1,1) M(1,2)
FEM 1 9.2 16.2 20.5 25.2 15.5 24.8
FEM 2 8.5 14.5 18.4 23.5 13.2 23.0
Mean value 8.9 15.4 19.5 24.4 14.4 23.9
Tab. 2: Local resonances frequencies summary [kHz]
4 Experimental
results
4.1 Heating rate peaks versus frequency
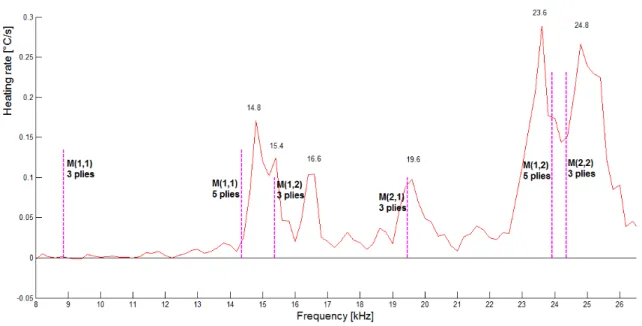
The comparison between modelling and experimental results is now investigated. The average temperature in a zone right above the defect area has been recorded during a four seconds time period. The heating rate has been determined by the root mean squares lines obtained at each sinusoidal testing by step of 0.2 kHz in the range 8 to 27 kHz. The results are given in Fig. 5 and are correlated with computed values from the local resonance model represented by dashed vertical lines.
Fig. 5: Heating rate vs. frequency
The curve reveals the presence of main heating peaks at 14.8, 15.4, 16.6, 19.6, 23.6 and 24.8 kHz. Five of them are very close to computed local resonances either from the three plies or the five plies laminated sub-plate. The peak at 16.6 kHz is still under investigation but could correspond to an anti-resonance of a sub-plate or another phenomenon happening on the sample plate.
It can be observed that the computed resonance frequency at 8.9 kHz does not correlate with an observed heating rate peak. It may be due to the fact that the shaker output response decreases significantly below 14 kHz (using constant five volts peak input voltage).
4.2 Sine sweep testing
It has been previously shown by step-sine testing that some frequency intervals exist in which the heating caused by delamination is higher. Based upon this observation, it seems interesting to exploit the presence of those heating peaks in order to develop a reliable and quick vibrothermographic test. To this purpose, a linear sine sweep testing has been first produced. The sweep has been performed between 14 and 27 kHz at a sweep rate of 433 Hz/s during thirty seconds. Due to thermal inertia effects, the temperature is continuously rising during the test as can be seen in Fig. 6.
Three bumps are clearly visible corresponding to the lower bound of the three well separated heating intervals identified in Fig. 5. The total temperature increase by accumulated heat trapped in the defect area by the composite material is about 2.5 °C.
A logarithmic sweep test has shown the same characteristics with more marked bumps and a total temperature increase of 2 °C (Fig. 7).
Fig. 7: Temperature increase during logarithmic sine sweep testing
4.3 Chirp excitation
The chirp is short duration signal consisting in a band-controlled fixed amplitude sine wave which has the form shown in Fig. 8.
Fig. 8: Time history and spectrum of a chirp signal
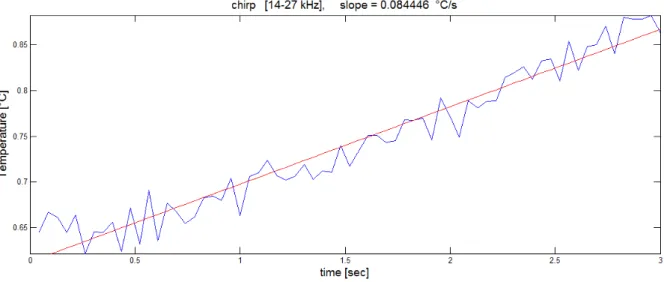
A periodic chirp input signal of forty milliseconds has been tested in the 14-27 kHz range. The temperature rise for a three seconds testing is presented in Fig. 9.
Fig. 9: Temperature increase during chirp test (3s)
The temperature increase in the defect zone is practically linear with a mean slope of about 0.084 °C/s. This value is slightly higher than the mean heating rates obtained for sine sweep testing (evaluated to 0.077 °C/s in the same range of frequencies).
This characteristic constitutes an advantage for the development of a quick vibrothermographic test procedure.
5 Conclusions
A local resonance model has been presented for the case of a rectangular delamination in a CFRP composite material. Two finite element models were proposed in order to determine the possible frequency resonances associated to the defect.
Most of the computed resonance frequencies are located very close to the highest heating peaks observed by the IR camera during step-sine testing of the sample. Those similarities are likely an indication of a significant role played by the viscoelastic hysteresis effects as heating source mechanism which should be taken into account in polymer composite numerical simulations, especially at frequencies close to local resonance frequencies of the delamination . Further investigations are in progress to attempt to bring out the local resonance phenomenon by the way of the experimental modal analysis. Also, collected data on both side of the specimen by vibrothermography could help in the evaluation of the relative roles played by the friction and hysteresis mechanisms.
Moreover, linear and logarithmic sine sweep testing performed on the sample have revealed the possibility to obtain a continuous heating during the sweep. Some bumps in the temperature curves may be associated to the presence of expected related resonance frequencies.
Excitation chirp signals have shown a better potential to exploit the presence of temperature peaks, which is very interesting when their associated frequencies are unknown.
Based upon the fact that in a practical case, the local resonances and associated viscoelastic hysteresis heating effects would depend upon the local geometry and depth of the damage region, consecutive short chirp tests covering adjacent frequency ranges should be considered advantageously for reliable and enhanced detection of delaminations by vibrothermography.
References
[1] J. RENSHAW, J. CHEN, S. Holland, R THOMPSON, « The sources of heat generation in vibrothermography », NDT&E International 44, pp736-739, 2011.
[2] KL REIFSNIDER, E.G. HENNEKE, WW. STINCHCOMB, « The mechanics of
vibrothermography», Mechanics of non destructive testing. New York: Plenum Press, pp249-276, 1980.
[3] F. MABROUKI, M. THOMAS, M. GENEST, A. FAHR, « Numerical modeling of vibrothermography based on plastic deformation », NDT&E International, vol 43, pp 476-483, 2010.
[4] F. MABROUKI, M. THOMAS, M. GENEST, A. FAHR, « Frictional heating model for efficient use of vibrothermography », NDT&E International, vol 42, pp. 345–352, 2009.
[5] S. HOLLAND et al., « Quantifying the vibrothermographic effect », NDT&E International, vol 44, pp775-782, 2011.
[6] R. MONTANINI, F. FRENI, « Investigation of heat generation sources in sonic infrared thermography using laser Doppler vibrometry », Proceedings QUIRT, 11th International Conference, Naples, 2011.
[7] A. SABOKTAKIN, C. IBARRA CASTANEDO, A. BENDALA, X. MALDAGUE, « Finite Element Analysis of heat generation in ultrasonic thermography », Proceeding 10th International Conference on Quantitative Infrared thermography, Québec, 2010.
[8] L J PIECZONKA et al, « Numerical simulations for impact damage detection in composites using vibrothermography », Materials Science and Engineering 10, IOP Conf. Series 012062, 2010.
[9] A. SALAZAR et al., « Characterization of delaminations by lock-in vibrothermography », Journal of Physics: Conference Series 214, 012079, 15th International Conference on
Photoacoustic and Photothermal Phenomena (ICPPP15), 2010.
[10] L.D. FAVRO, X. HAN, Z. OUYANG, G. SUN, R.L. THOMAS, « Sonic IR Imaging of Cracks and Delaminations », Analytical Sciences, vol. 17 Special Issue, 2001.
[11] C. HOMMA, ROTHENFUSSER M., J. BAUMANN, R. SHANNON, « Study of the heat generation mechanism in acoustic thermography », Review of Progress in Quantitative Nondestructive Evaluation, vol 25, pp 566-573, 2006.
[12] S.S. LIN , E.G. HENNEKE, « Analytical and Experimental Investigations of Composites Using Vibrothermography », Composite Materials: Testing and Design, vol. 9, pp. 417-434,1990.
[13] S.M. SHEPARD, T. AHMED , J.R. LHOTA, « Experimental Considerations in Vibrothermography », Proceeding SPIE Thermosense, 2004.
[14] X. HAN, W. LI, Z. ZENG, L.D. FAVRO, R.L THOMAS, « Acoustic chaos and sonic infrared imaging », Applied Physics letters, vol 81, n°17, pp 3188-3190, 2002.
[15] M. MORBIDINI, B. KANG, P. CAWLEY, « Improved Reliability of Sonic Infrared Testing », ME Technical paper, 2009.
[16] S. HOLLAND, « First measurements from a new broadband vibrothermography measurement system », Review of Quantitative Nondestructive evaluation, vol.26, pp. 478-483, 2007.
[17] J. ASHTON, J. WHITHNEY, « Theory of laminated plates », Technomomic publishing, Stamford, 1970.
[18] L. SHIAU, J. ZENG, « Free vibration of rectangular plate with delamination », Journal of Mechanics, vol.26, N°1, pp 87-93, 2010.