TOWARDS THE IDENTIFICATION OF A
NEIGHBOURHOOD PARK TYPOLOGY: A CONCEPTUAL
AND METHODOLOGICAL EXPLORATION
Présentée par :
Madeleine Bird
Département de médecine sociale et préventive
Faculté de médecine
MÉMOIRE PRÉSENTÉ À LA FACULTÉ DE MÉDECINE
EN VUE DE L'OBTENTION DU GRADE DE
MAÎTRISE ÈS SCIENCES
EN SANTÉ COMMUNAUTAIRE
AOÛT 2012
UNIVERSITÉ DE MONTRÉAL
FACULTÉ DE MÉDECINE
Ce mémoire intitulé :
TOWARDS THE IDENTIFICATION OF A
NEIGHBOURHOOD PARK TYPOLOGY: A CONCEPTUAL
AND METHODOLOGICAL EXPLORATION
Présentée par : BIRD Madeleine Elise
a été évalué par un jury composé des personnes suivantes :
Mme. KOUSHIK Anita, Ph.D., président-rapporteur Mme. DATTA Geetanjali, Ph.D.
directrice de recherche Mme. BARNETT Tracie, Ph.D.
codirectrice de recherche Mme. GAUVIN Lise, Ph.D.
DEDICATION
This thesis is dedicated to
ACKNOWLEDGEMENTS
This work would never have been completed without the help of several people to which I will be always deeply grateful.
Thanks to my husband, Roberto Pires Pinto, for your unyielding support and dedication to helping me strive in my academic endeavours. Thank you for your incredible help, for giving me confidence, for your encouragement and patience, for being by my side through stress and late nights, and for always defending my best interests. I love you and could not have come this far without you by my side. Andraea van Hulst, thank you for generously sharing your wise intelligence, experience and knowledge with me, and also thank you for sharing your deep and kind heart. I have had the pleasure of learning from you, and equally, of being your friend. Thank you for your endless generosity with your many talents – knowing you has enriched me on many levels, and I have gained so much from your friendship. Thank you, Tracie Barnett, for your always positive and enthusiastic support of my work and ideas, and for always helping me feel like I am making a contribution. Thank you also for your intellectual guidance and for helping me to look at my work critically and from different perspectives. Thank you for all the structural and financial support you provided me, all of which gave me opportunities to be in intellectually engaging and supportive environments. Geetanjali Datta, thank you for always steering me in the right direction, and for helping me with the big picture issues. Thank you for your intellectual guidance and support and for making sure I am thorough in all that I do. Thank you for listening to me and supporting me and for believing in what I can achieve. Thank you for being my biggest cheerleader. Thanks also, to all my family, and in particular to my mother, Liliane Mabson, my sister, Elena Bird, and my father, Kimbal Bird. Your unending love and support have always helped me to achieve my goals.
Finally, I would like to thank the Sainte-Justine UHC Foundation and Foundation of Stars Scholarship for financially supporting my research.
RÉSUMÉ
Peu d’études ont évalué les caractéristiques des parcs pouvant encourager l’activité physique spécifiquement chez les jeunes. Cette étude vise à estimer la fiabilité d’un outil d’observation des parcs orienté vers les jeunes, à identifier les domaines conceptuels des parcs capturés par cet outil à l’aide d’une opérationnalisation du modèle conceptuel des parcs et de l’activité physique et à identifier différents types de parcs.
Un total de 576 parcs ont été évalués en utilisant un outil d’évaluation des parcs. La fiabilité intra-juges et la fiabilité inter-juges de cet outil ont été estimées. Une analyse exploratoire par composantes principales (ACP) a été effectuée en utilisant une rotation orthogonale varimax et les variables étaient retenues si elles saturaient à ≥0.3 sur une composante. Une analyse par grappes (AG) à l’aide de la méthode de Ward a ensuite été réalisée en utilisant les composantes principales et une mesure de l’aire des parcs. L’outil était généralement fiable et l’ACP a permis d'identifier dix composantes principales qui expliquaient 60% de la variance totale. L’AG a donné un résultat de neuf grappes qui expliquaient 40% de la variance totale. Les méthodes de l’ACP et l’AG sont donc faisables avec des données de parcs. Les résultats ont été interprétés en utilisant l’opérationnalisation du modèle conceptuel.
Mots clés : cohorte QUALITY, parcs, activité physique chez les jeunes, environnement bâti, outil d’évaluation des parcs, analyse exploratoire par composantes principales, analyse par grappes
ABSTRACT
Few studies have characterized park features that may be appealing for youth physical activity (PA). This study assesses the reliability of a youth-oriented direct-observation park assessment tool; identifies park domains captured by the tool using an operationalized conceptual model of parks and PA, and identifies distinct park types.
576 parks were audited using a park observation tool; intra- and inter-rater reliability were estimated. Exploratory principal component analysis (PCA) was conducted and variables were retained if they loaded at 0.3 or higher. A cluster analysis (CA) was conducted using the principal components and park area. The tool was found to be reliable and PCA yielded ten principal components explaining 60% of the total variance. The CA yielded a nine-cluster outcome explaining 40% of the total variance. PCA and CA were found to be feasible methods to use with park data. The operationalization of the conceptual model helped interpret these results.
Keywords: QUALITY Cohort, parks, youth physical activity, built environment, park audit tool, reliability, exploratory principal component analysis, cluster analysis
TABLE OF CONTENTS
Dedication ... iii
Acknowledgements ... iv
Résumé ... v
Abstract ... vi
Table of Contents ... vii
List of Tables ... x
List of Figures... xi
List of Abbreviations and Acronyms ... xii
Introduction ... 13
Objectives ... 18
Chapter 1 : Literature Review ... 20
1.1. Relationships Between the Built Environment and Physical Activity Among Youth ... 20
1.2. Public Parks as a Population Health Approach to Increasing Physical Activity Among Youth 23 1.3. Natural Experiments: Results on Park Improvements to Increase Physical Activity ... 24
1.4. Parks, Physical Activity and Health ... 25
1.5. A Review of Direct-Observation Park Audit Tools ... 30
1.6. Conceptualizing Park Domains and Their Relationships to Physical Activity ... 38
Chapter 2 : Study Context and Methods ... 41
2.1. Study Context: The Quebec Adipose and Lifestyle Investigation in Youth (QUALITY) Cohort Study and the Residential Study ... 41
2.2. Sources of Data for the Residential Study ... 43
2.3. Study Contributions Made By The Author ... 44
2.4. Parks Tool Development, Identification, Observer Training and Data Collection ... 44
2.4.1. Parks, Activities and Recreation among Kids (PARK) Tool Development ... 44
2.4.2. Observer Training ... 46
2.4.3. Sampling Plan ... 48
2.4.4. Data Cleaning ... 50
2.4.5 PARK Tool Reliability Assessment ... 50
2.4.6. Identifying Park Area for Newly Identified Parks ... 52
2.4.7. Identifying the O3 Variable For Subsequent Analysis ... 52
2.6. Methods for the Operationalization of the Conceptual Model ... 53
2.7. Statistical Analyses ... 54
2.7.1. Reliability Estimates ... 54
2.7.1.1. Inter-Rater Reliability Using Percent Agreement ... 55
2.7.1.2. Inter-Rater Reliability Using Cohen’s Kappa Statistic ... 55
2.7.1.3. Intra-Rater Reliability ... 56
2.7.2. Principal Component Analysis ... 57
2.7.3. Cluster Analysis ... 59
Chapter 3 : Results ... 64
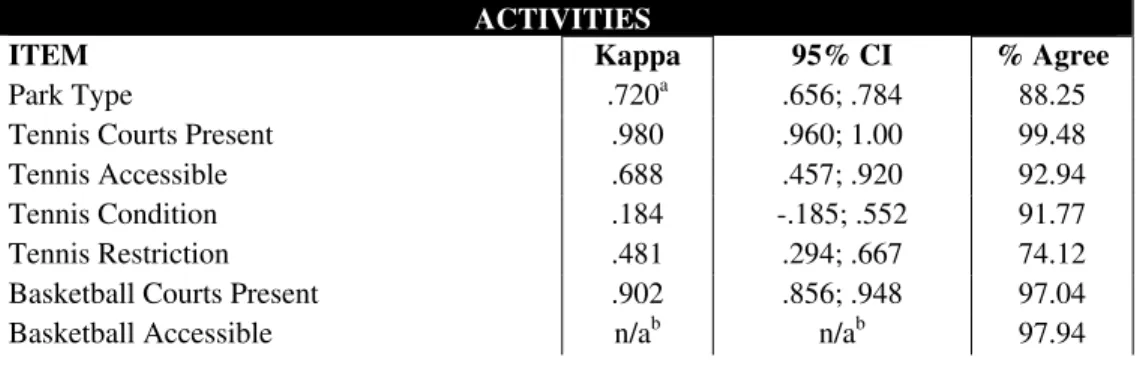
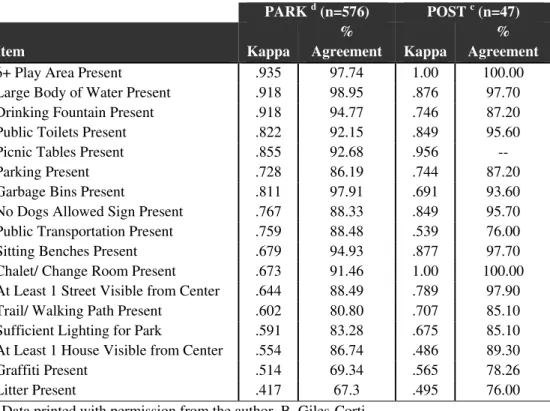
3.1. PARK Tool Reliability Assessment Results ... 64
3.1.1. Inter-Rater Reliability of the PARK Tool ... 64
3.1.2. Intra-Rater Reliability ... 67
3.1.3. Comparison of Kappa Results from Items on the PARK Tool and the POST ... 68
3.2. Parks Descriptions: An Overview of the Parks’ Characteristics ... 69
3.3. Results from the Operationalization of the Bedimo-Rung Conceptual Model ... 74
3.4. Results from the Exploratory Principal Component Analysis ... 83
3.5. Cluster Analysis Results ... 87
Chapter 4 : Discussion ... 91
4.1. Item Reliability and the PARK Tool ... 91
4.2. Operationalization of the Bedimo-Rung Model ... 96
4.3. Parks Identified On -Site ... 99
4.4. Principal Component Analysis ... 100
4.5. Cluster Analysis Results ... 104
Limitations, Implications for Future Research and Conclusions ... 108
Limitations ... 108
Implications for Future Research ... 110
Conclusions ... 111
Reference List ... 115
Appendix I ... i
The QUALITY Cohort ... i
Appendix II ... ii
Origins of Items on the PARK Tool ... ii
Appendix III ... v
Appendix IV ... x The Park Observation Training Manual ... x Appendix V ... liv
Example of a 500 m, 750 m, and 1000 m Walking Network Buffer Zone Around the Home of a QUALITY Participant ... liv Appendix VI ... lvi The PARK Tool Reliability Manuscript ... lvi
LIST OF TABLES
Table 1-I. Summary of Direct-Observation Park Tools Reviewed ... 32
Table 3-I. Kappa and percent agreement results for all items on the PARK tool ... 64
Table 3-II. Test-retest results for intra-observer reliability ... 67
Table 3-III. Comparison of inter-rater reliability of items shared between the PARK Tool and the POST ... 69
Table 3-IV. Frequency and percentage of park characteristics across all parks ... 71
Table 3-V. Sub-domain definitions from the Bedimo-Rung conceptual model and definitions from the operationalization of the Bedimo-Rung model ... 75
Table 3-VI. PARK tool item assignment to conceptual model domains ... 82
Table 3-VII. Principal component results ... 85
Table 3-VIII. Interpretation of the principal components, items, and their loadings ... 86
Table 3-IX. Matrix of components on park type ... 88
Table 3-X. Mean scores and standard deviation results for components describing park types ... 90
LIST OF FIGURES
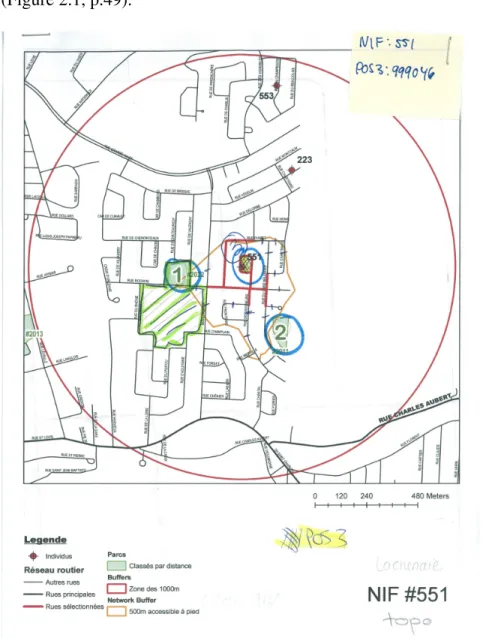
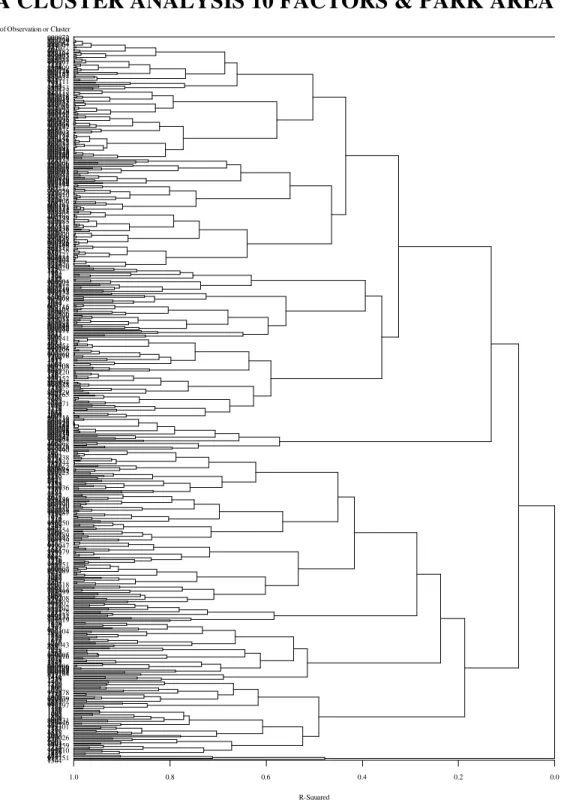
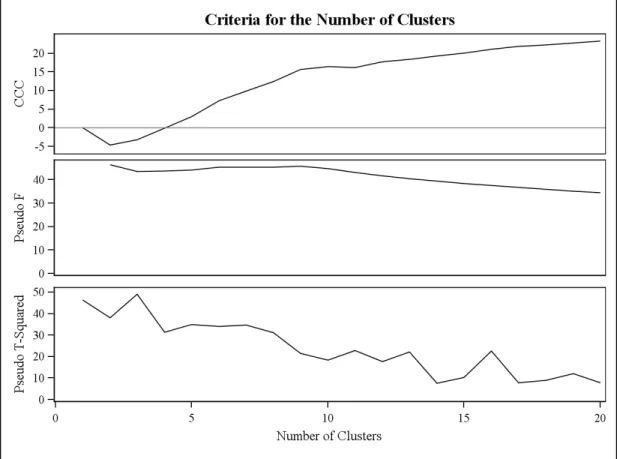
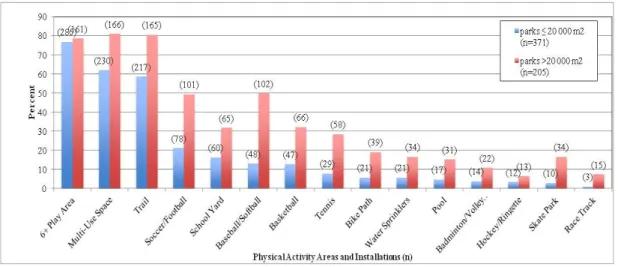
Figure 1.1. A reproduction of the Bedimo-Rung et al. conceptual model of park domains hypothetically associated with physical activity (Bedimo-Rung et al., 2005). ... 39 Figure 2.1. The found park, number 3, was drawn onto the map and a number 3 was circled beside it. This map shows that observers adjusted park boundaries to conform to the found park if it did not match that which was indicated on the map. The blank space is part of the image. ... 49 Figure 2.2. Flow chart of the four primary phases of the present study: data collection, tool reliability, operationalization of the Bedimo-Rung conceptual model, and creation of the park typology. The methods for each phase are detailed in this section, the methods chapter. ... 51 Figure 2.3. The cluster tree as an output from SAS. ... 61 Figure 2.4. The SAS output of the cubic clustering criterion, pseudo F, and pseudo t2 plots. These plots
are used to help determine the number of clusters in a cluster analysis. ... 62 Figure 3.1. Frequency of physical activity areas and installations across all parks by park size. ... 70 Figure 3.2. Frequency of park amenities across all parks by park size. ... 71 Figure 3.3. Frequency of parks that did not have signs of graffiti, litter or vandalism across all parks by size. ... 73 Figure 3.4. General impression items across all parks by size. ... 74 Figure 3.5. The operationalization of the Bedimo-Rung conceptual model ... 81 Figure 4.1. According to the Bedimo-Rung conceptual model, a park has different geographic areas that should be evaluated more or less distinctly (panel a). In the operationalization of the Bedimo-Rung conceptual model, parks were conceptualized as a whole, without distinct areas, and were evaluated as such (panel b). ... 98 Figure 4.2. Components assigned to domains from the operationalization of the Bedimo-Rung conceptual model. ... 102
LIST OF ABBREVIATIONS AND ACRONYMS
BE Built environment
BMI Body mass index
BRAT-DO Bedimo-Rung Assessment Tool – Direct Observation
CA Cluster analysis
CCC Cubic clustering criterion CPAT Community Park Audit Tool C-POST Children’s Public Open Space Tool
EARPS Environmental Assessment of Public Recreation Spaces GIS Geographic information system
MCMA Montreal Census Metropolitan Area
MEGAPHONE Montreal Epidemiological and Geographical Analysis of Population Health Outcomes and Neighbourhood Effects
MET Metabolic equivalent of task
MVPA Moderate to vigorous physical activity
PA Physical activity
PARA Physical Activity Resource Assessment
PARK Parks, Activity and Recreation among Kids Tool PCA Principal component analysis
PDA Personal Digital Agenda PEAT Path Environment Audit Too POST Public Open Space Tool
PSF Pseudo F
PST2 Pseudo t2
QUALITY Quebec Adipose and Lifestyle Investigation in Youth SES Socioeconomic status
INTRODUCTION
We ought to plan the ideal of our city with an eye to four considerations. The first, as being the most indispensable, is health.
Aristotle,
Politics (ca. 350 B.C.)
All parts of the body which were made for active use, if moderately used and exercised at the labour to which they are habituated, become healthy, increase in bulk, and bear their age well, but when not used, and when left without exercise, they become diseased, their growth is arrested, and they soon become old.
Hippocrates,
On the Articulations (ca. 460-377 B.C.)
Rationale: Overweight, Obesity and Physical Activity Among Canadian Youth
The prevalence of overweight and obesity among Canadian youth has increased significantly over the past 25 years. In 1978/79, 12% of Canadian children and youth between the ages of 2 and 17 were overweight and 3% were obese, for a combined overweight/obesity prevalence of 15% based on direct measures (Shields, 2006). In 2004, the prevalence of directly measured overweight increased to 18% and the prevalence of obesity to 8% for a combined overweight/obesity prevalence of 26% among the same age group of Canadian children and youth (Shields, 2006). Notably, it was the 12 to 17 years age group that primarily carried the burden of the increase; the prevalence of overweight/obesity almost doubled in this group over the previous 25 years (14%-29%) (Shields, 2006), highlighting the need to increase preventative measures prior to or around age 12. Obesity is associated with chronic health risks
during childhood that may last into adulthood (Biro & Wien, 2010) as well as cardiovascular disease in adulthood (Gunnell, Frankel, Nanchahal, Peters, & Davey Smith, 1998; Raitakari, Juonala, & Viikari, 2005). It is also associated with a high risk of developing health problems such as hypertension and type-2 diabetes, as well as some types of cancers (Larsson & Wolk, 2007, 2008; Lin et al., 2004; Moghaddam, Woodward, & Huxley, 2007; Yang et al., 2009). It can thus be stated fairly confidently that overweight and obesity in childhood should be considered a public health priority.
As the body mass index (BMI) among Canadian youth increases, fitness levels, measured by objective indicators of aerobic fitness, muscular strength, and muscular endurance and flexibility have decreased over 30 years (1981 – 2007/2009) (Tremblay et al., 2010). This trend is the same for all age groups and between both sexes in Canada (Craig, Shields, Leblanc, & Tremblay, 2012). As fitness levels are decreasing, studies are showing that youth are not meeting the recommended guidelines of 60 minutes of moderate-to-vigorous physical activity (MVPA) per day (Public Health Agency of Canada, 2011). The prevalence of physical activity (PA), defined as being compliant with Canada’s Physical Activity Guide to Healthy Active Living as well as daily energy expenditure classification values, was contrasted between urban Ontario and rural Albertan school aged children. Among this study population, the prevalence of PA was only 57% (Plotnikoff, Bercovitz, & Loucaides, 2004). Across Canada more generally, the situation appears worse: only 7% of
Canadian children aged 5-17 years meet the minimum recommended guidelines of MVPA per day (Statistics Canada, 2011a).
There are a number of identified determinants of overweight and obesity including socioeconomic status, ethnicity, immigration, environmental factors, diet and PA opportunities. These upstream and complex causes of obesity are largely outside of individual control and therefore necessitate a population level approach, especially considering the poor results of individual-level approaches for population level changes (Bedimo-Rung et al., 2005; Centers for Disease Control and Prevention, 2001). A lack of PA may be an important determinant of mortality. In the United States, the estimated number of deaths caused by poor diet and physical inactivity increased by 1.6% between 1990 and 2000, representing an increase of an estimated 65 000 deaths related to these two modifiable behaviours over ten years (Mokdad, Marks, Stroup, & Gerberding, 2004). Although tobacco-related deaths remained the number one cause of death in the United States, estimated deaths caused by poor diet and physical inactivity are increasing while estimated deaths from tobacco use are decreasing, providing further evidence that poor diet and physical inactivity are important and widespread preventable public health concerns (Mokdad et al., 2004). Statistics Canada reported that PA emerged as most strongly associated with obesity at the population level while controlling for age as well as health and behavioural determinants (Statistics Canada, 2011b). PA is increasingly being recognized as a key aspect to health, with some arguing that exercise should be considered a fifth vital sign for physicians to record in patient medical records (Khan et al., 2012).
Indeed, sedentary behaviours, such as screen time, have been found to be more prevalent among overweight and obese children than normal weight children globally, with sedentary children engaging in less MVPA than their less-sedentary counterparts (Janssen et al., 2005; Vos & Welsh, 2010). However, the nature of the relationship between PA and obesity is not always clear. One prospective cohort study suggests that a higher BMI may cause lower levels of PA and fitness among youth (Pahkala et al., 2012), rather than a lack of PA causing the overweight or obesity. Nevertheless, this same study found that children who lowered their BMI over time had the same fitness levels as children who had consistently lower BMIs, indicating the importance of increasing PA and fitness for youth with higher BMIs. Although the relationship between physical inactivity and obesity is uncertain, it is widely accepted and established that increasing PA is an effective treatment for weight loss (Department of Health, 2004).
The determinants of PA among youth are multifactorial and causal relationships are often difficult to identify (Mattocks, Ness, Deere, Tilling, & Leary, 2008; Tou & Wade, 2002). A review of primarily cross-sectional studies by Sallis, Prochaska and Taylor (2000) identified a number of determinants of PA in children and adolescents including demographic and biological determinants, psychological, cognitive and emotional determinants, behavioural attributes, social and cultural factors, as well as physical environmental factors. Variables that were found to have a consistently positive association with PA among children were the following: male sex; parent overweight; PA preference; intention to undertake PA; previous PA; healthy diet;
programs and facility access; and time spent outdoors. Perceived barriers to PA (unspecified) were negatively correlated with PA among children. One prospective cohort study found that maternal PA during pregnancy and parental PA when the child was 21 months old was associated with PA levels among their children later in life, at ages 11 to 12 years (Mattocks et al., 2008).
As the Canadian population becomes less fit at all ages, they are gaining less benefit from the health outcomes accrued by PA. As children become less fit and more overweight, a worrying trend toward an unhealthy and unfit population begins to emerge. This calls for increased attention into the promoters of, as well as the barriers to PA among youth. As mentioned above, it has been consistently demonstrated that time spent outdoors and access to PA facilities are positively associated with PA among children. This being so, it is still not clear what particular aspects of outdoor spaces are most or least attractive for youth. To begin to address this problem from a public health perspective, the determinants of PA among youth must be better understood. One way to begin to approach this problem is to characterize aspects of the built environment in which youth are most likely to be physically active so that later studies may assess whether specific characteristics could be amenable to interventions designed to promote PA in this population.
The benefits that public parks may provide for increasing physical activity among youth are still poorly understood (Bedimo-Rung et al., 2005; Cohen et al., 2010; Kaczynski & Henderson, 2007) and the relationship has traditionally been measured
in terms of geographic distance to parks via cross-sectional studies (Giles-Corti et al., 2005; Kaczynski & Henderson, 2007). Characteristics of the parks themselves are likely an important determinant of park use, yet they are only beginning to be described (Bedimo-Rung et al., 2005; Giles-Corti et al., 2005; Rung, Mowen, Broyles, & Gustat, 2011; Saelens et al., 2006). In addition, few studies have directly assessed physical features of parks important for PA (Cohen et al., 2010; McCormack, Rock, Toohey, & Hignell, 2010; Rung et al., 2011; Shores & West, 2008), with even less among youth. Given the potential health risks accrued by long-term obesity, children at risk for obesity and the built environment opportunities for PA in their surroundings deserves particular attention.
Objectives
Prior to understanding the relationship between park characteristics and PA, however, parks characteristics require further exploration, in particular as they appeal to youth. The objectives of this Master’s thesis are the following: 1) to assess the reliability of a youth-oriented direct-observation park assessment tool; 2) to identify the park domains captured by the audit tool in an exploratory manner, based on an operationalization of the Bedimo-Rung conceptual model of parks and PA (Bedimo-Rung et al., 2005), and; 3) to identify if there are types of parks that emerge based on the park domains and a cluster analysis.
The guiding research question is: Can distinct types of parks be identified using the Bedimo-Rung conceptual model of park characteristics and PA and if so, what defining features emerge that best describe the parks based on their characteristics?
This methodological work is being conducted in order to facilitate the operationalization of park characteristics to be used in future studies assessing the association between parks and PA among youth from the Quebec Adipose and Lifestyle Investigation in Youth (QUALITY) Cohort.
CHAPTER 1: LITERATURE REVIEW
The literature review will cover two main topics: (i) the state of the evidence regarding the built environment, parks and physical activity with a focus on youth, and (ii) a review of direct-observation park audit tools. A final sub-section will review a published conceptual model of park characteristics and physical activity that is subsequently used in the present study (Bedimo-Rung et al., 2005). The search strategy involved two primary approaches: an electronic database search as well as mining the bibliographies of selected articles for additional literature. Electronic search terms used were the following, in various combinations: public open spaces, parks, youth, physical activity, built environment, direct observation, evaluation, audit tools, obesity, and health outcomes. The databases Medline (Ovid), PubMed and PsychINFO were used. Searches were limited to peer-reviewed articles and there was no limit to the years of publication included, however the majority of articles found were published in the last 10 years.
1.1. Relationships Between the Built Environment and Physical Activity Among Youth
As outlined in the introduction, the determinants of youth PA are complex and multifactorial. One aspect of these determinants, the built environment (BE), is being recognized as an important focus in efforts to increase PA. For example, a position paper from the Committee on Environmental Health (2009) declared that neighbourhoods and communities can provide opportunities to help reduce overweight among youth by focusing on or developing parks and open spaces. A
growing body of literature on various facets of the BE and PA among youth is helping to provide a more detailed picture of the relationship between these factors. Organized programmes in parks and recreation centres may be an important facilitator for PA among youth and park users (Cohen et al., 2009; Cohen et al., 2010; Moody et al., 2004), and perception of easy access to parks is associated with greater activity among youth than those who perceive parks as inaccessible (Timperio, Crawford, Telford, & Salmon, 2004), evidence that supports the rationale behind continued research on the relationships between parks, park characteristics, and physical activity among this vulnerable population. One study, in which PA was prescribed to children as an intervention, found a positive relationship between PA and living near a large community park (43 hectares) as opposed to children from the same intervention study who did not live near a park (Epstein et al., 2006). In another study, healthy weight status among children, which may be an indicator of adequate levels of PA, was not found to be associated with any of the three park proximity measures assessed: number of parks within 1000 m of home, total area of parkland within 1000 m, and distance to the closest park from home. However, PA was associated with a specific park feature, notably the availability of a park playground within 1000 m of home (Potwarka, Kaczynski, & Flack, 2008), suggesting that popular measures of park access, specifically proximity and number of parks, may be too crude to capture relevant determinants of park-related PA among youth. For adolescents, the importance of access to a safe park for regular PA may be moderated by the level of urbanicity (Babey, Hastert, Yu, & Brown, 2008), with access to safe parks being important for PA among adolescents in urban but not rural areas.
McCormack and colleagues (2010) conducted a review of qualitative research studies that examined the characteristics of urban parks that are associated with park use and physical activity. Data were primarily gathered using semi-structured interviews with individuals or in focus groups among frequent park users. Overall, features that were found to be attractive for PA among youth in parks were areas or installations that supported active and passive recreational activities, playgrounds and trees, as well as amenities such as barbeques, seating, water fountains, picnic tables and toilets. The presence of shade and appropriate placement of shade-providing devices were also important. Those aspects that negatively affected park use were play structures that were age-inappropriate or not mentally or physically stimulating. Cleanliness and characteristics of playing surfaces were found to be important among youth as well as aesthetics and a sense of enjoyment of fresh air. In terms of aesthetics, graffiti and vandalism were found to discourage park use. For younger children, the presence of older children and teenagers was a safety concern, as well lighting features, the presence of law-enforcement, surveillance, secluded paths and areas, and the presence of homeless people and drug users/dealers. For girls, who tend to use parks and recreation centres less, and tend to be less physically active than boys (Moody et al., 2004; Sallis et al., 2000), a social component of parks was mentioned as being attractive – that is, parks are attractive for girls because they are able to meet their friends away from adults. Indeed, Rodríguez, Cho, Evenson et al. (2011) found that the odds of higher physical activity intensity among adolescent girls were greater in places with parks, schools, and high population density during weekdays.
Finally, an innovative study correlated children’s drawings of their home and neighbourhood environments with objectively measured PA of those same children (Hume, Salmon, & Ball, 2005). The researchers asked the children to draw places and things in their neighbourhoods and homes that were important to them, and the terms “home” and “environment” were defined for the children. This study found that boys who drew sedentary opportunities at home (including a television in his bedroom) did more MVPA than boys who did not. On the other hand, girls who drew a dog at home did more moderate intensity activity than girls who did not. Also among girls, low intensity PA was positively associated with PA opportunities in the neighbourhood. These results suggest that the neighbourhood environment may be more important than the home environment for PA opportunities among children.
1.2. Public Parks as a Population Health Approach to Increasing Physical Activity Among Youth
Regular PA is part of an overall healthy lifestyle that helps to reduce morbidity and mortality by decreasing risk of excess weight, heart disease, and diabetes (U.S. Department of Health and Human Services, 1996), among other health benefits. Population health approaches to increasing PA include upstream strategies such as a focus on modifiable aspects of the BE. Public parks have the potential to facilitate or hinder behaviours that are known to affect weight status (Centers for Disease Control and Prevention, 2001; Committee on Environmental Health, 2009) and represent potentially modifiable aspects of the BE. As well, parks are a popular setting for PA among youth (McCormack et al., 2010; Rehrer et al., 2011). Parks are an interesting
aspect of the BE for study because they are semi-permanent and are known to be accessible across a range of socioeconomic (SES) status neighbourhoods in Montreal, Quebec (Apparicio, Cloutier, Séguin, & Ades, 2010) with usually low to no user fees. In addition, as will be outlined in the following section, natural experiments looking at community and PA impacts from park improvements demonstrate that public parks are a promising area in the BE for interventions to promote PA at the population level, and point to useful aspects of parks on which to intervene. Unlike some more ‘permanent’ aspects of the BE, such as street connectivity, public parks are more malleable BE spaces because park installations, amenities, and greenery can be modified or added to with little impact on surrounding homes or businesses.
1.3. Natural Experiments: Results on Park Improvements to Increase Physical Activity
A small but growing number of researchers have taken advantage of publicly funded park interventions to conduct natural experiments. Most of them have demonstrated that improvements to park characteristics, such as the installation of Fitness Zones (Cohen, Marsh, Williamson, Golinelli, & McKenzie, 2012), a levelling of playfields with artificial turf (Tester & Baker, 2009) and adding a range of amenities and activity areas, such as a walking track, to an open space with no installations (Veitch et al., 2012) can increase MVPA among park users. One of these studies (Cohen et al., 2012) demonstrated that park improvements are a cost-effective intervention when considering dollars spent per metabolic equivalent of task (MET) gained at the population level. On the other hand, a natural experiment in which mostly
gymnasiums were built or renovated in urban parks, showed decreases in MVPA (Cohen et al., 2009), however there were also decreases in the comparison parks, suggesting that recent cuts to park programming may have resulted in a reduction in park activity. These studies provide useful information on the impact that park interventions can have on PA among youth at a population level, as well as on the potential cost-effectiveness of such interventions.
1.4. Parks, Physical Activity and Health
Although an understanding of the relationships between parks and PA is developing, the literature remains sparse in objectively measured intra-park characteristics, in particular those that are appealing specifically to youth. The parks and PA literature has thus far mostly concentrated on the presence or accessibility of parks and PA. Kaczynski and Henderson (2007) reviewed 50 quantitative studies that looked at the presence of parks and recreation facilities with PA as an outcome. Although the results were mixed, there was a generally positive tendency for access to parks to be associated with PA. Only eight of the fifty studies had youth as a study population. Among these studies, a number of conflicting relationships emerged. The perception of and actual number of neighbourhood recreational facilities were inversely and significantly correlated to family levels of PA. Distance to the nearest play area was found to be associated with outdoor PA in boys but not girls, and some found no relationship between proximity to parks and time spent in sedentary activities, whereas others found that odds of walking or cycling for 10-12 year olds was lower among youth who did not live near a park.
Coen and Ross (2006) directly observed 28 parks in low, moderate, and high health status neighbourhoods in Montreal, identified by three health indicators (i) life expectancy for men at birth, 1994–1998, (ii) lung cancer incidence rate, 1994–1998, and (iii) ischemic heart disease mortality rate, 1994–1998. Using a single-rater checklist, park characteristics were observed and then compared with aggregated health data from these same neighbourhoods. Results indicated that in general, parks found in lower health status neighbourhoods had material disadvantages (incivilities, limited facilities for PA, next to high traffic zones) that were less apparent in moderate and high health status neighbourhoods. However, there was intra-neighbourhood and intra-park variation in the quality of park characteristics observed. This study provides a novel way of assessing park characteristics as a dependent variable of neighbourhood health status indicators. However, as only one rater used the evaluation tool at one time point, reliability estimates of the measure could not be assessed. In addition, the study was cross-sectional and ecological in nature, making any attempts at establishing causality between poor neighbourhood health outcomes and park characteristics untenable. Finally, it is unclear if the park observer was blinded to the health status of the neighbourhood in which the park was situated. If not, the results may have been biased toward an association when there was none.
Shores and West (2008) observed park visitation patterns and park characteristics in four parks using the System for Observing Play and Recreation in Communities (SOPARC) direct observation tool (McKenzie, Cohen, Sehgal, Williamson, &
Golinelli, 2006). They found that across all four parks, the children were the most vigorously active age group, engaged in a range of activities such as climbing on play structures, playing jumping games, and playing tennis. Overall, park visitors were most active in areas with playgrounds and courts and least active in areas with shade, while moderate-intensity PA was mostly practiced on sports fields and paths. Although the number of parks observed was low (n=8), and the design was cross-sectional, this study is among the first to look at intra-park characteristics and their relationships to PA among park users.
In another cross-sectional study, Cohen et al. (2010) explored social and physical characteristics associated with park use across 30 parks in southern California. Variables included park size, number and type of park amenities and events and programs available in the parks. Data were collected through surveys of park directors, direct observation using the SOPARC and surveys of park users and residents living near the parks. Despite the wide net cast, investigators correlated very little variation in park use with the factors under study. For example, contrary to expectation, they found no correlation between perceived safety of parks and park use, even among parks that were considered very safe. The strongest correlation of park use was park size and number of organized activities offered in the park, suggesting that social programming and park size may be an important draw for physical activity among park users over and above amenities or perceived safety.
Rung and colleagues (Rung et al., 2011) also pursued the question of which intra-park characteristics promote PA with a focus on basketball courts, sports fields, green spaces and playgrounds across 37 parks in New Orleans. Data on the quality of the sports installations were collected in a cross-sectional design using the Bedimo-Rung Assessment Tool – Direct Observation (BRAT-DO) (Bedimo-Bedimo-Rung, Gustat, Tompkins, Rice, & Thomson, 2006), and physical activity was assessed using the SOPARC. Using multilevel analyses with the observation of a particular park target area in that moment in time as the unit of analysis (rather than the individuals observed in the park, as would be done using the SOPARC), they found that basketball courts had the highest mean number of park users followed by sports fields, playgrounds and then green spaces. On the other hand, playgrounds were found to have the highest mean energy expenditure per user, followed by basketball courts, green spaces and then sports fields. Finally, basketball courts had the highest total amount of energy expenditure per user, with playgrounds, sports fields and greens spaces trailing far below. The condition of the activity areas was not found to be significantly associated with presence of park users. However, it was associated with number of park users per park and total energy expenditure per park user. They also found an inverse relationship between condition of green space and number of users. However, a poor quality green space may simply indicate that, as a popular spot for PA, the grass does not get a chance to grow back between uses. It must also be noted that the authors found that PA-supporting amenities such as drinking fountains and benches were associated with presence of park users after controlling for type and condition of activity area. Not surprisingly, drinking fountains were
associated with high total energy expenditure per user while benches and picnic tables were associated with low energy expenditure per user. Like the Shores and West (2008) article described above, this is among the first known studies to assess the relationships between intra-park characteristics and their quality with PA. Although it is cross-sectional in design, the methods used for this study provide support for the notion that park features can promote PA in different ways and may help future work in this area.
The relationship between park characteristics, accessibility, and PA is only beginning to be understood (Bedimo-Rung et al., 2005; Cohen et al., 2010; Giles-Corti et al., 2005; Kaczynski & Henderson, 2007; McCormack et al., 2010; Rung et al., 2011). Although parks have been shown to be associated with PA, there remains only a small body of literature that assesses intra-park characteristics and opportunities for PA. Kaczynski and Henderson’s (2007) systematic review found that the majority of quantitative studies assessing parks and PA only addressed parks in terms of access as measured in distance, providing little insight as to why the parks are used. In addition, the cross-sectional nature of most of the studies assessed does not allow for inference into causality. Of the studies that did assess parks characteristics and PA (Coen & Ross, 2006; Cohen et al., 2010; McCormack et al., 2010; Rung et al., 2011; Shores & West, 2008), perceived safety was found to be associated with park use in one study (McCormack et al., 2010), while elsewhere it was not (Cohen et al., 2010). In other cases, (Coen & Ross, 2006) the reliability of observed park characteristics were questionable due to poor inter-rater reliability. One study found associations
between basketball courts and play areas and PA (Rung et al., 2011). Others reviewed only a small number of parks (n=4) (Shores & West, 2008), making the generalizability of findings unclear.
1.5. A Review of Direct-Observation Park Audit Tools
Although research is now beginning to scratch the surface of associations between intra-park characteristics and physical activity, the literature on parks and PA is still largely limited to park proximity, driving the need for direct-observation park assessment tools that can capture variation in park characteristics that may be associated with PA. In recent years, a handful of direct-observation intra-park characteristic audit tools have been created to help better understand the park variables that are associated with their use. The following is a review of these tools. Table 1-I (p.32) provides a summary of the tools reviewed here.
The Public Open Space Tool (POST) (Broomhall, Corti, & Lange, 2004; Giles-Corti et al., 2005) was developed by Broomhall, Giles-Giles-Corti and Lange and based on a literature review and focus group meetings with park users, with content validity assessed by an expert panel (Giles-Corti et al., 2005). It was created to collect data on four domains of public open spaces from the public health discipline: activities, environmental quality, amenities and safety. The tool contains 49 items and was tested on 516 parks in Perth, Australia. Inter-rater reliability per item was assessed using the kappa statistic, which was overall good and ranged from 0.6 – 1.0. The development and testing of the observation tool however, are only very generally described. For example, although the results of the reliability estimates were
generally good, the tool development, data collection methods and estimation of reliability have not been published in a peer-reviewed journal.
Cavnar et al. (2004) developed an objective tool to assess the condition, safety and maintenance of amenities found in public recreation facilities, including parks, based on a literature review of evaluation tools and established industry standards for the evaluation of recreation facilities, as well as on recreation professionals’ expertise and accepted professional standards for evaluation. The 61-item tool was developed specifically for facilities in a medium-sized county in the south-eastern region of the United States. The tool was tested among 27 parks. Inter-rater reliability of the tool’s items was estimated using the kappa statistic, with a final overall kappa of 0.8 Although the tool could be used to assess areas of parks specifically used by youth, it was developed to help parks and recreation managers assess the quality of facilities for a wide range of park users. Finally, the tool does not assess the size or safety of adjacent streets or the neighbourhood context, which may be an important indicator of park access.
The Physical Activity Resource Assessment (PARA) instrument (Lee, Booth, Reese-Smith, Regan, & Howard, 2005) was developed to assess publicly available PA resources including quality and features of characteristics in parks, churches, schools, and fitness centers. The 34-item tool was developed and tested among 17 neighbourhoods in Kansas City by trained field coders. The tool collects information on the presence and quality of features for PA (e.g. team sports installations such as
baseball field) as well as amenities (e.g. benches), and incivilities such as broken glass, or sex paraphernalia. Reliability of the tool is only generally described, using a 10% observation overlap with overall good reliability (rs >0.77). This is a simple yet comprehensive tool; however it lacks assessment of the qualitative aspects of surrounding streets. In addition, some of the items may be too subjective or difficult to identify in some contexts, such as “Evidence of alcohol use”.
Table 1-I. Summary of Direct-Observation Park Tools Reviewed
Tool Name Author Date
Total No. of Items No. of Test Parks
Audited Assessment Reliability Reliability Results Recreation Facilities
Assessment Tool Cavnar et al. 2004 61 27 Kappa 0.80 Public Open Space
Tool (POST) Broomhall et al. 2005 49 516 Kappa 0.6 - 1.0 Physical Activity
Resource Assessment
instrument (PARA) Lee et al. 2005 34 22 10% overlap rs > 0.77 Bedimo-Rung
Assessment Tool - Direct Observation
(BRAT-DO)
Bedimo-Rung
et al. 2006 181 2 agreement Percent ≥ 78%
System for Observing Play and Recreation in
Communities (SOPARC) McKenzie et al. 2006 Based on number of people in target area 8 Percent agreement ≥ 80% Correlation coefficient between observers on number of area participants 0.99 Environmental Assessment of Public Recreation Spaces (EARPS) Saelens et al. 2006 646 225 Kappa Intraclass correlation coefficients (ICC) or percent agreement 65.6% of 506 items were either kappa/ICC ≥ 0.60 or ≥ 75% agreement
Path Environment
Audit Tool (PEAT) Torped et al. 2006 40 6
Kappa (15 of 16 primary amenity items) ≥ 0.49 Kappa (7 binary items) 0.19 - 0.71 ICC (3 of 5 ordinal items) ≥ 0.49 Percent agreement ≥ 81% Children's Public Open
Space Tool (C-POST) Crawford et al. 2008 27 19 Inter and intra-rater reliability not reported
Community Park Audit
Tool (CPAT) Kaczynski et al. 2012 140 59
Kappa ≥ 0.40 for all but 8 of 56 items where kappa could be calculated Percent agreement > 0.70 for all but 4 items
Recognizing the potential of public parks for PA, researchers have begun to develop park measurement tools to capture park features or characteristics that may promote PA. The Environmental Assessment of Public Recreation Spaces (EARPS) (Saelens et al., 2006) is a direct-observation tool based on interviews with park and recreation professionals and frequent park users in the Greater Cincinnati area. The 646-item tool underwent two iterations of testing with observer pairs. The authors demonstrated good reliability of the items in the final tool, in particular among objective items. 65.6% of 506 items had either a kappa or Intraclass correlation coefficient (ICC) of ≥ 0.60, or ≥ 75% agreement. Nevertheless, a weakness of the
tool is that it was based entirely on park users and professionals’ opinions of parks, and not on park design literature or any conceptual model of hypothesized relationships between park features and PA. This may introduce considerable bias into the tool items related to regional attitudes and behaviours, given that interviews were conducted among individuals from the same region as where the parks were
evaluated. In addition, the observation tool does not capture features of the neighbourhood context, notably related to adjacent streets, which may be particularly important for youth access.
Introduced earlier, the SOPARC (McKenzie et al., 2006) is a tool created to examine physical activity within community parks, with the aim of capturing the intensity of PA that occurs in different areas of parks. The tool is innovative because it links PA levels to specific areas or features of parks such as activity occurring on a track or basketball court. As such, the tool does not contain a specific number of items, but is based on the number of individuals seen in a target area during observation. Observations are conducted by independent pairs, and agreement between observers was shown to be high with ≥ 80% agreement and a correlation coefficient of 0.99 between observers on the number of participants in a target area. However, the tool development is only generally described and does not appear to be developed based on a theory or conceptual model. As its aim is to capture physical activity occurring in parks, rather than the characteristics of a park that may be amenable to PA, the tool may not be accurately measuring parks for PA, and it is unclear if the tool assesses park context features such as public transportation access or street traffic on adjacent roads. Other limitations include a possible overestimation of the tool’s reported reliability. Finally, the tool may not be generalizable to parks with smaller areas as it was only tested in very large parks (mean = 7.8 acres).
The Path Environment Audit Tool (PEAT) (Troped et al., 2006) was created to evaluate how trail characteristics may influence their use. Although the 40-item tool
was not developed to evaluate parks directly, trails are often found in parks and there are items on the PEAT that audit environmental characteristics found in parks such as exercise or play equipment and drinking fountains. The inter-rater reliability of items was provided, and was low for several items. For 15 of 16 primary amenities items, kappa was ≥ 0.49, for 7 binary items kappa was between 0.19 and 0.71, for three of five ordinal items, ICC was ≥ 0.49 and percent agreement was overall ≥ 81%. Some of the low reliability results may be due to the very small number of trails evaluated (n=6); there may not have been enough variation in the trails for items to produce stable results. In addition, attributes evaluated for the trails were based heavily on the opinion of trail users; consequently, the tool likely does not adequately capture items that represent barriers to trail use.
The Bedimo-Rung Assessment Tool – Direct Observation (BRAT-DO) (Bedimo-Rung et al., 2006) was developed based on a conceptual model (Bedimo-(Bedimo-Rung et al., 2005) of park characteristics and physical activity by the same group of authors, Bedimo-Rung and colleagues. Sub-categories from five of the six domains in the conceptual model are assessed using this 181-item tool (features, condition, access, aesthetics, and safety). There are a number of limitations regarding the reported reliability estimations of this tool, however. The tool was tested in two large parks, by fifteen pairs of observers. The parks were divided into ‘target areas’ that were evaluated, and no single pair of observers rated more than two target areas for the study, providing too small an N for calculation of Cohen’s kappa (Bedimo-Rung et al., 2006). Reliability estimates were therefore calculated using percent-agreement
between raters (≥ 78% for all items on the tool) which may artificially inflate results because chance agreement is not considered. In addition, the very small number of parks evaluated may also make the reliability results unstable. Nevertheless, the tool is one of the few that contain items on park context such as traffic on adjacent streets, as well as neighbourhood attributes. It is also one of the few tools to attempt to capture the quality of park PA installations.
The Children’s Public Open Space Tool (C-POST) was developed to assess features of parks that are hypothetically important for their influence children’s PA (Crawford et al., 2008) among neighbourhoods with differing SES. Development of the 27-item tool is only very generally described. Ten auditors tested the tool in 19 parks in Melbourne, Australia on two occasions, which generated adequate reliability using either analysis of variance with Scheffe post-hoc tests for continuous variables or Pearson’s χ2 for categorical variables, however results were not reported. The C-POST assessed the presence of recreational facilities, availability of amenities and number of playgrounds as well as number of other features such as paths, lighting, water features, signage and trees.
Kaczynski and colleagues developed a 140-item park audit tool for use among non-academic community stakeholders that was somewhat focused on park characteristics important for youth (Kaczynski, Wilhelm, & Besenyi, 2012). Development of the tool included a review of existing tools and community stakeholder workshops in which 32 adults and two teenagers participated. The
Community Park Audit Tool (CPAT) was developed and tested in 66 parks by the same community stakeholders involved in the development of the tool, which may have biased reliability results, all in Kansas City, USA. The CPAT demonstrated relatively high inter-rater reliability (≥0.40 for all but 8 of 56 items where kappa could be calculated) and good percent agreement (>0.70% for all but 4 items). Follow-up surveys among the stakeholders involved indicated that use of the tool helped to raise awareness of parks for PA.
The observation tools reviewed above have all been developed within a specific geographic context and resulting tool items reflect the particular context in which they were developed. For example, there is a strong emphasis on beach and water-front areas in the POST (Broomhall et al., 2004), which was developed in Perth, Australia. It remains to be seen whether item reliability is similar in a different environmental context, making it important to both re-assess the reliability of items if they were developed in one context and then later used in a different one, and to move toward comparisons of the reliability of the same items tested in different contexts so that the estimated reliability of an item can begin to be generalized to different contexts. None of the above studies have attempted to do so.
All the tools mentioned above use on-site observation. Advances in technology are providing remote access to built environment evaluation and one such tool, an adaptation of the POST (Broomhall et al., 2004), was created to assess parks using Google Earth (Taylor et al., 2011). The authors estimated its reliability by correlating
responses with those of the direct observation POST, which were highly and significantly correlated. In addition, there was a dramatic decrease in evaluation time using this tool. A caveat, however, is that Google Earth currently cannot provide its ‘street view’ function in areas where there are no streets, making identification of some features located far from the street or obstructed from view almost impossible to assess using this method. In addition, the presence of trees may hide some park details, such as paths. Finally, Google Earth images may be out of date. Given the difficulty of evaluating more nuanced aspects of park features such as their condition, or smaller or covered park features such as drinking fountains, paths and park benches using Google Earth, direct observation remains the method of choice for observing a wide range of park features and their condition.
1.6. Conceptualizing Park Domains and Their Relationships to Physical Activity
As outlined above, the majority of the park characteristic audit tools were developed using a combination of literature reviews, expert interviews and park user interviews and feedback. Only one park tool, the BRAT-DO, was developed based on the authors’ own previously published conceptual model of park characteristics that are hypothetically associated with physical activity (Bedimo-Rung et al., 2005). The Bedimo-Rung conceptual model (Figure 1.1, p.39) posits that in order to adequately assess the park characteristics that may be associated with PA, four geographic areas should be considered: activity areas, supporting areas within the park, the overall park and the surrounding areas of the park. As described in the model, the activity areas are the sections, zones or opportunity areas in a park that are designed or commonly used for physical activity such as trails, courts, or sports fields.
Supporting areas are the facilities and equipment that make PA attractive and safe for a variety of users. Supporting areas may not be used to directly engage in PA, but are nevertheless important to the park visitation experience, such as picnic areas, parking lots and water fountains, and they support PA in parks. The overall park environment refers to the general impression a park gives, such as aesthetic appeal, size and diversity of activities. The surrounding neighbourhood includes level of traffic, crime and resident demographics. Six conceptual areas are included in the model and are the basis for operationalizing measures to assess the relationship between park characteristics and PA. These are: Features, Condition, Access, Aesthetics, Safety and Policies.
Figure 1.1. A reproduction of the Bedimo-Rung et al. conceptual model of park
According to the conceptual model, each of the six conceptual areas represents the type of data that should be collected; however because some areas may overlap in their scope, specific items may contribute to more than one conceptual area.
The Bedimo-Rung conceptual model is now well established in the parks and physical activity literature. It provides a solid framework from which to think about the ways in which conceptual areas of parks, or park domains, may be related to physical activity, and facilitates the testing of relationships to this effect. Nevertheless, the notion that parks have overlapping but distinct, conceptual domains has never been empirically explored. That is, can conceptual domains characterize parks, and if so, does the Bedimo-Rung conceptual model adequately describe park conceptual domains? Are the audit tools being used to assess parks adequately capturing the domains they attempt to assess? A better understanding of what park domains are being captured with the tools used to audit them is foundational methodological work in the field of parks and PA that has thus far not been undertaken.
CHAPTER 2: STUDY CONTEXT AND METHODS
This section presents the overarching study context, the methods used for tool development and data gathering, as well as the statistical analyses applied. It also contains a section that summarizes the work specifically carried out by the student. A flow chart (Figure 2.2, p. 51) provides a visual summary of the sequence of steps undertaken in this study.
2.1. Study Context: The Quebec Adipose and Lifestyle Investigation in Youth (QUALITY) Cohort Study and the Residential Study
The parks included in this study were located near the homes of participants from the Quebec Adipose and Lifestyle Investigation in Youth (QUALITY) Cohort, an ongoing longitudinal investigation of the natural history of obesity and cardiovascular risk among youth. Subjects were considered to be at high risk for obesity because one or both biological parents were required to be obese (based on standard definitions of BMI and waist circumference) in order to participate. In addition to parental obesity, inclusion criteria required both biological parents to be available to participate in the baseline assessment and participating children to be Caucasian and aged 8–10 years at recruitment. Only Caucasian families were recruited to reduce genetic admixture. Of eligible families, a total of 630 families (one child and two biological parents) completed the baseline visit between September 2005 and December 2008. Study participants were recruited through flyers addressed to parents that were distributed to children in grades 2 to 5, in 1040 primary schools located within 75 km of each of Montreal, Quebec City, and
Sherbrooke (QC, Canada). 89 per cent of schools were approached, from which 3350 interested families contacted the research coordinator, and 1320 met the study inclusion criteria. The built environments around the homes of the families (n=512 homes) in the Montreal Census Metropolitan Area (MCMA) were audited, including park evaluations. Baseline data collection involved a clinic visit during which questionnaires were completed and biological and physiological measurements obtained. Detailed information about the cohort can be found in Lambert et al. (2011). Written informed consent was obtained from the parents, and assent was provided by the children. The Ethics Review Boards of CHU Sainte-Justine and Laval University approved the study. A detailed description of the cohort is available in Appendix I.
The Residential Study is an adjunct to the QUALITY study, the aim of which is to identify features of residential neighbourhoods that contribute to the development and maintenance of overweight/obesity in pre-adolescent youth. The Residential Study allows the possibility to determine to what extent the BE or neighbourhood features might play a role in the incidence, maintenance and change in adiposity and antecedent behaviours, including PA, active commuting, sedentary pursuits, and dietary behaviours among this at risk population.
The Residential Study uses the Neighbourhood Institutional Resource model (Leventhal & Brooks-Gunn, 2000), in part as a theoretical foundation. This model suggests that neighbourhood resources, including infrastructures, facilities,
amenities, and collective resources such as parks and community centers, may affect children’s health development via their availability, accessibility, affordability, and quality (Leventhal & Brooks-Gunn, 2000). In addition, the Residential Study investigates the relationship between the built environment and obesity within a social ecological perspective of behaviour (McLeroy, Bibeau, Steckler, & Glanz, 1988). This perspective posits that conditions under which features of the built environment influence overweight/obesity and related behaviours depend on predisposing individual, familial, and social characteristics or conditions. In this way, it is expected that children’s behavioural and biological responses to the factors in their BE will vary according to social influences linked to family, peers, and schools.
2.2. Sources of Data for the Residential Study
Data were collected for the Residential Study from three primary sources: (i) child and parent perceptions of neighbourhood attributes (included in the QUALITY study questionnaires); (ii) a geocoded database: the MEGAPHONE (Montreal Epidemiological and Geographical Analysis of Population Health Outcomes and Neighbourhood Effects), which integrates spatial information for the entire MCMA including habitation and land use; presence of parks and other public open spaces; residential density; urban infrastructures; private businesses and services geocoded at the address and six-digit postal code level, school locations, and complete 2006 Census data, and; (iii) direct observation of the participant’s neighbourhood, including a detailed audit of the 10 nearest street segments, a ‘walk through’ of all segments within the 500 m walking network, and audits of the three closest parks to each resident, details of which are discussed below.
2.3. Study Contributions Made By The Author
The author of this Master’s thesis, made several contributions to this study, such as: • Conceptualization of the research question and analysis;
• All cleaning of the data;
• Calculation of the area of all newly identified parks and re-calculation of the area of parks that were found on-site to be a different size than indicated on maps using ArcMap;
• The operationalization of the Bedimo-Rung conceptual model;
• All statistical analyses including park descriptions, reliability estimates, principal component analysis and cluster analysis;
• All interpretation of study results.
2.4. Parks Tool Development, Identification, Observer Training and Data Collection
2.4.1. Parks, Activities and Recreation among Kids (PARK) Tool Development
Park evaluation tools published until 2007 were identified and items were assessed for their reported reliability and applicability to measuring park characteristics as they pertain to youth, i.e. between 6 and 17 years, and physical activity. Efforts were made to draw items from existing tools that were specifically applicable for youth PA, e.g. installations for team sports, and that had reported reliability estimates. The study team endeavoured to balance selecting more nuanced items that would generate more detail about the intra-park characteristics, e.g. perceptions of safety and aesthetics, with efforts to reliably measure the intra-park characteristics between
observers, e.g. presence or absence of a swimming pool. The BRAT-DO (Bedimo-Rung et al., 2006) and the POST (Broomhall et al., 2004) were retained as both contained items that had demonstrated reliability and were relevant for inclusion in a youth oriented park evaluation tool. The BRAT-DO, and the tool developed for this study, are based on the same conceptual model of parks and physical activity by Bedimo-Rung et al. (2005), facilitating analyses of specific park characteristics that may be associated with PA (Oakes, Mâsse, & Messer, 2009). The Bedimo-Rung conceptual model was selected because it is well established in the parks and PA literature and can be adapted to youth PA in parks.
In general, items on the presence of park installations and amenities were selected from the POST whereas items associated with access to, condition and restriction of installations were drawn from the BRAT-DO. A number of new items were developed (n=16), to assess features of parks that would likely appeal to or be relevant specifically to youth PA in parks but that were not present on the POST or BRAT-DO. These items include the presence of schoolyards, skate parks, play areas designed for children 6 years and older, water sprinklers, and general impression items such as overall safety and level of appeal for youth. See Appendix II for a table of the origins of the tool items. The tool underwent expert consensus and was piloted among a group of youth in their late teens and early twenties (n=12). All items went through numerous revisions by the research team prior to field-testing and were further revised during field-testing while observers were being trained.
The final result was a 92-item youth-oriented park and physical activity tool, the Parks, Activity, and Recreation among Kids or PARK tool. See Appendix III for the complete tool. The PARK tool was developed to assess five conceptual domains of parks that may be important for youth PA, based on the Bedimo-Rung conceptual model: 1) Activities (17 items and 39 sub-items); 2) Environmental Quality (9 items and 3 sub-items); 3) Services (10 items and 2 sub-items); 4) Safety (6 items), and; 5) General Impression (6 items). An example of an item that relates specifically to youth is, “Presence of a 6+ play area”, which describes a play structure that is clearly designed for children 6 years and older such as those that have higher slides, do not have baby swings, and have a more challenging and/or higher structure. Some play areas also have signs at the entrance that indicate the intended target age of the play structure/area (e.g. “Only children between the ages of 2-5 may use this play area”). Another example of an item relating specifically to youth is, “Is the park appealing for youth?”, which is a subjective item in which the observers were instructed to look at the park overall, and imagine if a 10 year-old would find it fun and interesting to play in.
2.4.2. Observer Training
Nine observers were recruited for data gathering, which was embedded in a larger neighbourhood assessment study around the homes of the QUALITY participants residing in the MCMA. Observer training occurred over a 9-day period beginning in May 2008. On the first day, observers were introduced to the purpose of the study and attended a presentation of the observation tool that contained photo illustrations