Correspondence
Benjamin Dumont (benjamin.dumont@uliege.be) Received: 25 April 2018 Revised: 11 June 2018 Accepted: 11 June 2018 Publication: 14 June 2018 doi: 10.1255/jsi.2018.a9 ISSN: 2040-4565 Citation
D. Eylenbosch et al., “Quantification of leghaemoglobin content in pea nodules based on near infrared hyperspectral imaging spectroscopy and chemometrics”, J. Spectral Imaging 7, a9 (2018). https://doi.org/10.1255/ jsi.2018.a9
© 2018 The Authors
This licence permits you and anybody else to use, share, copy and redis-tribute the paper in any medium or any format provided that a full cita-tion to the original paper in this journal is given and the use is not for commercial purposes.
In thIs Issue:
spectral preprocessing to compensate for packaging film / using neural nets to invert the PROSAIL canopy model
JOURNAL OF
SPECTRAL
IMAGING
Peer Reviewed Paper openaccessQuantification of leghaemoglobin content
in pea nodules based on near infrared
hyperspectral imaging spectroscopy and
chemometrics
Damien Eylenbosch,a,‡ Benjamin Dumont,b,‡,* Vincent Baeten,c Bernard Bodson,d Pierre Delaplacee and
Juan Antonio Fernández Piernaf
aDpt AgrobioChem, Gembloux Agro-Bio Tech Faculty, University of Liège, Belgium. ORCID: https://orcid.org/0000-0002-7294-2748 bDpt AgrobioChem and Dpt Terra Teaching and Research Center, Gembloux Agro-Bio Tech Faculty, University of Liège, Belgium.
E-mail: benjamin.dumont@uliege.be
cWalloon Agricultural Research Centre, Valorisation of Agricultural Products Department, Food and Feed Quality Unit, Belgium.
ORCID: https://orcid.org/0000-0003-4342-333X
dDpt AgrobioChem, Gembloux Agro-Bio Tech Faculty, University of Liège, Belgium. ORCID: https://orcid.org/0000-0002-2968-8086 eTerra Teaching and Research Center, Gembloux Agro-Bio Tech Faculty, University of Liège, Belgium
fWalloon Agricultural Research Centre, Valorisation of Agricultural Products Department, Food and Feed Quality Unit, Belgium.
ORCID: https://orcid.org/0000-0003-4953-8402
‡These authors share senior authorship
Leghaemoglobin content in nodules is closely related to the amount of nitrogen fixed by the legume–rhizobium symbiosis. It is, therefore, commonly measured in order to assess the effect of growth-promoting parameters such as fertilisation on the symbiotic nitrogen fixation efficiency of legumes. The cyanmethaemoglobin method is a reference method in leghaemoglobin content quantification, but this method is time-consuming, requires accurate and careful technical operations and uses cyanide, a toxic reagent. As a quicker, simpler and non-destructive alternative, a method based on near infrared (NIR) hyperspectral imaging was tested to quantify leghaemoglobin in dried nodules. Two approaches were evaluated: (i) the partial least squares (PLS) approach was applied to the full spectrum acquired with the hyperspectral device and (ii) the potential of multispectral imaging was also tested through the preselection of the most relevant wavelengths and the building of a multiple linear regression model. The PLS approach was tested on mean spectra acquired from samples containing several nodules and acquired separately from individual nodules. Peas (Pisum sativum L.) were cultivated in a greenhouse. The nodules were harvested on four different dates in order to obtain variations in leghaemoglobin content. The leghaemoglobin content measured with the cyanmethaemoglobin method in fresh nodules ranged between 1.4 and 4.2 mg leghaemoglobin g–1
fresh nodule. A PLS regression model was calibrated on leghaemoglobin content measured with the reference method and mean NIR spectra of dried nodules acquired with a hyperspectral imaging device. On a validation dataset, the PLS model predicted the leghaemoglobin content in nodule samples well (R2 = 0.90, root mean square error of prediction = 0.26). The multispectral approach showed similar performance. Applied to individual
nodules, the PLS model highlighted a wide variability of leghaemoglobin content in nodules harvested from the same plant. These results show that NIR hyperspectral imaging could be used as a rapid and safe method to quantify leghaemoglobin in pea nodules.
Keywords: cyanmethaemoglobin, hyperspectral, imaging, leghaemoglobin, multispectral, near infrared, pea, PLS regression, quantification,
spectroscopy
Introduction
Legume plants can fix atmospheric nitrogen thanks to a symbiosis with bacteria. The leghaemoglobin protein is synthesised by the host plant within the cytoplasm of cells located in the nitrogen-fixing zone of nodules, the special organ of legumes that contains the nitrogen-fixing bacteria.1,2 Leghaemoglobin has a high affinity
with oxygen and keeps the O2 concentration in an
optimal range to protect nitrogenase enzyme against oxygen damage and to supply bacterial respiration. The nitrogen ase enzyme is contained in the nodule and trans-forms N2 into NH3, a form of nitrogen which is
meta-bolically available for plants.1,3 In the case of pea (Pisum
sativum L.), the bacteria involved in this transformation is Rhizobium leguminarosum.4,5
Leghaemoglobin in root nodules is commonly quantified in order to assess the effects of plant growth-promoting parameters [such as fertilisation or ultraviolet (UV) exclusion of solar radiation] on symbiotic nitrogen fixation efficiency.1,6,7 The concentration of leghaemoglobin
is affected by several factors, such as the age of the nodules and the content of nutrients like S or N in the growing substrate or plant health.1,6,8 Its concentration
in root nodules is closely correlated with the amount of nitrogen fixed in the association between the plant and the bacteria.5,9 Low leghaemoglobin content in nodules
leads to low N2 fixation due to higher O2 concentration
and inhibition of the nitrogenase enzyme.1,4
Common methods of leghaemoglobin quantification require prior extraction of leghaemoglobin from nodules before any possible quantification of its concentration. This extraction step is time-consuming, destructive and
sensitive to operator ability and needs several chemical reagents. Moreover, several nodules are needed and leghaemoglobin quantification is, to the best of our knowledge, not possible in an individual nodule. Among the methods used to quantify leghaemoglobin, the most popular one is based on the cyanmethaemoglobin method, also used in medicine to quantify haemoglobin in blood. As leghaemoglobin is structurally and chemically similar to human haemoglobin, the method was transposed to legume haemoglobin as
described by Wilson and Reisenaeur.9 The principle
of this method is the conversion of haemoglobin into cyanmethaemoglobin by the addition of potassium cyanide and ferricyanide, whose absorbance is measured at 540 nm in a spectrophotometer against a standard solution.10 This method is considered as a reference
method because it is accurate, cheap, sensitive to small variations in haemoglobin concentration, reliable, reproducible and requires a minimum of specialised equipment and reagents.9–12 Nevertheless, the
multiple operations required in this method make it time-consuming and thus unsuitable for large-scale field studies. Furthermore, it requires accurate and careful technical operations, which increase the risk of imprecision and errors.10 Finally, this method uses
cyanide, a toxic reagent.11
In order to avoid the limitations of the cyanmethaemoglobin method in leghaemoglobin extraction and content measurement, the use of near infrared (NIR) hyperspectral imaging combined with chemometrics was studied as a new way to quantify leghaemoglobin in nodules. NIR hyperspectral imaging is the combination of NIR spectroscopy and imaging technologies. This technology provides spectral and spatial information simultaneously, i.e. thousands of spectra can be obtained for each sample and give a complete picture of the chemical compounds’ distribution at the pixel level. This technology requires the use of chemometrics, a chemical discipline using mathematics and statistics, in order to extract relevant information from the measurement procedures.13,14
The aim of the present study was to predict the leghaemoglobin concentration of nodules on the basis of their NIR spectra. Two approaches were evaluated. First, the partial least squares (PLS) approach was applied to the full spectrum acquired with the hyperspectral device. Second, the potential of multispectral analysis was also tested through the preselection of the most responsive wavelengths and the application of a multiple linear regression model. Both procedures were tested on a standard calibration–validation approach.
Materials and method
Nodule production
To produce nodules that covered a large range of leghae-moglobin concentrations, a dedicated protocol was estab-lished taking into account that leghaemoglobin content in pea is affected by nitrogen fertilisation and varies over time with plant growth.6,8,15,16 Two types of fertilisation
(no fertilisation and nitrogen fertilisation) were applied at seeding time of pea plants. Under both fertilisation treat-ments, nodules were harvested at four different dates during plant growth. Each one of the eight treatments (fertilisation × harvest date) was replicated four times.
Nodules were produced in pots (20 cm in diameter, 15 cm high) in the greenhouses of Gembloux Agro-Bio Tech (University of Liège, Belgium). Five pea seeds were sown in each pot containing field soil and sand (5 kg of substrate per pot with a mass ratio of ¾ field soil and ¼ sand). The field soil was collected in a field (loam type) where peas had been cultivated three months earlier to ensure the presence of rhizobium in the substrate. Seeds of the Dove variety were used. They were protected with WAKIL fungicide (10 % Cymoxanil, 5 % Fludioxonil and 17 % Metalaxyl-m). The fertiliser was applied in the top layer of pot soil at seeding time. Nitrate fertilisation consisted of one input of 0.49 g ammonitrate per pot (equivalent to 80 kg N ha–1). Plants were cultivated
between 12 October and 30 November under a 24 h photoperiod (daylight and artificial light complement). Being exposed to aphids 35 days after seedling emergence, the plants were protected with Pirimor (50 % Pirimicarbe). The temperature was measured in the vicinity of the
plants throughout their development. After germination, three plants were kept in each pot.
The first nodule harvest occurred 25 days after sowing (on 6 November). At this time, the plants had accumulated 500 heat units (basal temperature = 0 °C) and had produced seven leaves. The second harvest occurred when the plants had accumulated 630 heat units, the third after 760 heat units and the fourth after 820 heat units, 48 days after sowing. Approximately one week separated each harvest.
At each harvest date, four pots were randomly selected in each fertilisation modality. In order to quantify plant development, the number of nodules present on each plant root system and the aerial dry biomass were measured. Roots were manually extracted from soil with tap water and nodules were separated from roots with tweezers. For each pot, a sample of 30 nodules was
dried at 60 °C and then kept in ambient conditions until image acquisition. Other nodules were saved in falcon tubes, dipped in liquid nitrogen and kept at –80 °C. When the number of nodules harvested on a plant was below 60, only 10 nodules were dried in order to save enough nodules for the chemical quantification.
Leghaemoglobin quantification
Leghaemoglobin content in frozen nodules was measured the day after each harvest. The assays were based on the cyanmethaemoglobin method described in detail by Wilson and Reisenauer.9 This method is based on
spectro-photometric measurement and uses Drabkin’s solution.17
Briefly, Drabkin’s solution was prepared with 52 mg KCN, 198 mg K8Fe(CN)6 and 1 g NaHCO3 dissolved in water and
made up to 1000 mL. To extract leghaemoglobin, frozen nodules were crushed in liquid nitrogen and 100 mg of crushed nodules was transferred to a 2 mL centrifuge tube with 0.6 mL Drabkin’s solution. The mixture was centri-fuged for 15 min at 500 × g and 4 °C. The supernatant was transferred to a 2 mL flask. The solid phase was extracted and centrifuged twice more. Supernatants were combined, made up to 2 mL with Drabkin’s solution and centrifuged for 30 min at 20,000 × g and 4 °C. Absorbance of the cleared supernatant was read against Drabkin’s solution in a 1.5 mL cell at 540 nm with a UV-visible spectrophotom-eter (UV-1650 PC, Shimadzu, Japan).
A reference curve was computed each day of measurement with a sample free of haemoglobin and five crystalline human haemoglobin (Sigma-Aldrich Cat nr H7379) dilutions: 0.05, 0.1, 0.2, 0.4 and 0.6 mg haemoglobin mL–1. Absorbance of each dilution
was measured twice. Reference curves always had a regression coefficient superior to 0.99. Results were then expressed in milligrams of leghaemoglobin per gram of fresh nodules (mg g–1).
NIR spectra acquisition and preprocessing
NIR spectra of dried nodules were acquired with an NIR hyperspectral line scan camera combined with a conveyor belt (BurgerMetrics SIA, Riga, Latvia) installed at the Walloon Agricultural Research Centre (CRA-W, Belgium). The device is described in detail in Vermeulen et al.18 and
Eylenbosch et al.19 Acquisitions were performed with
HyperPro VB software (BurgerMetrics SIA, Riga, Latvia). Before image acquisition, the system was calibrated with a white ceramic plate (white reference) and by blocking the entrance of reflected light (dark reference). Bad
pixels were detected and removed at the same time. A dark reference was automatically performed before the acquisition of each image. One hyperspectral image was acquired for each nodule sample (one sample per growing pot) and all nodules used for the study were scanned on the same day.
Nodule samples were put on a conveyor belt progressing at 1200 µm s–1 under the camera. For each
pixel, one spectrum of 209 wavelengths was acquired in the 1118–2424 nm range. Pixel resolution was 0.31 mm wide. One mean spectrum representative of each nodule sample was then computed from each hyperspectral image with the HyperSee software (BurgerMetrics SIA, Riga, Latvia). A threshold was used to segment images and remove background prior to mean spectra computation. The mean spectrum of each individual nodule was also
computed.
In order to remove noisy regions at the beginning and the end of the NIR spectra, only the wavelengths between 1432 nm and 2368 nm were kept.19 The remaining noise
and the increasing trend observed in the mean spectra were removed by use of Savitzky–Golay smoothing (order 0, filter width 7) and detrend transformations, respectively. Spectra were also normalised with standard normal variate (SNV) transformation (Figure 1).
Linking NIR hyperspectral and multispectral
imaging to leghaemoglobin content
For each modality (harvest date × fertilisation), the leghaemoglobin content and the average NIR spectrum
from one nodule sample were kept for validation of the regression model. This sample was randomly selected among the four replicates. The remaining data were used for model calibration (two samples were unusable due to handling errors). In total 22 mean spectra were used for calibration and 8 others for validation.
PLS regression model construction
PLS regression was used to build a calibration model between the leghaemoglobin content and the NIR spectra of pea nodules. The number of latent variables was chosen in order to reduce the cross-validation clas-sification error average. A 10-group venetian blind cross-validation was performed.
This work was performed using the PLS Toolbox 7.8 software (Eigenvector Research, Inc., Wenatchee, WA, USA) working with Matlab R2015a software (The Math Works, Inc., Natick, MA, USA).
Optimal wavelength selection and multiple linear regression fitting
Spectra acquired with hyperspectral imaging contain a large number of wavelengths. Most of the wavelengths are, therefore, likely to provide redundant information and make little or no contribution to the predictions. Identification of wavelengths carrying the maximum spectral information would allow the simplification of the model and further technology transfer to more simple
Figure 1. Average NIR spectra of pea nodules used for PLS model calibration before (A) and after (B) preprocessing (Savitzky–Golay smoothing (order 0, filter width 7), detrend and SNV transformations).
B A
acquisition systems, allowing for the implementation of multispectral imaging.
The standard coefficients (b-coefficients) of the PLS regression were used to analyse and identify which wavelengths were the most significant in explaining the variations observed in leghaemoglobin content.20 As two
proximal wavelengths might contain redundant informa-tion, rather than identifying the wavelength with the highest score (as a positive or negative value), it was decided to identify the peaks in the graphs of b-coef-ficients against wavelengths (cf. Results section). The wavelengths for which peaks were identified were then used in a multiple linear regression model to predict leghaemoglobin content.
Algorithms used to select the wavelengths and create the multiple linear regression model were developed using Matlab R2015a software (The Math Works, Inc., Natick, MA, USA).
Statistical analysis
Statistical analyses of nodule numbers, leghaemoglobin content and dry aerial biomass were performed with R software.21 Analysis of variance (ANOVA) and pairwise
comparisons with Student–Newman–Keuls tests were made using the agricolae package.22
Three criteria were used to evaluate the quality of the models and their ability to predict leghaemoglobin content: root mean square error (RMSE), determination coefficient (R2) and the ratio of standard deviation to
RMSE called ratio of prediction to deviation (RPD).23,24
According to Saeys et al.,24 model predictions can be
considered as good when the R2 value is between 0.82
and 0.90. They are classified as good or excellent when the RPD values are between 2.5 and 3.0 or above 3.0, respectively.
Results and discussion
Pea aerial biomass and nodule development
At each harvest date, the number of nodules on each plant root system and the aerial biomass were measured. For the statistical analysis, these measurements were taken per pot (three plants). Both variables were signifi-cantly affected by accumulated heat units (p-value < 0.01, Table 1). The ANOVA reported no significant impact of nitrogen fertilisation (results not shown). Throughout the study, nodules of different ages and sizes were observed. An increase in nodule number was observed between the first and the second harvest; after which the number of nodules tended to stabilise. Aerial dry biomass increased with an exponential shape with accumulated heat units. At the end of the study, most developed plants had 13 leaves.
The leghaemoglobin content measured in the harvested nodules with the cyanmethaemoglobin method was comprised between 1.4 mg g–1 and 4.2 mg g–1 (Table 1
and Figure 2). These concentrations were consistent with those reported in previous studies.1,4 A broad range
of leghaemoglobin content in nodules was therefore observed, as expected with the protocol established.
The analysis of leghaemoglobin content in pea nodules showed a highly significant effect (p-value < 0.001, Table 1) of harvest time. An increase in leghaemoglobin content was observed between the first and third harvest. No statistical differences were reported between the last two harvest dates. Contrary to our expectations, there was no observable effect of nitrogen fertilisation on leghaemoglobin content in nodules (result not shown). This absence of effect could be due to the high amount of
nitrogen already present in the growth substrate, which was taken from a field where peas had been grown in
Accumulated heat units
(°C-days)
Nodules Aerial dry biomass Leghaemoglobin content Mean
(g pot–1) (g potSD –1) (g potMean –1) (g potSD –1) (mg gMean –1) (mg gSD –1)
500 95.6 (b) 27.4 0.79 (c) 0.22 1.63 (c) 0.25 630 179.7 (a) 89.9 1.22 (bc) 0.63 2.50 (b) 0.56 760 218.3 (a) 72.5 2.03 (b) 0.75 3.42 (a) 0.48 820 216.0 (a) 58.3 4.69 (a) 1.52 3.52 (a) 0.43
Table 1. Number of nodules, aerial dry biomass production (g) and nodule leghaemoglobin content (mg g–1 fresh nodule) measured per growing pot (three plants) at the four harvest dates. Mean and standard deviation are presented for each harvest date. N-fertilised and non-fertilised plants are pooled. Mean values followed by the same letter are not significantly different (Student–Newman–Keuls, a = 0.05).
the previous crop season. Furthermore, the growing conditions, i.e. higher temperature of the substrate due to the cultivation performed in pots within the green-house, have likely increased soil mineralisation which also increased the nutrient content available for the plants. Figure 3 presents the leghaemoglobin content for the different harvest dates, gathering together fertilised and unfertilised datasets.
PLS regression
The main goal of this work was to investigate whether leghaemoglobin content could be predicted from average NIR spectra of pea nodules acquired by NIR hyperspec-tral imaging. The first attempt was made using a PLS regression to link leghaemoglobin content, measured with the cyanmethaemoglobin method, and NIR spectra of the nodule. In the calibration phase, 22 nodules samples were used. Five latent variables were used to predict the leghaemoglobin content and explained 99.98 % of leghaemoglobin variance. The first latent vari-able explained 98.51 % of the variance.
The PLS regression showed a determination coefficient (R2) of 0.87 and a root mean square error of calibration
(RMSEC) of 0.32 (Figure 3). The cross-validation of the PLS model gave an R2 of 0.74 and a root mean square
error (RMSECV) of 0.45. Lower values obtained with cross-validation were probably due to the small number of samples.
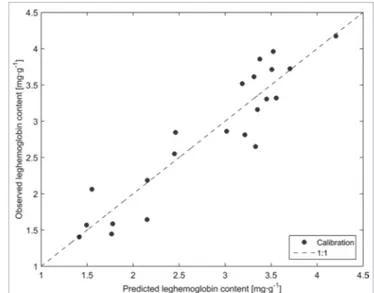
The validation of the PLS model on eight samples gave an R2 of 0.90 and a root mean square error of
prediction (RMSEP) of 0.27 (Figure 4). The RPD was 3.42. Predictions were therefore classified as good.24
The leghaemoglobin contents of the samples used for the validation were well predicted by the regres-sion, and the predictions obtained from these samples were better than those obtained with cross-validation: the R2 was higher and the RMSEP was lower than the
RMSECV. These samples were not completely inde-pendent from those used for the regression model calibration because they were obtained under the same conditions. However, the division of samples, or spectra in a dataset, acquired under the same condi-tions into calibration and validation sets is common in chemometric studies to estimate the potential of a methodology.23,25–27
Validation on single nodules
As stated in the Materials and method section, NIR hyperspectral imaging allows one spectrum per pixel to be acquired. The results obtained with the PLS model (PLS regression section) were based on the computation of an average spectrum representa-tive of the whole sampling, i.e. a sample including all
Figure 2. Leghaemoglobin content (mg leghaemo-globin g–1 fresh nodule) measured with the cyanmethae-moglobin method at each harvest time (expressed in heat units (°C-days) accumulated after plant sowing).
Figure 3. Calibration results of the PLS regression model calibrated on leghaemoglobin content measured with cyanmethaemoglobin method and predicted leghaemo-globin content of nodules on the basis of their NIR spec-tra. Results are expressed in mg leghaemoglobin g–1 fresh nodules. The regression was constructed on five latent variables. Leghaemoglobin was predicted with a RMSEC of 0.32 and a determination coefficient (R2) of 0.87.
nodules harvested for each growing pot. To evaluate the variability within each sampling, which would make it possible to evaluate the leghaemoglobin content of individual nodules separately, we computed one mean spectrum per nodule within each image (using the information contained in all pixels related to each nodule of the image). The average pixel number for one nodule was 37 (ranging between 10 and 290 pixels per nodule). The PLS model was then applied to each mean spectrum representative of each individual nodule of the validation dataset. The results are presented in Figure 5.
The variability observed in leghaemoglobin content predicted from mean spectra tended to be higher where the measured content was greater, i.e. in nodule samples harvested from the oldest plants. These plants had nodules of different ages and diameters on their roots. Our observations were consistent with results reported for soybean by Sato et al.,16 who showed that
plants have nodules of different diameters and that the leghaemoglobin content increases with the nodules’ diameter.
Multiple linear regression model applied to a
restricted number of wavelengths
Figure 6 reports the b-coefficients corresponding to each wavelength when the PLS analysis was performed (here, the Matlab function plsregress was used to retrieve the coefficients). The graph corresponded to the results obtained from plotting the output of the PLS regression using the first component of the PLS obtained with the
plsregress function. The percentage of variance explained
in this case was about 71 %. As stated in the Materials and method section, rather than identifying the highest coefficients, it was decided to identify the peaks within the b-coefficients graph (Figure 6).
The wavelengths identified were: 1461, 1537, 1732, 1934, 2022, 2110 and 2236 nm (Figure 7). A multiple linear regression model was calibrated with the absorb-ance values measured at these wavelengths to predict leghaemoglobin content. The calibration displayed similar performances to those observed in the complete PLS approach, with an R2 of 0.85 and an RMSEC of 0.35.
During the validation phase, the results again revealed similar performances, with an R2 of 0.86 and an RMSEP Figure 4. Cross-validation (dark grey circles) and
valida-tion (light grey squares) results of the PLS regression model. Leghaemoglobin content was measured with cyanmethaemoglobin method and predicted on the basis of nodule NIR spectra. Results are expressed in mg leghaemoglobin g–1 fresh nodules. The regression was constructed on five latent variables. Leghaemoglobin was predicted with a RMSECV of 0.45 and a determination coefficient (R2) of 0.74. When the regression was applied to the spectra used for the validation, the RMSEP was 0.27 and the R2 was 0.90.
Figure 5. Predicted values of leghaemoglobin on individ-ual nodules (mg leghaemoglobin g–1 fresh nodule). Predic-tions were made on each mean NIR spectrum computed for each nodule (light grey circles). Nodules were con-tained in height samples (validation dataset). The mean leghaemoglobin content (dark grey squares) computed on the whole sample was linked with the reference value of leghaemoglobin (observed leghaemoglobin content) measured for the sample with the cyanmethaemoglobin method.
of 0.33. Graphical representations were fairly similar to those reported when applying the complete PLS approach.
Not surprisingly, most of the identified wavelengths were linked to chemical structure containing carbon and nitrogen. These wavelengths are situated in the first overtone, the second overtone and the combina-tion band regions of the NIR spectrum.28 Key
wave-lengths identified at 1461, 1934 and 2110 nm are located in the regions of N–H bonds. The 1934 nm wavelength is also linked to moisture.29 Wavelengths
identified at 1732 nm and 2236 nm are located in the C–H bond regions.
Conclusion
This paper has proposed a new method for leghaemo-globin quantification in dried pea nodules using NIR hyperspectral imaging combined with chemometrics as an alternative to the classical reference cyanmeth-aemoglobin method. The PLS regression gave good results when the whole spectrum of pea nodules was used.
This PLS regression applied to the mean spectrum of individual nodules showed consistent results: nodules collected from the same plant had different leghaemoglobin content, due to the size and age of nodules, and their mean leghaemoglobin content as well as the variability of their leghaemoglobin content tended to increase with plant age.
Using the peaks identified in the b-coefficients graph resulting from the PLS analysis applied to the calibra-tion dataset, seven wavelengths of interest were chosen. A multiple linear regression model was calibrated on these wavelengths to predict leghaemoglobin content. This simpler model gave similar results on the validation
dataset to those of the PLS regression applied to the whole spectrum.
Both proposed approaches showed good correla-tion with the reference method. However, they show some advantages over the reference approach: (i) they are quicker; (ii) they are simpler (once the model is calibrated, the quantification does not depend on operator ability); (iii) they do not involve the use of chemical and potentially dangerous reagents; (iv) the leghaemoglobin content of a single nodule can be predicted. Considering all these advantages and the first results acquired in this study, NIR hyperspec-tral imaging and multispechyperspec-tral analysis have demon-strated strong potential for evaluating the activity of pea nodules through the quantification of leghaemo-globin content. They appear suited to be used within large-scale field studies in order to improve knowl-edge of nitrogen fixation and protein accumulation in legume crops.
Figure 6. Most relevant wavelengths selected using the graphical representation of coefficients against the cor-responding wavelength.
Figure 7. Identification (vertical grey lines) of the seven wavelengths (1461, 1537, 1732, 1934, 2022, 2110 and 2236 nm) that were used to perform multiple linear regression analysis. The wavelengths of interest were reported on the graphical representation of the pea nod-ule spectra used to calibrate the multiple linear regres-sion model.
Acknowledgements
The authors would like to thank Pete Iannetta (James Hutton Institute, Scotland), who gave us the inspira-tion for this work, Patrick du Jardin and Florence Paquet (Gembloux Agro-Bio Tech, University of Liège) for their help in this study and the access they provided to the Plant Biology laboratory, and the CAMI technical platform at the AgrobioChem Department (Gembloux Agro-Bio Tech, University of Liège) for access to the computational server. They would also like to thank Nikaise Kayoka Mukendi from the Valorization of Agricultural Products Department (CRA-W) who helped with NIR image acqui-sition and data preparation, as well as the students of Gembloux Agro-Bio Tech who collected the samples and performed the pre-analysis of the results: Ariel Doudet, Florent Druart, Laëtitia Machiels, Audrey Sougnez, Marine Torfs.
References
1. P. Pourmoayyed, The Effect of Sulfur Deficiency in
Pea (Pisum sativum) on Factors Related to Nitrogen Fixation and on Sulfate Transporters. Rheinischen
Friedrich Wilhelms Universität Bonn (2016).
2. L. Taiz and E. Zeiger, Plant Physiology, 3rd Edn.
Sinauer Associates, Inc., Publishers, Sunderland, Massuchusetts (2002).
3. J.A. Downie, “Legume haemoglobins: symbiotic
nitrogen fixation needs bloody nodules”, Curr Biol
15(6), 196 (2005). doi: https://doi.org/10.1016/j. cub.2005.03.007
4. H.W. Scherer, S. Pacyna, K.R. Spoth and M. Schulz,
“Low levels of ferredoxin, ATP and leghemoglobin contribute to limited N2 fixation of peas (Pisum
sati-vum L.) and alfalfa (Medicago sativa L.) under S
defi-ciency conditions”, Biol. Fert. Soils 44(7), 909 (2008). doi: https://doi.org/10.1007/s00374-008-0273-7
5. O. V. Kosmachevskaya and A.F. Topunov, “Method
of determination of the content of hemoglobin-like proteins in heterogenic mixtures”, Appl.
Biochem. Micro 43(3), 313 (2007). doi: https://doi. org/10.1134/S0003683807030131
6. A. Sharma and S. Sharma, “Effect of nitrogen
and sulphur nutrition on nitrogen assimilating enzymes in soybean roots and nodules”, IJAEB 7(3), 471 (2014). doi: https://doi.org/10.5958/2230-732X.2014.01351.5
7. S. Chouhan, K. Chauhan, S. Kataria and K.N.
Guruprasad, “Enhancement in leghemoglobin con-tent of root nodules by exclusion of solar UV-A and UV-B radiation in soybean”, J. Plant Biol. 51(2), 132 (2008). doi: https://doi.org/10.1007/BF03030722
8. R.G. Orellana, F. Fan and C. Sloger, “Tobacco
rings-pot virus and rhizobium interactions in soybean: impairment of leghemoglobin accumulation and nitrogen fixation”, Phytopathology 68, 577 (1978). doi: https://doi.org/10.1094/Phyto-68-577
9. D.O. Wilson and H.M. Reisenaeur, “Determination
of leghemoglobin in legume nodules”, Anal. Biochem.
6, 27 (1963). doi: https://doi.org/10.1016/0003-2697(63)90004-6
10. B. Nkrumah, S.B. Nguah, N. Sarpong, D. Dekker,
A. Idriss, J. May and Y. Adu-Sarkodie, “Hemoglobin estimation by the hemocue portable hemo-globin photometer in a resource poor setting”,
BMC Clin. Pathol. 11, 1 (2011). doi: https://doi. org/10.1186/1472-6890-11-5
11. T. Srivastava, H. Negandhi, S.B. Neogi, J. Sharma
and R. Saxena, “Methods for hemoglobin estimation: a review of ‘what works’”, J. Hematol. Transfus. 2(3), 2005 (2014).
12. Balasubramaniam and A. Malathi, “Comparative
study of hemoglobin estimated by Drabkin’s and Sahli’s methods”, J. Postgr. Med. 38(1), 8 (1992).
13. L.M. Dale, A. Thewis, I. Rotar, J.A. Fernández
Pierna, C. Boudry, R.M. Vidican and V. Baeten, “Chemometric tools for NIRS and NIR hypespectral
imaging”, Bull. UASVM Agric. 69(1), 70 (2012). doi:
https://doi.org/10.15835/buasvmcn-agr:8658
14. S. Wold, “Chemometrics; what do we mean with
it, and what do we want from it?”, Chemometr.
Intell. Lab. Syst. 30(1), 109 (1995). doi: https://doi. org/10.1016/0169-7439(95)00042-9
15. G. Höflich, M. Tauschke, G. Kühn and J. Rogasik,
“Influence of agricultural crops and fertilization on microbial activity and microorganisms in the rhizo-sphere”, J. Agron. Crop Sci. 184(1), 49 (2000). doi:
https://doi.org/10.1046/j.1439-037X.2000.00369.x
16. T. Sato, H. Yashima, N. Ohtake, K. Sueyoshi, S. Akao,
J.E. Harper and T. Ohyama, “Determination of leghe-moglobin components and xylem sap composition by capillary electrophoresis in hypernodulation soy-bean mutants cultivated in the field”, Soil Sci. Plant
Nutr. 44(4), 635 (1998). doi: https://doi.org/10.1080/ 00380768.1998.10414487
17. D.L. Drabkin and J.H. Austin, “Preparation from
washed blood cells; nitric oxide hemoglobin and sulfhemoglobin”, J. Biol. Chem. 112, 51 (1935). doi:
https://doi.org/10.1016/S0065-2423(08)60414-X
18. P. Vermeulen, J.A. Fernández Pierna, H.P. van
Egmond, P. Dardenne and V. Baeten, “Online detec-tion and quantificadetec-tion of ergot bodies in cereals using near infrared hyperspectral imaging”, Food
Addit. Contam. A 29(2), 232 (2012). doi: https://doi. org/10.1080/19440049.2011.627573
19. D. Eylenbosch, B. Bodson, V. Baeten and
J.A. Fernández Pierna, “NIR hyperspectral imaging spectroscopy and chemometrics for the discrimina-tion of roots and crop residues extracted from soil samples”, J Chemometr. 32(1), 1 (2017). doi: https:// doi.org/10.1002/cem.2982
20. D. Liu, D.-W. Sun and X.-A. Zeng, “Recent advances
in wavelength selection techniques for hyperspec-tral image processing in the food industry”, Food
Bioprocess Tech. 7(2), 307 (2013). doi: https://doi. org/10.1007/s11947-013-1193-6
21. R Core Team, R: A Language and Environment for
Statistical Computing. R Foundation for Statistical
Computing, Vienna, Austria (2017).
22. F. Mendiburu and R. Simon, “Agricolae—ten years
of an open source statistical tool for experiments in breeding, agriculture and biology”, PeerJ Prepr.
3, 1 (2015). doi: https://doi.org/10.7287/peerj. preprints.1404v1
23. S. Xu, X. Shi, M. Wang and Y. Zhao, “Determination
of rice root density at the field level using visible and near-infrared reflectance spectroscopy”, Geoderma
267, 174 (2016). doi: https://doi.org/10.1016/j.geo-derma.2016.01.007
24. W. Saeys, A.M. Mouazen and H. Ramon, “Potential
for onsite and online analysis of pig manure using visible and near infrared reflectance spectroscopy”,
Biosyst. Eng. 91(4), 393 (2005). doi: https://doi. org/10.1016/j.biosystemseng.2005.05.001
25. L.M. Dale, A. Thewis, C. Boudry, I. Rotar,
F.S. Păcurar, O. Abbas, P. Dardenne, V. Baeten, J. Pfister and J.A. Fernández Pierna, “Discrimination of grassland species and their classification in botanical families by laboratory scale NIR hyperspectral imag-ing: preliminary results”, Talanta 116, 149 (2013). doi:
https://doi.org/10.1016/j.talanta.2013.05.006
26. J.A. Fernández Pierna, P. Vermeulen, O. Amand, A.
Tossens, P. Dardenne and V. Baeten, “NIR hyper-spectral imaging spectroscopy and chemometrics for the detection of undesirable substances in food and feed”, Chemometr. Intell. Lab. 117, 233 (2012). doi:
https://doi.org/10.1016/j.chemolab.2012.02.004
27. P. Williams, P. Geladi, G. Fox and M. Manley, “Maize
kernel hardness classification by near infrared (NIR) hyperspectral imaging and multivariate data analy-sis”, Anal. Chim. Acta 653, 121 (2009). doi: https:// doi.org/10.1016/j.aca.2009.09.005
28. Metrohm, NIR Spectroscopy : A Guide to Near-Infrared
Spectroscopic Analysis of Industrial Manufacturing Processes. Metrohm AG, Herisau, Switzerland (2013).
29. N. Caporaso, M.B. Whitworth and I.D. Fisk,
“Protein content prediction in single wheat kernels using hyperspectral imaging”, Food Chem. 240, 32 (2018). doi: https://doi.org/10.1016/j.food-chem.2017.07.048