Any correspondence concerning this service should be sent to the repository
administrator: [email protected]
O
pen
A
rchive
T
OULOUSE
A
rchive
O
uverte (
OATAO
)
OATAO is an open access repository that collects the work of Toulouse researchers and
makes it freely available over the web where possible.
This is an author-deposited version published in:
http://oatao.univ-toulouse.fr/
Eprints ID: 16202
To cite this version:
Causse, Mickael and Dehais, Frédéric and Faaland,
Philippe-Olivier and Cauchard, Fabrice An analysis of mental workload and psychological
stress in pilots during actual flight using heart rate and subjective measurements.
(2012) In: 5th International Conference on Research in Air Transportation (ICRAT
2012), 22 May 2012 - 25 May 2012 (Berkeley, United States).
An analysis of mental workload and psychological
stress in pilots during actual flight using heart rate and
subjective measurements
Mickaël Causse, Frédéric Dehais, Philippe-Olivier Faaland, Fabrice Cauchard
Institut supérieur de l’aéronautique et de l’espace. Centre Aéronautique et Spatial. Université de Toulouse, France.
Abstract—We explored in the same study the two concepts of
mental workload and psychological stress and their relationships with piloting activity and heart rate in low experienced pilots. Three low experienced pilots (3 males) performed 12 real flights in visual condition (lasting approximately 60 min) with a single engine piston Socata TB-20. Results revealed higher mental workload and stress levels for take-off and landing in comparison to other flight segments. Cardiovascular measurements revealed consistent result as the highest heart rate responses (in comparison to a resting heart rate baseline) occurred during take-off (+45.23%) and landing (+29.90%). We also found a significant positive correlation between heart rate and mental workload/stress levels. In addition, mental workload and psychological stress levels during the various flight segments were positively correlated. With the exception of a positive correlation between mental workload and flight performances during the cruise segment only, we were not able to uncover tangible results regarding the relationship between workload/stress, heart rate and flight performances. This latter aspect is discussed in relation to the Yerkes-Dodson law.
Keywords-flight performance; mental workload; psychological stress; heart rate response.
I. INTRODUCTION
Contrary to commercial aviation (CA) pilots, general aviation (GA) pilots have not necessarily experienced a professional training. They fly mostly on their own, without any co-pilot, and with very few assistance systems. They have less support from the air traffic control and are more affected by weather conditions. Not surprisingly, in GA, the accident rate is considerably higher than in CA [1]. Li and coworkers [2] analyzed NTSB1 data files and showed that pilot errors were a probable crash cause in 38% of the airline crashes and in 85% of the crashes in the GA. Determining which factors are predictive of such errors is a challenge of high importance to improve safety in GA. Several of these factors suspected to
1 National Transportation Safety Board: independent U.S.
federal government agency responsible for civil transportation accident investigation.
influence flight performance could be assessed by classical medical examination and cognitive test batteries, to help preventing dangerous behaviors. For instance, this is the case for cognitive decline [3] [4] [5], fatigue [6] and substance consumption [7]. On the other hand, during the flight, pilots are confronted with various stressors that affect their performance, including high mental workload, bad weather conditions, or emotional stress [8]. Although these factors may have a strong impact on flight safety, they cannot always be easily anticipated.
In aeronautics, the impact of psychological stress and workload on flight performance is a well known issue [9] [10] [11]. Various subjective methods, such as the NASA Task Load Index (NASA TLX) [12], are commonly used to assess these 2 concepts. Moreover, numerous researches with psychophysiological measurements have been conducted to derive the level of stress and workload from measurements of the autonomic nervous system (ANS) activity. For instance, Veltman & Gaillard [13] showed that heart rate (HR) and blood pressure were both affected by the levels of task difficulty of segments during a simulated flight scenario. Lee and Liu [14] showed that delta (∆) mean HR varied significantly according to the flight phases in a Boeing 747–400 flight simulator. In their study, the ∆HR was the highest during landing (18.8 bpm), followed by take-off (14.2 bpm), approach (10.6 bpm), and cruise (7.1 bpm) phase.In addition,Lee and Liu [14] found that the ∆HR was significantly related to mental workload (assessed by the NASA TLX). Similarly, Wilson [15] showed in real flight (Piper Arrow) that HR increased in response to the evolution of the mental demand. It is worth pointing out that the cardiovascular activity in flight depends also on the level of experience of the operators, as it tends to be negatively correlated with the number of flight hours [16] [17].
Although several studies consistently showed that increased HR is associated with a high mental workload [13] [14] [15], few studies established a clear link between cardiovascular activity and stress [18]. The study conducted by Roscoe [9] showed that this measure is influenced by workload-related factors and not by emotional stressors. Eventually, both mental workload and stress concepts are often used indistinctively and disentangling their respective impact remains complex. Stress and workload are two concepts that are often confused because
they are used to describe similar phenomena. It is generally assumed that a high mental workload leads to an increase in psychological stress and physiological response. However, the relationship between mental workload and stress is probably much more complicated. An intensive activity may yield a high level of workload without eliciting a high stress level, and a high stress level may occur when the workload is low [19]. In addition, even if mental load and stress are supposed to be triggered by different mechanisms— effort vs. emotion—, underpinned by distinct brain center—cortex vs. limbic system— and modulated by the level of energy mobilization, mood and coping strategy [20], the probability of observing correlation between these two subjective measures in demanding tasks seems high. It would be useful to distinguish more precisely their respective role on flight performance for orienting further Crew Ressource Management (CRM) program and/or improving interpretation of online physiological monitoring.
In the present study, private licensed pilots performed real flights with a Socata TB-20. The goal was to investigate the relationships between mental workload, psychological stress, heart rate, and the piloting performance. Five segments were distinguished for each flight, and the pilot performance was assessed for each of these phases on the basis of several flight parameters recorded by an embedded device. The pilots’ cardiac activity was constantly monitored by means of an electrocardiogram equipment. During the flight, immediately after each flight phase, a subjective assessment of mental workload and psychological stress level was performed verbally on a 9-point scale (one subjective rating for the workload and another for the stress level). After each flight, the verbal workload and stress ratings were collected for the entire flight, and the workload was also assessed by means of the standard NASA TLX to compare the results with the verbal procedure in order to ensure its validity.
II. METHOD
A. Participants
Three low experienced pilots (3 males) participated in the experiment. Their mean age was 21.33 years (SD = 1.52) and their mean flying experience was 76.66 hours (SD = 37.54). The 3 participants were private licensed pilots rated for visual flight conditions and qualified to fly the Socata TB-20. They all received complete information on the study’s goal and experimental conditions and gave their informed consent.
B. Flight performance measurements
The 12 visual flights (mean flight duration = 63.37 min, SD = 33.73) were performed with a single engine piston Socata TB-20 with retractable landing Gear (see Fig. 1). Each flight consisted of 5 flight segments: take-off, initial climb, cruise, descent/approach, and landing. An AeroBox© embedded in the aircraft recorded various flight parameters in order to assess the flight performance of the pilots (see Table 1). This device was equipped with a GPS which allowed the monitoring of the altitude, the route followed by the aircraft and the ground
speed. In addition, an embedded accelerometer tracked the evolution of the load factor (+/- 6g, sampling rate = 40 Hz). These various parameters were aggregated to define a composite flight performance score for each flight phase. A mean score for each flight was also computed by averaging the performance score of the 5 flight phases.
Figure 1. The Socata TB-20 aircraft used during the experimentations
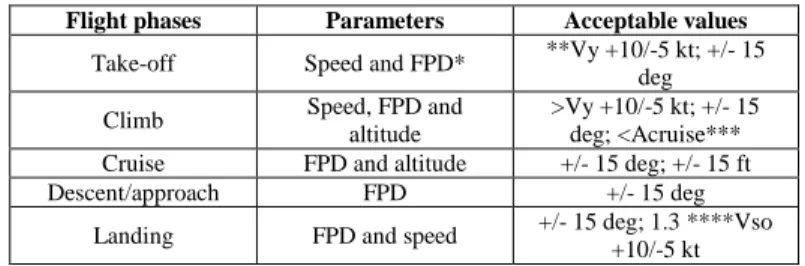
TABLE I. THE VARIOUS PARAMETERS USED TO ESTIMATE THE FLIGHT PERFORMANCE SCORE FOR EACH FLIGHT PHASE.
Flight phases Parameters Acceptable values
Take-off Speed and FPD* **Vy +10/-5 kt; +/- 15 deg Climb Speed, FPD and
altitude
>Vy +10/-5 kt; +/- 15 deg; <Acruise*** Cruise FPD and altitude +/- 15 deg; +/- 15 ft Descent/approach FPD +/- 15 deg
Landing FPD and speed +/- 15 deg; 1.3 ****Vso +10/-5 kt
*FPD = Flight Path Deviation in degrees; ** Vy = Best rate of climb speed; *** Acruise = cruise altitude; ****Vso = Stall speed in the landing configuration with full flaps and gear down (Metrics inspired from the private pilot Practical Test Standards).
C. Subjective ratings of mental workload and psychological stress
After each flight, a subjective assessment of the workload elicited by the entire flight was performed by means of the NASA-TLX standard procedure [12]. The NASA-TLX is a multi-dimensional rating procedure that provides an overall workload score based on a weighted average of ratings on six subscales, namely mental demands, physical demands, temporal demands, own performance, effort, and frustration. In addition, immediately after each flight segment, two subjective ratings assessing the mental workload and the psychological stress levels were collected verbally on a 9-point scale. For obvious reasons, this synthetic verbal assessment was more convenient in-flight than the NASA-TLX. After each flight, the verbal ratings were also collected for the entire flight in order to ensure the validity of this verbal assessment procedure, by
comparing the obtained results with the results collected with the standard NASA TLX procedure.
D. Cardiovascular measurements
An electrocardiogram (ProComp Infinity system, Thought Technology) was used to monitor (sampling rate = 2048 Hz) the participants’ cardiac activity during the entire flights. Three electrodes connected to an extender cable were applied to the participant’s chest using a Uni-Gel to enhance the quality of the signal. The BioGraph Infiniti© software was used to export and filter the HR derived from the inter-beat interval. Due to a commonly observed difference in HR baseline values among participants, HR work/rest ratio were computed for each pilot to allow a between-participant comparison: the HR was recorded at rest for 5 min before flying while participants sat in a comfortable chair without any stimulation. The mean HR collected in-flight were divided by the mean HR at rest. This data reduction provided the mean HR responses during the flights. Mean HR responses were computed for each flight phase and for the entire flights.
III. RESULTS
A. Statistical analysis
All behavioral, subjective and cardiovascular data were analyzed with Statistica 7.1 (© StatSoft). We first analyzed the relationships between all dependent variables related to the whole flight duration. Before considering the data of the 3 pilots altogether in the same analysis, we checked for potential inter-individual differences for each dependant variable. A Kruskal-Wallis ANOVA showed no difference between the 3 pilots on none of the considered dependant variables. On the basis of these results, we considered the 4 flights of the 3 pilots (= 12 flights) as independent observation in all analyses. Non-Correlations were computed among all considered dependent variables. The Bonferroni–Holm [21] correction was applied to control the familywise error rate (corrected p-value are reported). We examined the effects of the different flight segments on the various dependent variables. As the Kolmogorov-Smirnov goodness-of-fit test showed that the distribution of the variables was not normal, we used non-parametric Friedman’s ANOVA and Wilcoxon Signed-rank tests (post-hoc comparison tests).
B. Subjective ratings and piloting activity
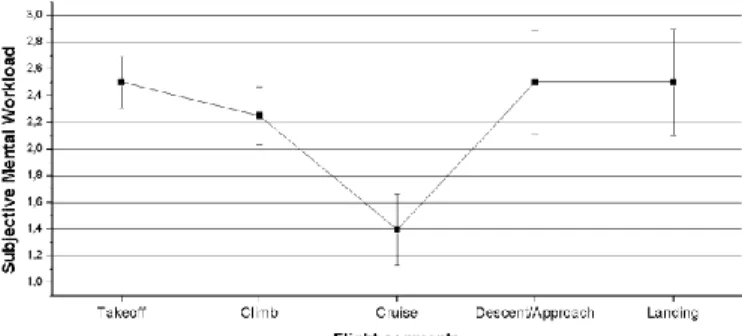
Friedman’s ANOVA revealed a significant effect of the flight segments on the mental workload (χ2(4) = 9.80, p = .043). In particular the Wilcoxon Signed-rank tests showed that the mental workload was significantly lower during the cruise than during the take-off (Z = +2.74, p = .006), the climb (Z = +2.31, p = .020), the descent/approach (Z = +1.96, p = .049) and the landing phases (Z = +2.13, p = .032). The highest
mental workload was observed during takeoff,
descent/approach and landing phases, see Fig. 2.
Figure 2. Mean mental workload across the five flight phases. Error bars represent the standard error of the mean (12 flights).
We found very similar results concerning the psychological stress level. ANOVA showed that the stress level was significantly different according to the various flight phases (χ2(4) = 14.59, p = .005). In particular the Wilcoxon Signed-rank test showed that the stress was lower during the cruise than during the take-off (Z = +3.05, p = .002), the climb (Z = +2.35, p = .018), the descent/approach (Z = +2.17, p = .029) and the landing phases (Z = +2.22, p = .026). The highest psychological stress levels were observed during takeoff and landing phases, see Fig. 3.
Figure 3. Mean psychological stress level across the five flight phases. Error bars represent the standard error of the mean (12 flights).
Regressions analyses revealed no significant correlations between the subjective variables and the whole flight performances. However, interestingly, the correlation computed on each flight segment revealed a significant positive correlation (surviving the Bonferroni–Holm correction) between the mental workload and the flight performances during the cruise segment (p = .045, r = +.73). The piloting performances were better when the mental workload was high during this phase.
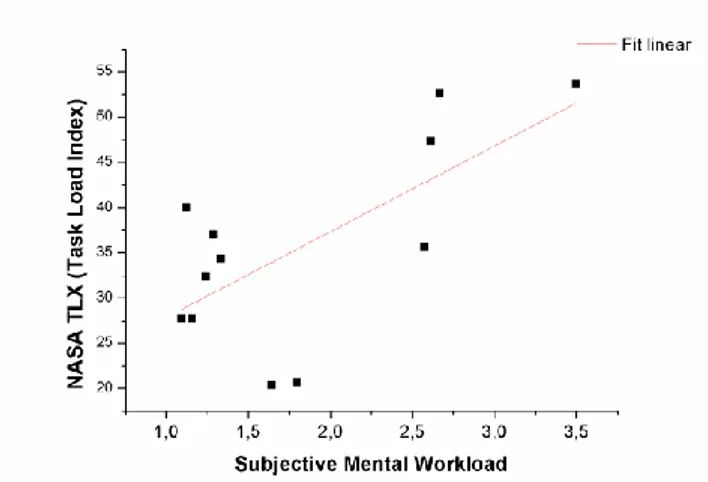
When considering the data for the entire flights irrespective of the flight phases, the analyses yielded a positive correlation between the mental workload (assessed verbally) and the NASA TLX (p = .015, r = +.68), see Fig. 4. This result confirmed the validity of our verbal subjective assessment procedure.
Figure 4. NASA TLX regressed on the mental workload measured with the verbal procedure (12 flights).
The results confirmed a strong relationship between the mental workload and the psychological stress. We found a significant positive correlation between the mental workload (assessed by both the NASA TLX and the verbal procedure), and the psychological stress (respectively, p < .001, r = +.86; p = .005, r = +.74), see Fig. 5 and Fig. 6.
Figure 5. Mental workload, measured with the verbal procedure, regressed on the psychological stress level (12 flights).
Figure 6. Workload, measured with the NASA TLX procedure, regressed on the psychological stress measured with the verbal procedure (12 flights).
C. Heart rate response and piloting activity
The analyses computed on the HR data standardized against the HR at rest (see Method) revealed a significant effect of flight segment on HR response (χ2(4) = 26.00, p < .001). In coherence with the results obtained with the subjective ratings, HR response was lower during the cruise than all the other phases, namely the take-off (Z = +2.93, p = .003), the climb (Z = +2.93, p = .033), the descent/approach (Z = +2.19, p = .028) and the landing (Z = +2.80, p = .005). In addition, HR response was higher during the take-off than during the climb (Z = +2.13, p = .032), the descent/approach (Z = +2.70, p = .006), and the landing (Z = +2.130, p = .032), see figure 6. Considering the raw HR data, the difference between the HR at rest and the in-flight HR was the highest during take-off (+45.23%), climb (31.79%), and landing (+29.90%). The difference was the lowest during descent/approach (+21.52%) and the cruise (+14.06%), see Fig. 7 and Fig. 8. The highest resting-flight difference we observed was 97% (from 58.84 bpm to 115.91 bpm) during take-off. The same pilot demonstrated a difference of 71.5% (from 52.66 bpm to 90.31 bpm) during landing. It was also the highest observed resting-flight difference for this latter resting-flight phase.
Figure 7. Hear rate response across the five flight phases. Error bars represent the standard error of the mean (12 flights).
Figure 8. Illustration of the typical heart rate response during the five phases of a flight for one pilot. In particular, heart rate was higher during
take-off/climb and landing in comparison to cruise.
Regressions analyses revealed no significant correlation between the different physiological and subjective variables with the piloting performance. However we found a strong positive correlation between workload and HR response. Results were significant for both the NASA TLX and the mental workload measures (respectively, p = .002, r = +.82; p < .001, r = +.87), see Fig. 9 and Fig. 10.
Figure 9. Heart rate response regressed on the workload measured with the NASA TLX (12 flights).
Figure 10. Heart rate response regressed on the mental workload measured with the verbal procedure (12 flights).
Finally, the results showed a very strong positive correlation between HR response (p < .001, r = +.91) and psychological stress. Interestingly, within two flights, a same pilot reported the highest stress level (3.53 and 3.58) and demonstrated the higher HR response (+59% and +53 %), see Fig. 11.
Figure 11. Heart rate response regressed on the psychological stress measured with the verbal procedure (12 flights).
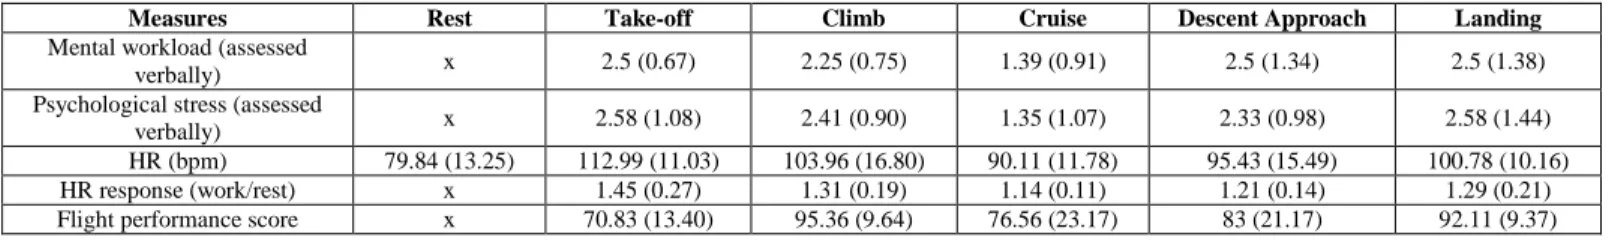
TABLE II. COMPARISON OF SUBJECTIVE, CARDIAC AND PERFORMANCE VARIABLES ACROSS THE FIVE FLIGHT PHASES.DATA ARE PRESENTED AS MEAN (SD). HR DURING REST IS ALSO PRESENTED.NASATLX WAS ONLY COLLECTED AT THE END OF THE FLIGHT TO ASSESS THE OVERALL FLIGHT WORKLOAD.
Measures Rest Take-off Climb Cruise Descent Approach Landing
Mental workload (assessed
verbally) x 2.5 (0.67) 2.25 (0.75) 1.39 (0.91) 2.5 (1.34) 2.5 (1.38) Psychological stress (assessed
verbally) x 2.58 (1.08) 2.41 (0.90) 1.35 (1.07) 2.33 (0.98) 2.58 (1.44) HR (bpm) 79.84 (13.25) 112.99 (11.03) 103.96 (16.80) 90.11 (11.78) 95.43 (15.49) 100.78 (10.16) HR response (work/rest) x 1.45 (0.27) 1.31 (0.19) 1.14 (0.11) 1.21 (0.14) 1.29 (0.21) Flight performance score x 70.83 (13.40) 95.36 (9.64) 76.56 (23.17) 83 (21.17) 92.11 (9.37)
IV. DISCUSSION
We explored in the same study the two concepts of mental workload and psychological stress and their relationships with piloting activity and heart rate in low experienced pilots.
The subjective results confirmed that the various flight phases elicited clearly different levels of mental workload and psychological stress. More specifically, the results revealed both highest mental workload and psychological stress for take-off and landing. Inter-correlation among the subjective variables confirmed the validity of our verbal in-flight mental workload assessment procedure. The measurements we collected by means of this verbal procedure were indeed very similar to the ones obtained with the standard NASA TLX. Thus, the verbal procedure we used seems valuable for in-flight subjective assessments when, for obvious reasons, filling in NASA TLX questionnaire is not always possible.
Interestingly, the analysis confirmed the tight link between mental workload and psychological stress. Mental workload and psychological stress level during the various flight phases were positively correlated. In addition, we found a significant positive correlation between HR and mental workload/psychological stress. This latter outcome confirmed that, in our study, there was a good consistence between subjective feelings of the pilot and their internal objective physiological state. However, the examination of the relationship between subjective rating and flight performance did not reveal any convincing results. We only found a significant positive correlation between mental workload and flight performance during the cruise phase. This result may appear counterintuitive as increased workload was positively correlated with a better flight performance during the cruise. The positive correlation may reflect a slight increase of mental effort that resulted in a more rigorous flight management. Moreover, one should consider that the variations in mental workload and psychological stress level during the 12 flights were insufficient to provoke a notable decline of flight performances. Indeed, the subjective results tend to support this argument, as the highest stress level we observed (during take-off) was only 2.58 (on a 1-9 scale). Yerkes-Dodson law [22] which predicts a negative quadratic relationship between arousal and performance (“inverted-U’ hypothesis”), and a lower level of arousal for optimal performance on more difficult tasks than easier tasks (“task difficulty” hypothesis), still brings a valuable framework to better understand the relationship between arousal and human performance. For instance, Watters et al. [23] showed using caffeine that the ‘inverted-U’ hypothesis was supported in three out of four experimental conditions (easy and difficult numerical, and difficult alphabetical tasks. In addition, Arent & Landers [24] demonstrated that optimal performance in 104 college-age participants on a simple response time task was seen at 60 and 70 % of maximum arousal. Therefore, a possible explanation for our result, is to consider that the ratio “performance/mental workload” of our pilots was situated somewhere in the “ascending branch” of the inverted U.
In accordance with the subjective ratings, the HR response varied significantly depending on the flight phases. The HR responses were the highest during take-off (+45.23%) and landing (+29.90%). One pilot demonstrated an increase of 97% and 71.5% compared to the resting baseline during takeoff and landing respectively. This important increase tends to point out the high ANS arousal elicited by actual flight in comparison to flight simulator. For instance, the study of Lee and Liu (14] conducted with a 747-400 flight simulator showed mean ∆HR peaks of 14.2 bpm and 18.8 bpm during take-off and landing respectively, whereas mean ∆HR observed in our study were of 33.15 bpm and 20.94 bpm during take-off and landing respectively. Finally, Dussault et al. [16] did not find any variability in HR response depending on the flight phases in a flight simulator. These considerations highlight the potential advantages of performing experiments in real flight conditions, when a high ANS arousal is expected. During the take-off, the pilots push the throttle forward until the air speed reaches V1, and then pull up the aircraft. The pilots must perform numerous operations, including airspeed/altitude management and accurate multi-axis control (with the yoke), all within a very limited time frame, while making critical judgments with respect to the probability of avoiding the take-off. While reaching final approach and landing, the pilots must attend to many tasks including extension of the landing gear, control of flaps and airspeed, and maintenance of aircraft stability. In addition, the heightened accident risk during these two phases may also explain our subjective results [14]. Given the pressures associated with these essential tasks, it is coherent to observe higher mental workload/stress and higher HR during these two phases. The HR findings are consistent with psychophysiological studies that show that HR is influenced by both mental workload [25] [26] and mental stress/emotion [27] [28] [29] [30].
A limitation of this study is the limited sample of participants. We plan to reproduce this experiment with 30 student pilots in a 3-year longitudinal study. Regarding the lack of expertise of this population, we expect to find more tangible results regarding the relationship between workload/emotional arousal, ANS activity and flight performances.
As the operators are the key agents in charge of complex safety-related systems (e.g. air traffic controller), the definition of metrics able to predict their performance is a challenge of paramount importance. Assessing online the mental workload and psychological stress level of pilots in order to anticipate their flight performances would be a very significant step toward aviation safety, for both GA and CA. Our study shows that in-flight continuous HR monitoring could provide valuable information in order to detect increased mental workload and psychological stress in pilots (potential source of air crashes). It is also worth noting that continuous online monitoring gives the opportunity to quickly react with countermeasures (e.g. a very simple informative message with the urgent actions to perform), or automatisms before reaching an irreversible stage. In this context, the
identification of relevant physiological measurements that provide insight into the operator’s objective internal state depending on the working domain at hand is necessary.
ACKNOWLEDGMENTS
The authors would like to thank the flight instructor Daniel Vacher for his help during this work. We would also like to express our sincere gratitude to Adrien Peroy and Vincent Boden who volunteered their time to complete this research.
REFERENCES
[1] Li, G., & Baker, S. (2007). Crash risk in general aviation. Jama,
297(14), 1596.
[2] Li, G., Baker, S., Grabowski, J., & Rebok, G. (2001). Factors associated with pilot error in aviation crashes. Aviation, space, and environmental
medicine, 72(1), 52.
[3] Causse, M., Dehais, F., Arexis, M., & Pastor, J. (2011). Cognitive aging and flight performances in general aviation pilots. Aging,
Neuropsychology, and Cognition, 18(5), 544-561.
[4] Causse, M., Dehais, F., & Pastor, J. (2011). Executive functions and pilot characteristics predict flight simulator performance in general aviation pilots. The International Journal of Aviation Psychology,
21(3), 217-234.
[5] Taylor, J., O'Hara, R., Mumenthaler, M., & Yesavage, J. (2000). Relationship of CogScreen-AE to flight simulator performance and pilot age. Aviation, space, and environmental medicine, 71(4), 373. [6] Caldwell Jr, J. A., Caldwell, J. L., Brown, D. L., & Smith, J. K. (2004). The effects of 37 hours of continuous wakefulness on the physiological arousal, cognitive performance, self-reported mood, and simulator flight performance of F-117A pilots. Military
Psychology, 16(3), 163-181.
[7] Holland Cook, C. C. (1997). Alcohol and aviation. Addiction, 92(5), 539-555.
[8] Hardy, D. J., & Parasuraman, R. (1997). Cognition and flight performance in older pilots. Journal of experimental psychology
applied, 3, 313-348.
[9] Roscoe, A. (1978). Stress and workload in pilots. Aviation, space, and
environmental medicine, 49(4), 630.
[10] Sloan, S., & Cooper, C. (1986). Pilots under stress: Routledge Kegan & Paul.
[11] Stokes, A., & Kite, K. (1994). Flight stress: Stress, fatigue, and
performance in aviation: Avebury Aviation.
[12] Hart, S. G., & Staveland, L. E. (1988). Development of NASA-TLX (Task Load Index): Results of empirical and theoretical research.
Human mental workload, 1, 139-183.
[13] Veltman, J. A., & Gaillard, A. W. (1996). Physiological indices of workload in a simulated flight task. Biol Psychol, 42(3), 323-342. [14] Lee, Y., & Liu, B. (2003). Inflight workload assessment: Comparison of
subjective and physiological measurements. Aviation, Space and
Environmental Medicine, 74(10), 1078-1084.
[15] Wilson, G. (2002). An analysis of mental workload in pilots during flight using multiple psychophysiological measures. The
International Journal of Aviation Psychology, 12(1), 3-18.
[16] Dussault, C., Jouanin, J. C., Philippe, M., & Guezennec, C. Y. (2005). EEG and ECG changes during simulator operation reflect mental workload and vigilance. Aviation, space, and environmental
medicine, 76(4), 344-351.
[17] Yao, Y. J., Chang, Y. M., Xie, X. P., Cao, X. S., Sun, X. Q., & Wu, Y. H. (2008). Heart rate and respiration responses to real traffic pattern flight. Applied psychophysiology and biofeedback, 33(4), 203-209.
[18] Lindqvist, A. (1983). Heart rate variability, cardiac mechanics, and subjectively evaluated stress during simulator flight. Aviation,
space, and environmental medicine.
[19] Chen, F. (2006). Designing human interface in speech technology: Springer-Verlag New York Inc.
[20] Gaillard, A., & Wientjes, C. (1994). Mental load and work stress as two types of energy mobilization. Work & Stress, 8(2), 141-152. [21] Holm, S. (1979). A simple sequentially rejective multiple test procedure.
Scandinavian Journal of Statistics, 6(2), 65-70.
[22] Yerkes, R. M., & Dodson, J. D. (1908). The relation of strength of stimulus to rapidity of habit-information. Journal of comparative
neurology and psychology, 18(5), 459-482.
[23] Watters, P. A., Martin, F., & Schreter, Z. (1997). Caffeine and cognitive performance: The nonlinear Yerkes–Dodson law. Human Psychopharmacology: Clinical and Experimental, 12(3), 249-257. [24] Arent, S. M., & Landers, D. M. (2003). Arousal, anxiety, and
performance: A reexamination of the inverted-U hypothesis. Research quarterly for exercise and sport, 74(4), 436-444. [25] Boutcher, Y. N., & Boutcher, S. H. (2006). Cardiovascular response to
Stroop: effect of verbal response and task difficulty. Biological
psychology, 73(3), 235-241.
[26] Sosnowski, T., Krzywosz-Rynkiewicz, B., & Roguska, J. (2004). Program running versus problem solving: Mental task effect on tonic heart rate. Psychophysiology, 41(3), 467-475.
[27] Brosschot, J. F., & Thayer, J. F. (2003). Heart rate response is longer after negative emotions than after positive emotions. International
Journal of Psychophysiology, 50(3), 181-187.
[28] Causse, M., Baracat, B., Pastor, J., & Dehais, F. (2011). Reward and Uncertainty Favor Risky Decision-Making in Pilots: Evidence from Cardiovascular and Oculometric Measurements. Applied
Psychophysiology and Biofeedback, 36(4), 231-242.
[29] Causse, M., Sénard, J., Démonet, J., & Pastor, J. (2010). Monitoring cognitive and emotional processes through pupil and cardiac response during dynamic versus logical task. Applied psychophysiology and biofeedback, 35(2), 115-123.
[30] Warner, R. M., & Strowman, S. R. (1995). Cardiovascular reactivity and positive/negative affect during conversations. Journal of