Département de géomatique appliquée
Faculté des lettres et sciences humaines
Université de Sherbrooke
Modélisation tridimensionnelle précise de l'environnement à l’aide des systèmes de
photogrammétrie embarqués sur drones
On precise three-dimensional environment modeling via
UAV-based photogrammetric systems
Mozhdeh Shahbazi
Directeur de recherche: Jérome Théau Co-directeur de recherche: Gunho Sohn
Thèse présentée pour l'obtention du grade Philosophiae Doctor (PhD) en télédétection Cheminement en géomatique appliquée
juillet 2016
Composition du jury
Modélisation tridimensionnelle précise de l'environnement à l’aide des systèmes de
photogrammétrie embarqués sur drones
On precise three-dimensional environment modeling via
UAV-based photogrammetric systems
Mozhdeh Shahbazi
Cette thèse a été évaluée par un jury composé des personnes suivantes: Professor Dr. Jérome Théau
Dép. de géomatique appliquée, Université de Sherbrooke, Sherbrooke, QC, Canada Directeur de recherche
Professor Dr. Gunho Sohn
Dep. of Geomatics Engineering, York University, Toronto, ON, Canada Co-directeur de recherche
Professor Dr. Ayman Habib
Lyles School of Civil Engineering, Purdue University, West Lafayette, IN, USA Examinateur externe
Professor Dr. Kalifa Goïta
Dép. de géomatique appliquée, Université de Sherbrooke, Sherbrooke, QC, Canada Examinateur interne
Professor Dr. Jean-Marie Dubois
Dép. de géomatique appliquée, Université de Sherbrooke, Sherbrooke, QC, Canada Examinateur interne
Abstract
Images acquired from unmanned aerial vehicles (UAVs) can provide data with unprecedented spatial and temporal resolution for three-dimensional (3D) modeling. Solutions developed for this purpose are mainly operating based on photogrammetry concepts, namely UAV-Photogrammetry Systems (UAV-PS). Such systems are used in applications where both geospatial and visual information of the environment is required. These applications include, but are not limited to, natural resource management such as precision agriculture, military and police-related services such as traffic-law enforcement, precision engineering such as infrastructure inspection, and health services such as epidemic emergency management.
UAV-photogrammetry systems can be differentiated based on their spatial characteristics in terms of accuracy and resolution. That is some applications, such as precision engineering, require high-resolution and high-accuracy information of the environment (e.g. 3D modeling with less than one centimeter accuracy and resolution). In other applications, lower levels of accuracy might be sufficient, (e.g. wildlife management needing few decimeters of resolution). However, even in those applications, the specific characteristics of UAV-PSs should be well considered in the steps of both system development and application in order to yield satisfying results.
In this regard, this thesis presents a comprehensive review of the applications of unmanned aerial imagery, where the objective was to determine the challenges that remote-sensing applications of UAV systems currently face. This review also allowed recognizing the specific characteristics and requirements of UAV-PSs, which are mostly ignored or not thoroughly assessed in recent studies.
Accordingly, the focus of the first part of this thesis is on exploring the methodological and experimental aspects of implementing a UAV-PS. The developed system was extensively evaluated for precise modeling of an open-pit gravel mine and performing volumetric-change measurements. This application was selected for two main reasons. Firstly, this case study provided a challenging environment for 3D modeling, in terms of scale changes, terrain relief variations as well as structure and texture diversities. Secondly, open-pit-mine monitoring demands high levels of accuracy, which justifies our efforts to improve the developed UAV-PS to its maximum capacities. The hardware of the system consisted of an electric-powered helicopter, a high-resolution digital camera, and an inertial navigation system. The software of the system included the in-house programs specifically designed for camera calibration, platform calibration, system integration, onboard data acquisition, flight planning and ground control point (GCP) detection. The detailed features of the system are discussed in the thesis, and solutions are proposed in order to enhance the system and its photogrammetric outputs. The accuracy of the results was evaluated under various mapping conditions, including direct georeferencing and indirect georeferencing with different numbers, distributions and types of ground control points. Additionally, the effects of imaging configuration and network stability on modeling accuracy were assessed.
The second part of this thesis concentrates on improving the techniques of sparse and dense reconstruction. The proposed solutions are alternatives to traditional aerial photogrammetry techniques, properly adapted to specific characteristics of unmanned, low-altitude imagery. Firstly, a method was
developed for robust sparse matching and epipolar-geometry estimation. The main achievement of this method was its capacity to handle a very high percentage of outliers (errors among corresponding points) with remarkable computational efficiency (compared to the state-of-the-art techniques). Secondly, a block bundle adjustment (BBA) strategy was proposed based on the integration of intrinsic camera calibration parameters as pseudo-observations to Gauss-Helmert model. The principal advantage of this strategy was controlling the adverse effect of unstable imaging networks and noisy image observations on the accuracy of self-calibration. The sparse implementation of this strategy was also performed, which allowed its application to data sets containing a lot of tie points. Finally, the concepts of intrinsic curves were revisited for dense stereo matching. The proposed technique could achieve a high level of accuracy and efficiency by searching only through a small fraction of the whole disparity search space as well as internally handling occlusions and matching ambiguities. These photogrammetric solutions were extensively tested using synthetic data, close-range images and the images acquired from the gravel-pit mine. Achieving absolute 3D mapping accuracy of 11±7 mm illustrated the success of this system for high-precision modeling of the environment.
Résumé
Les images acquises à l’aide d’aéronefs sans pilote (ASP) permettent de produire des données de résolutions spatiales et temporelles uniques pour la modélisation tridimensionnelle (3D). Les solutions développées pour ce secteur d’activité sont principalement basées sur des concepts de photogrammétrie et peuvent être identifiées comme des systèmes photogrammétriques embarqués sur aéronefs sans pilote (SP-ASP). Ils sont utilisés dans plusieurs applications environnementales où l’information géospatiale et visuelle est essentielle. Ces applications incluent notamment la gestion des ressources naturelles (ex. : agriculture de précision), la sécurité publique et militaire (ex. : gestion du trafic), les services d’ingénierie (ex. : inspection de bâtiments) et les services de santé publique (ex. : épidémiologie et gestion des risques).
Les SP-ASP peuvent être subdivisés en catégories selon les besoins en termes de précision et de résolution. En effet, dans certains cas, tel qu’en ingénierie, l’information sur l’environnement doit être de haute précision et de haute résolution (ex. : modélisation 3D avec une précision et une résolution inférieure à un centimètre). Pour d’autres applications, tel qu’en gestion de la faune sauvage, des niveaux de précision et de résolution moindres peut être suffisants (ex. : résolution de l’ordre de quelques décimètres). Cependant, même dans ce type d’applications les caractéristiques des SP-ASP devraient être prises en considération dans le développement des systèmes et dans leur utilisation, et ce, pour atteindre les résultats visés.
À cet égard, cette thèse présente une revue exhaustive des applications de l’imagerie aérienne acquise par ASP et de déterminer les challenges les plus courants. Cette étude a également permis d’établir les caractéristiques et exigences spécifiques des SP-ASP qui sont généralement ignorées ou partiellement discutées dans les études récentes.
En conséquence, la première partie de cette thèse traite des aspects méthodologiques et d’expérimentation de la mise en place d’un SP-ASP. Le système développé a été évalué pour la modélisation précise d’une gravière et utilisé pour réaliser des mesures de changement volumétrique. Cette application a été retenue pour deux raisons principales. Premièrement, ce type de milieu fournit un environnement difficile pour la modélisation, et ce, en termes de changement d’échelle, de changement de relief du terrain ainsi que la grande diversité de structures et de textures. Deuxièment, le suivi de mines à ciel ouvert exige un niveau de précision élevé, ce qui justifie les efforts déployés pour mettre au point un SP-ASP de haute précision. Les composantes matérielles du système consistent en un ASP à propulsion électrique de type hélicoptère, d’une caméra numérique à haute résolution ainsi qu’une station inertielle. La composante logicielle est composée de plusieurs programmes développés particulièrement pour calibrer la caméra et la plateforme, intégrer les systèmes, enregistrer les données, planifier les paramètres de vol et détecter automatiquement les points de contrôle au sol. Les détails complets du système sont abordés dans la thèse et des solutions sont proposées afin d’améliorer le système et la qualité des données photogrammétriques produites. La précision des résultats a été évaluée sous diverses conditions de cartographie, incluant le géoréférencement direct et indirect avec un nombre, une répartition et des types de points de contrôle variés. De plus, les effets de la configuration des images et la stabilité du réseau sur la précision de la modélisation ont été évalués.
La deuxième partie de la thèse porte sur l’amélioration des techniques de reconstruction éparse et dense. Les solutions proposées sont des alternatives aux techniques de photogrammétrie aérienne traditionnelle et adaptée aux caractéristiques particulières de l’imagerie acquise à basse altitude par ASP. Tout d’abord, une méthode robuste de correspondance éparse et d’estimation de la géométrie épipolaire a été développée. L’élément clé de cette méthode est sa capacité à gérer le pourcentage très élevé des valeurs aberrantes (erreurs entre les points correspondants) avec une efficacité de calcul remarquable en comparaison avec les techniques usuelles.
Ensuite, une stratégie d’ajustement de bloc basée sur l’intégration de pseudoobservations du modèle Gauss-Helmert a été proposée. Le principal avantage de cette stratégie consistait à contrôler les effets négatifs du réseau d’images instable et des images bruitées sur la précision de l’autocalibration. Une implémentation éparse de cette stratégie a aussi été réalisée, ce qui a permis de traiter des jeux de données contenant des millions de points de liaison. Finalement, les concepts de courbes intrinsèques ont été revisités pour l’appariement stéréo dense. La technique proposée pourrait atteindre un haut niveau de précision et d’efficacité en recherchant uniquement dans une petite portion de l’espace de recherche des disparités ainsi qu’en traitant les occlusions et les ambigüités d’appariement. Ces solutions photogrammétriques ont été largement testées à l’aide de données synthétiques, d’images à courte portée ainsi que celles acquises sur le site de la gravière. Le système a démontré sa capacité a modélisation dense de l’environnement avec une très haute exactitude en atteignant une précision 3D absolue de l’ordre de 11±7 mm.
Acknowledgements
I would like to thank Dr. Jérome Théau for his supervision, his patience at my difficult moments, his trust on me and his support to initiate my academic life in Canada. I would like to acknowledge his great knowledge of applied remote sensing, which helped me to achieve my research objectives with this regard. Starting my Ph.D. career at Université de Sherbrooke has been due to his belief in my capacities, which I appreciate enormously.
I would like to express my sincere gratitude to my co-supervisor Dr. Gunho Sohn for his generous support of my work, his patience and inspiration, his immense knowledge of photogrammetry, and his endless source of ideas. I would like to thank him for giving me the opportunity of working at York University and joining brainstorming sessions in his lab, and for introducing me to his great international, industrial and academic network. I could not have imagined having a better mentor in my academic life.
This thesis was supported in part by grants from Centre de Géomatique du Québec (CGQ), Fonds de Recherche Québécois sur la Nature et les Technologies (FRQNT), and Natural Sciences and Engineering Research Council of Canada (NSERC). Many thanks to Mr. Patrick Ménard, my industrial advisor at CGQ, without whose generous technical supports for system development and his assistance for data acquisition this thesis would not be accomplished. I would like to thank Mrs. Josée Dalaire, the CEO of CGQ, for her kind and encouraging support of my research even after finishing the period of my scholarship.
I would like to acknowledge and thank Dr. Wolfgang Förstner for his great ideas to improve the saprse matching article, his generous devotion of his time to revise the manuscript and sharing his incredible knowledge of computational stereo with me.
I would like to thank the rest of my thesis committee: Dr. Ayman Habib, Dr. Kalifa Goïta, and Dr. Jean-Marie Dubois, for agreeing to review this dissertation, for their insightful and constructive comments as well as their encouragements. It has been my honor to receive their comments.
The gravel-pit data sets were acquired at Bel-horizon site belonging to DJL Construction Inc. I would like to thank Mr. Michel Laperle, the manager of the site, for his kind support to facilitate the fieldwork. I would like to thank Mr. Kim Desrosiers, Mr. Erwan Gavelle, and ING Robotics’ team members for their assistance in the field work.
I would like to thank Mr. Michael Cohen, the president of Industrial SkyWorks, for providing me with the opportunity of collaborating with his company in a research project, without the financial support of which I could not concentrate on my thesis.
I’m thankful to my office-mates at USherbrooke for their friendly support of me as a non-francophone member, to my lab mates at YorkU for sharing their research experiences with me, and to my colleagues at CGQ for welcoming me in Saguenay region.
Finally yet importantly, I am grateful for the support, kindness and patience of my family during the last few years, even though I could not take a good care of them due to my overloaded volume of work.
Table of Contents
Abstract ... i
Résumé ... iii
Acknowledgements ... v
List of Figures ... xiii
List of Tables ... xvi
Acronyms ... xvii
Reading Guide ... xix
1. Introduction ... 1
1.1 Unmanned Aerial Photogrammetry ... 1
1.2 Challenges of UAV-Photogrammetry ... 3
1.3 Objectives and Assumptions ... 3
1.4 Thesis Structure ... 5
2. Recent Applications of Unmanned Aerial Imagery ... 6
2.1 Article Presentation ... 6
2.1.1 Background ... 6
2.1.2 General methodology ... 6
Recent Applications of Unmanned Aerial Imagery in Natural Resource Management ... 8
2.2 Introduction ... 10
2.3 Precision agriculture and rangeland monitoring ... 12
2.3.1 Land cover mapping and classification ... 12
2.3.2 Crop health monitoring ... 13
2.3.3 Modeling biophysical attributes ... 13
2.3.4 Studying soil characteristics ... 16
2.3.5 Challenges and future perspectives ... 16
2.4.1 Thermal disasters ... 17
2.4.2 Ground displacement ... 18
2.4.3 Floods ... 20
2.4.4 Advantages and issues of UASs ... 20
2.5 Aquatic Ecosystem Management ... 21
2.5.1 Why UAVs? ... 21
2.5.2 Mapping and monitoring aquatic species ... 21
2.5.3 Characterizing water bodies ... 22
2.5.4 Channel bathymetry ... 23
2.5.5 River tracking ... 23
2.5.6 Characterizing thermal properties ... 23
2.6 Polar Remote Sensing ... 23
2.6.1 Advancements of UASs ... 23
2.6.2 Applications of unmanned aerial imagery over the polar regions ... 24
2.7 Wildlife Research ... 24
2.7.1 Bird and mammal detection ... 25
2.7.2 Pros and cons of UASs for wildlife research ... 25
2.8 System Characteristics ... 26
2.9 Conclusion ... 27
2.10 References ... 28
3. System Development: technical and methodological aspects ... 40
3.1 Article Presentation ... 40
3.1.1 Background ... 40
3.1.2 Methodology ... 41
Development and Evaluation of a UAV-Photogrammetry System for Precise 3D Environmental Modeling ... 42
3.2 Introduction ... 44
3.2.2 Environmental Application ... 45 3.3 Equipment ... 46 3.3.1 Platform ... 46 3.3.2 Navigation sensor ... 46 3.3.3 Imaging sensor ... 46 3.3.4 Onboard computer ... 47 3.4 System Development ... 47 3.4.1 Camera calibration ... 47
3.4.2 Aerial platform calibration ... 50
3.4.3 System integration ... 51
3.5 Data Acquisition ... 52
3.5.1 Data-acquisition planning ... 53
3.5.2 Fieldwork ... 53
3.6 Data Processing Workflow ... 55
3.6.1 Image pre-processing ... 55 3.6.2 Photogrammetric processing ... 57 3.7 Experiments ... 59 3.7.1 Laboratory experiments ... 59 3.7.2 Time synchronization ... 59 3.7.3 Photogrammetric tests ... 59
3.8 Results and Discussion ... 63
3.8.1 Calibration results ... 63
3.8.2 Precision of time-synchronization ... 64
3.8.3 Accuracy of 3D point Clouds ... 65
3.8.4 Effects of ground control points ... 68
3.8.5 Effects of imaging configuration ... 70
3.8.6 On-the-job self-calibration results ... 71
3.9 Conclusions ... 74
3.10 References ... 75
4. Sparse Reconstruction- Part I ... 79
4.1 Article Presentation ... 79
4.1.1 Background ... 79
4.1.2 General methodology ... 79
Evolutionary Optimization for Robust Sparse Matching and Epipolar-Geometry Estimation ... 81
4.2 Introduction ... 83
4.3 Related Work ... 84
4.4 Problem Formulation... 87
4.4.1 Fundamental theories: Two-view epipolar geometry ... 87
4.4.2 Robust estimation problem ... 89
4.4.3 Robust Estimation via Genetic Algorithm ... 90
4.4.4 Encoding GA variables ... 91
4.4.5 Sampling GA individuals ... 92
4.4.6 Genetic operators ... 94
4.4.7 Inlier classification ... 96
4.5 Experimental Results and Discussions ... 97
4.5.1 Experiments on synthetic data ... 98
4.5.2 Experiments on real data ... 107
4.6 Conclusion ... 109
4.7 References ... 110
5. Sparse Reconstruction- Part II ... 114
5.1 Application of the proposed sparse matching technique to the gravel-pit dataset ... 114
5.2 Initial EO Parameter Estimation and Sparse Reconstruction ... 114
5.3 Block Bundle Adjustment ... 115
5.3.2 Experimental results ... 120
6. Dense Reconstruction ... 123
6.1 Article Presentation ... 123
6.1.1 Background ... 123
6.1.2 Methodology ... 123
A Dense Stereo Matching Method Using Intrinsic Curves ... 125
6.2 Introduction ... 127
6.3 Related Work ... 127
6.4 Original Concepts of Intrinsic Curves ... 129
6.4.1 Definition ... 129
6.4.2 Matching cost computation ... 130
6.4.3 Local aggregation ... 131
6.4.4 Disparity computation ... 131
6.4.5 Shortcomings of the original concepts ... 131
6.5 Proposed Dense Matching Algorithm ... 132
6.5.1 Hypothesis generation ... 132
6.5.2 Occlusions ... 134
6.5.3 Global energy function ... 135
6.5.4 Approximating inference by belief propagation ... 137
6.5.5 Semi-global optimization ... 138
6.6 Experimental Results... 139
6.6.1 Close-range stereo images ... 139
6.6.2 Aerial stereo images ... 149
6.7 Conclusions ... 151
6.8 References ... 152
7. General Conclusions and Discussions ... 155
7.2 Research Perspectives and Future Work ... 159
8. References ... 160
Appendix I. Intrinsic Camera Calibration ... 162
AI.1 Camera Calibration Model ... 162
AI.2 Bundle Adjustment with Additional Parameters ... 163
AI.3 Stability Analysis ... 165
AI.4 Image Correction ... 167
Appendix II. Initial Recovery of EO Parameters and 3D Object-Space Coordinates of Corresponding Points... 168
AII.1. RO Parameter Estimation ... 168
AII.2. Establishing the Local Coordinate System and Incremental Estimation of EO Parameters and 3D Local Coordinates of Corresponding Points ... 170
AII.3. Geo-referencing the Initial Estimations ... 171
Appendix III. Camera System Reduction in BBA with GHM ... 173
Appendix IV. Intrinsic Calibration Model and Co-linearity Observation Equations in Gauss-Markov Model ... 176
List of Figures
Figure 2.2.1. Examples of low-altitude, unmanned aerial imagery ... 10
Figure 2.2.2. Number of reviewed articles versus publication date. ... 11
Figure 2.2.3. The applications of unmanned aerial imagery in the reviewed studies. ... 12
Figure 3.1.1. Methodological flowchart for system development ... 41
Figure 3.3.1. Equipment... 47
Figure 3.4.1. Camera calibration test-field. ... 48
Figure 3.4.2. Diagram of the target detection method. ... 49
Figure 3.4.3. Test-field for platform calibration. ... 51
Figure 3.5.1. The study area and mapping zones. ... 52
Figure 3.5.2. Interface of the flight-planning software. ... 53
Figure 3.5.3. Surveying plans ... 54
Figure 3.6.1. Photogrammetric workflow to produce topographic data from images. ... 55
Figure 3.6.2. Intensity enhancement ... 56
Figure 3.6.3. Workflow for automatic shadow detection and removal. ... 57
Figure 3.6.4. Workflow for automatic detection of GCPs. ... 57
Figure 3.7.1. Triangulated mesh. ... 60
Figure 3.7.2. Flight trajectory and distribution of checkpoints in dataset A. ... 61
Figure 3.7.3. (a) Experiment to assess the effect of imaging configuration. (b) Connectivity matrix in OverlapTest 1. (c) Connectivity matrix in OvelapTest 2. ... 62
Figure 3.7.4. Self-calibration experiments (a) CalibTest 1. (b) CalibTest 2. (c) CalibTest 3. ... 63
Figure 3.8.1. Calibration results ... 64
Figure 3.8.2. Results of the time-synchronization test... 64
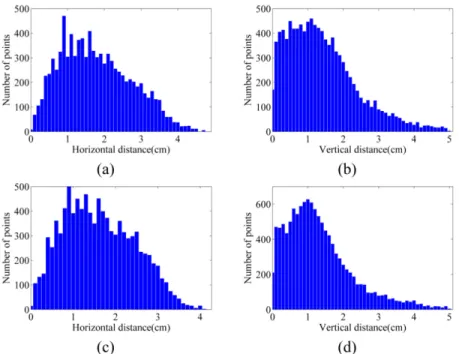
Figure 3.8.3. Histograms of distances between the point clouds from dataset A and laser scanner. .... 65
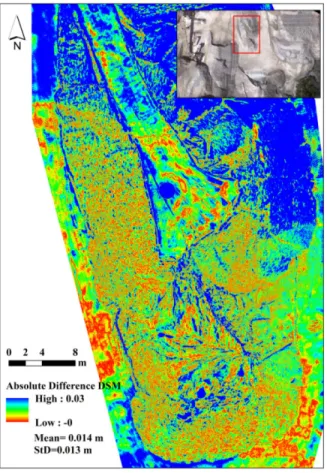
Figure 3.8.4. Absolute difference between the DSM from FARO laser scanner and that of dataset A.66 Figure 3.8.5. Image mosaics of dataset B ... 66
Figure 3.8.6. Histograms of distances between the point clouds from dataset B and laser scanner. ... 67
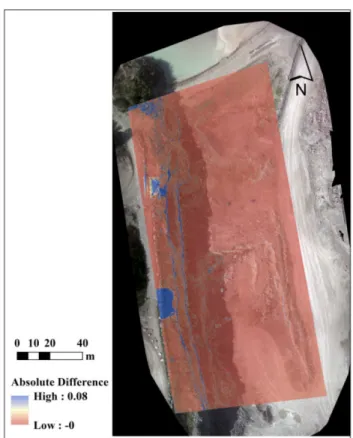
Figure 3.8.7. Absolute difference between the DSMs of dataset B before and after shadow removal.68 Figure 3.8.8. Histograms of distances between the point clouds from dataset C and laser scanner ... 68
Figure 3.8.10. Correlation analysis in self-calibration. ... 72
Figure 3.8.11. (a) Cut/fill regions. (b) Volumetric change measurement. ... 73
Figure 3.8.12. Classified slope map based on dataset A. ... 74
Figure 4.1.1. Methodological flowchart of robust sparse matching ... 80
Figure 4.2.1. Summary of outlier detection techniques in stereo sparse matching based on robust estimation of epipolar geometry ... 84
Figure 4.5.1. Example of a label set for encoding the matches ... 92
Figure 4.5.2. Different examples of sampling strategies to avoid degenerate and ill-configured configurations ... 93
Figure 4.5.3. Guided sampling ... 94
Figure 4.6.1. Performance of sampling methods on Table dataset as the ratio λ increases. ... 100
Figure 4.6.2. Sampling methods on Church dataset as the outlier ratio increases ... 100
Figure 4.6.3. Inlier probability of correspondences obtained using ... 101
Figure 4.6.4. Inlier thresholds. ... 102
Figure 4.6.5. Performance of different algorithms under various percentages of outliers for Multi-view dataset.. ... 103
Figure 4.6.6. Performance of the proposed algorithm from the stability point of view. ... 104
Figure 4.6.7. Performance of the proposed algorithm with noisy images.. ... 105
Figure 4.6.8. Performance of the proposed algorithm with varying GA population size. ... 106
Figure 5.3.1. Error of independent reconstruction using some fixed EO parameters when applying the intrinsic calibration parameters calculated in a different way ... 122
Figure 5.3.2. Accuracy of block bundle adjustment using the proposed strategy and ordinary BA ... 122
Figure 6.1.1. Methodological flowchart for dense matching using intrinsic curves ... 124
Figure 6.4.1. (a) One part of left and right corresponding scanlines; (b) Intrinsic curves of the left and right scanlines (Cl, Cr) in red and blue, respectively. ... 130
Figure 6.4.2. (a) Uniform sampling of a scanline based on position; (b) Non-uniform sampling based on arc-length. ... 132
Figure 6.5.1. (a) One part of left and right corresponding scanlines with partial occlusions; (b) Intrinsic curves demonstrating matched pixels (shown by stars) and occluded pixels (shown by circles in the green frame). ... 134
Figure 6.5.2. Example of intrinsic curves to measure local curvature similarity for occlusion detection ... 135
Figure 6.5.3. The robust function ρ(t) with different parameters ... 137
Figure 6.6.1. Values of curvature similarity, Θ , at non-occluded pixels of a stereo pair ... 146
Figure 6.6.2. Examples of error maps at one-way matching ... 146
Figure 6.6.3. Examples of disparity maps... 148
Figure 6.6.4. Examples of disparity maps and their considerable differences in terms of detail preservation ... 149
Figure 6.6.5. Point clouds generated by dense matching ... 150
Figure 6.6.6. Distance of the LiDAR point cloud from the image-based point clouds and their corresponding histograms ... 151
List of Tables
Table 2.3.1. Summary of the studies on crop attribute modeling via unmanned aerial imagery. ... 14
Table 2.5.1.Summary of the applications of unmanned aerial imagery in mapping and monitoring aquatic species ... 22
Table 2.5.2. Summary of the applications of unmanned aerial imagery for characterizing water bodies22 Table 2.7.1. Applications of unmanned aerial imagery for wildlife research ... 25
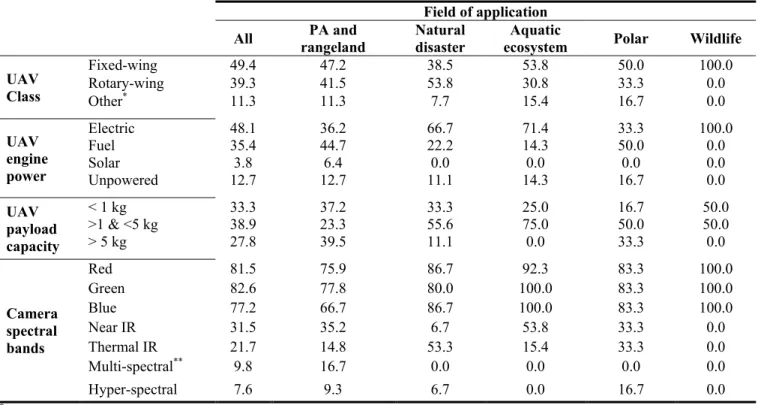
Table 2.8.1. The percentages of the reviewed systems with specific characteristics in each field of application ... 26
Table 3.5.1. Information of the data-acquisition sessions. ... 54
Table 3.7.1. Description of experimental tests for verifying the effect of number/distribution of GCPs. ... 60
Table 3.8.1. Summary of distances between the image-based point clouds and laser-scanner ones. ... 65
Table 3.8.2. Accuracy of direct georeferencing on checkpoints. ... 69
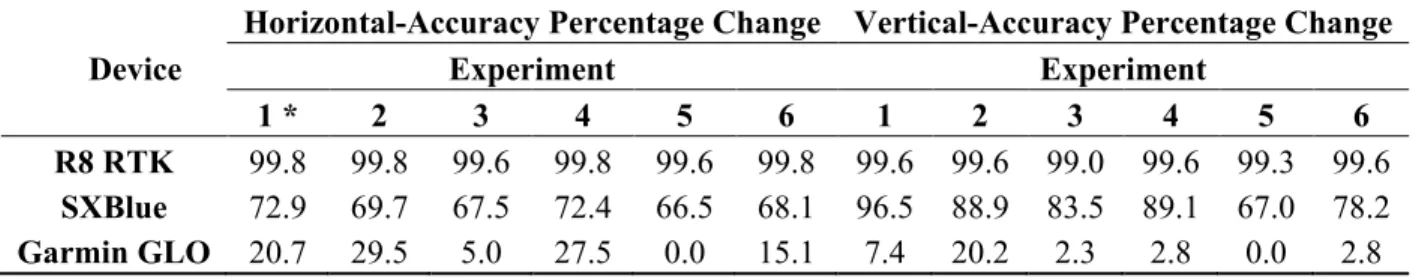
Table 3.8.3. Horizontal and vertical accuracy on checkpoints based on different GCP experiments. .. 70
Table 3.8.4. Improvement rate of accuracy on checkpoints based on different GCP experiments. ... 70
Table 4.5.1. The pseudo-code of the proposed robust estimation technique via genetic algorithm ... 90
Table 4.6.1. Criteria for performance assessment ... 97
Table 4.6.2. Description of synthetic datasets ... 98
Table 4.6.3. Performance of the proposed algorithm and other techniques on real data ... 108
Table 5.1.1. Comparative results of sparse matching for gravel-pit dataset A ... 114
Table 6.6.1. Description of performance-assessment criteria ... 140
Table 6.6.2. Description of dense matching techniques applied for comparative experiments ... 140
Table 6.6.3. Test datasets, ground-truth and calculated disparity maps and performance of the proposed hypothesis-generation algorithm ... 141
Table 6.6.4. Comparative results of dense matching techniques on close-range stereo images ... 145
Acronyms
1D One Dimensional 2D Two Dimensional 3D Three Dimensional AD Absolute Difference BA Bundle AdjustmentBBA Block Bundle Adjustment
BP Belief Propagation
CCD Charge Coupled Device
DLT Direct Linear Transformation
DoF Depth of Field
DP Dynamic Programming
DSI Disparity Space Image
DSM Digital Surface Model
DTM Digital Terrain Model
ECEF Earth-Centered, Earth-Fixed
EO Exterior Orientation
FoV Field of View
GA Genetic Algorithm
GC Graph Cut
GCP Ground Control Point
GFoV GroundField of View
GHM Gauss-Helmert Model
GMM Gauss-Markov Model
GNSS Global Navigation Satellite System
GPS Global Positioning System
iBA Incremental Bundle Adjustment
IC Intrinsic Curves
INS Inertial Navigation System
IO Interior Orientation
LBP Loopy Belief Propagation
LPS Local Plane Sweeps
LM Levenberg–Marquardt
LU Lower Upper
MRF Markov Random Fields
NCC Normalized Cross Correlation
NP-hard Non-deterministic Polynomial-time hard
PA Precision Agriculture
PCG Preconditioned Conjugate Gradients
RANSAC Random Sample Consensus
RMS Root Mean Square
RO Relative Orientation
RS Remote Sensing
RTK Real-Time Kinematics
SfM Structure from Motion
SGM Semi-Global Matching
SIFT Scale-Invariant Feature Transform SLAM Simultaneous Localization and Mapping
SSD Sum of Squared Differences
StD Standard Deviation
SVD Single Value Decomposition
SVM Support Vector Machine
TV Total Variance
UAS Unmanned Aerial System
UAV Unmanned Aerial Vehicle
UAV-PS UAV-Photogrammetry System
Reading Guide
As part of this research project, we have published two articles in scientific ISI journals, GIScience and Remote Sensing as well as Sensors. Two articles are also prepared for submission to Computer Vision and Image Understanding as well as ISPRS Journal of Photogrammetry and Remote Sensing.
Therefore, this thesis is presented in the form of articles based on our four journal publications/submissions. Four technical chapters of the thesis are devoted to the articles. Each chapter contains the following sections: background, general methodology and the original text of the article. Chapter 1 is an exception, which contains the general research background, objectives, and hypotheses. Chapter 5 is also an exception, where extensions are added to Chapter 4 to complete the process of sparse reconstruction with a focus on the strategy of block bundle adjustment. Finally, Chapter 7 is dedicated to overall discussions, conclusions, and future work.
Chapter 1
1. Introduction
1.1 Unmanned Aerial Photogrammetry
Photogrammetry is defined as a set of metrology techniques for three-dimensional measurement of the objects and phenomena indirectly from overlapped images captured from at least two different orientations, namely stereoscopic viewing (Linder, 2006). With this definition, three physical elements are involved in a photogrammetric system: the imaging device (camera), the platform carrying it and the study object. Accordingly, photogrammetry fields can be divided into close-range and aerial ones. In close-range photogrammetry, the distance between the object and the camera is closer than few meters, and the imaging platform is either a handheld device or a terrestrial vehicle (Luhmann et al., 2007). In contrary, aerial photogrammetry is involved with airborne platforms and large (hundreds of meters) distances from the objects. Recently, the advancement of unmanned aerial vehicles (UAVs) and improvement of high-resolution consumer-grade cameras has initiated a new field, namely UAV-photogrammetry.
In general, the techniques of photogrammetry can be divided into two categories. The first group performs conventional photogrammetry on the whole block of acquired images. The techniques of the second group are based on sequential structure-from-motion (SfM) computation, which is performed by successive reconstruction. The second category is applied when real-time mapping from video frames is required. In this thesis, the focus is on conventional photogrammetry. However, the application of the developed algorithms and their efficiency for sequential SfM is also discussed, whenever applicable. In either of the techniques, the main steps of photogrammetric processing include the followings:
− sparse image matching and epipolar-geometry1
− block bundle adjustment,
estimation,
− dense image matching performed on rectified images, and − triangulation and 3D point cloud generation.
In computer-vision vocabulary, the term Structure from Motion is used for referring to the process of sparse matching and motion estimation, as a result of which the sparse 3D structure of the scene can be reconstructed. Similarly, the term dense reconstruction is used for referring to the process of dense matching and 3D point cloud generation. The following paragraphs briefly explain the general
1 Epipolar geometry is the general term used to describe the geometry of stereo vision. There are a number of geometric constraints
between the 3D points and their projections onto the 2D images, e.g. epipoles, epipolar lines, epipolar planes. In this thesis, the epipolar constraints are described by the essential matrix or the fundamental matrix between the two cameras, depending on the availability of intrinsic camera calibration parameters.
description of these steps. However, thorough introduction to the state-of-the-art techniques as well as their challenges and issues can be found in the next chapters of the thesis.
Given two overlapping images, sparse corresponding points (known as tie points, conjugate points, or matches) are detected. These points are selected from salient areas of the image, where reliable, unambiguous matching can be performed. These salient areas are represented by features, which can be points, lines or regions. Different types of descriptors are used to describe the features (Mukherjee et al., 2015; Li and Allinson, 2008; Apollonio et al., 2014). The similarity between the descriptors of one feature in the first image and those of another feature in the second image determines whether they are corresponding or not. These tie points (as image observations) are used to estimate the initial values of relative orientation1
In the case of conventional photogrammetry, image observations of a complete block of images and the initial estimates of 3D object coordinates and orientation parameters are adjusted through block bundle adjustment (BBA). Often, the intrinsic camera(s) calibration parameters are also estimated in the BBA as additional parameters (Ackermann, 1981). The principal outputs of BBA are refined exterior orientation (EO) parameters of images, intrinsic camera calibration parameters, and sparse structure. In the case of sequential SfM, incremental bundle adjustment (iBA) is performed on the observations of some of the frames, called key frames. This aims at avoiding the accumulation of errors in large-scale image sequences while achieving high computational efficiency (Indelman et al., 2012).
parameters and 3D coordinates of the points.
Exterior orientation parameters are used to facilitate dense reconstruction since they add constraints to the relative position of corresponding points. The most common way to apply these constraints is to rectify2 images first and to perform dense stereo/multi-view matching on rectified images then. That is
the corresponding points are located on the same horizontal lines (scanlines) of images. These constraints can also be added explicitly in the objective function of matching, as in dense simultaneous localization and mapping (SLAM) (Engel et al., 2014). The result of dense matching is the disparity map, which represents the offsets (x-parallax) between matches. Disparity maps can be transformed to depth and 3D coordinates using the EO parameters by a process called intersection3
1 Relative orientation parameters are the parameters of a rigid-body transformation that are required to define the relationship between the
photo-coordinates of a stereo-pair.
. Georeferencing the 3D point cloud can be performed along with the BBA using the known coordinates of the ground control points (GCPs), called indirect geo-referencing. It can also be done directly using the exterior orientation parameters of the images measured by the navigation sensors, known as direct geo-referencing. Geo-referencing may also be performed in a separate step from BBA by finding a simple 3D transformation between the arbitrary coordinate system of the generated point cloud and the world coordinate system.
2 Rectification is the process of making stereo image planes parallel to their baseline by defining two new perspective projection matrices
that preserve the optical centres. This ensures that epipoles are moved to infinity, so the epipolar lines become parallel. Moreover, the epipolar line of any point p=(x2,y2) in the right image becomes a horizontal line as y2=y1 in the left image, with p’=(x1,y1) being the
conjugate of p (Fusiello et al., 2000).
1.2 Challenges of UAV-Photogrammetry
Surveying-grade UAV-photogrammetry systems (UAV-PSs) have significant differences from traditional photogrammetry systems, which should be considered carefully in their development and applications. Nowadays, different pre-packaged systems are available commercially, where the sensors and their characteristics are pre-selected. These systems offer certain operational advantages, such as safety and technical support of the manufacturer. However, they offer little flexibility regarding sensor selection and adjustment. When specific requirements of an application cannot be met by such systems, the best practice is developing a system by integrating individual equipment, which best fits the application. In Chapter 3, the research problems with this regard are discussed in details.
The photogrammetric solutions adapted to UAV-PSs should be able to deal with specific characteristics of low-altitude imagery. The most distinctive characteristics of this type of imagery include the followings:
i) Geometric characteristics: high resolution, large perspective distortion, and scale changes due to oblique photography and low flight altitude in comparison with terrain relief, and
ii) Photometric characteristics: uneven distribution of key-points, motion blur, out-of-focus blur, occlusion, foreground motion of features, and noticeable radiometric changes (Zhang et al., 2011; Haala et al., 2013; Hu and Ai, 2011).
Generally, UAV-PSs result in large amounts of high-resolution images with the mentioned characteristics. Therefore, the sparse matching task becomes more challenging and the percentage of outliers (false matches) grows highly. For instance, less outlier would result by matching tree crowns at low-resolution images compared with matching tree leaves in high-resolution images. Hence, robust algorithms with high computational efficiency are essentially required to remove these outliers. Moreover, they need to be robust against image noise, which is a common problem in UAV imagery due to platform characteristics.
Similarly, the techniques of dense image matching should be computation-effective to deal with large volumes of high-resolution images. These techniques should also be robust against irregular range disparities and presence of occlusions, which are common effects in low-altitude imagery.
To the best of the author's knowledge, not all the issues and concerns mentioned herein are considered simultaneously in a comprehensive project for development of a UAV-photogrammetry system.
1.3 Objectives and Assumptions
The general objective of this thesis is to develop a UAV-photogrammetry system that can respond to the 3D-modeling requirements of various engineering and natural-resource-management applications, in terms of accuracy, spatial resolution, and temporal operability. The followings are the particular objectives of this thesis.
• Hypothesis: Understanding pros, cones, issues and technical challenges of recent UAV-applications, as well as the shortcomings of previously developed systems, would allow recognizing the requirements of a high-performance system.
2. Exploring the methodological and experimental aspects of implementing a UAV-PS for ensuring high-quality visual and topographic data
• Hypothesis: A UAV-PS can produce frequent, high-resolution and accurate topographic data if its capacities are maximized by considering the following elements.
̠ Careful camera calibration and assessment of its metric characteristics using a specific test-field configuration, automatic target detection, and stability analysis ̠ Robust system integration to control and synchronize the navigation and imaging
sensors accurately (up to the restrictions of the sensors) without needing any additional mechanism
̠ Pre-planning the flight and data acquisition scenarios
̠ Using a minimal number of GCPs by optimizing their distribution, maximizing their visibility, ensuring the scale consistency of the network, and accurate localization of GCPs on images
̠ Enhancing the radiometric quality of acquired images by pre-processing
These hypotheses are evaluated in the specific application of surveying and volumetric change measurement in an open-pit gravel mine.
3. Developing photogrammetric solutions that are adapted to the characteristics of low-altitude imagery. The specific objectives with this regard include the followings.
3.1. Developing a technique of robust epipolar-geometry estimation and sparse matching based on evolutionary search
• Hypothesis: Conventional random consensus sampling techniques of robust estimation are insufficient to efficiently deal with a very high percentage of errors while the proposed technique is robust to both high outlier and noise ratios.
3.2. Assessing a BBA strategy for on-the-job self-calibration based on integration of pseudo-observations to Gauss-Helmert model
• Hypothesis: The specific configuration of UAV-imaging networks causes high correlation between interior and exterior orientation parameters of cameras, which adversely affect the accurate estimation of intrinsic camera calibration parameters. The proposed strategy can numerically de-correlate the unknowns to increase the accuracy of BBA and independent 3D reconstruction.
3.3. Revisiting the concepts of intrinsic curves for developing an efficient dense stereo matching technique
• Hypothesis: The proposed technique can provide high efficiency and accuracy by searching only through a small fraction of the whole disparity search space (using the original resolution of images) and internally handling occlusions and matching ambiguities.
These hypotheses are mainly evaluated using close-range images since it is believed that the characteristics of low-altitude aerial imagery are very similar to close-range imagery. They are additionally tested by open-pit mine datasets.
1.4 Thesis Structure
This dissertation is organized into six chapters. In the current chapter, the general context and research problematic were presented. Moreover, the objectives and assumptions of the research were defined. The rest of the thesis is organized as follows. The subsequent chapters are devoted to four scientific papers that were written in the course of this research.
Accordingly, Chapter 2 presents our review study on the applications of unmanned aerial imagery. This chapter is formed of an article entitled “Recent Applications of Unmanned Aerial Imagery in Natural Resource Management” which is published in Volume 51 of GIScience & Remote Sensing Journal. Chapter 3 presents different aspects of system development, data acquisition and application in open-pit mine surveying. This chapter is formed of an article entitled “Development and Evaluation of a UAV-Photogrammetry System for Precise 3D Environmental Modeling” which is published in Volume 15 of Sensors journal.
Chapter 4 presents the first part of the proposed technique for sparse reconstruction, including robust sparse matching and epipolar-geometry estimation. This chapter is formed of a manuscript entitled “Evolutionary Optimization for Robust Sparse Matching and Epipolar-Geometry Estimation” which is prepared for submission to Computer Vision and Image Understanding journal.
Chapter 5 presents the second part of the proposed technique for sparse reconstruction, including the structure estimation and bundle adjustment. This chapter, due to its short length, is not presented in the format of an article.
Chapter 6 presents the proposed technique of dense reconstruction, with a focus on dense stereo matching. This chapter is formed of a manuscript entitled “A Dense Stereo Matching Method Using Intrinsic Curves” which is prepared for submission to ISPRS journal of Photogrammetry and Remote Sensing.
Chapter 2
2. Recent Applications of Unmanned Aerial Imagery
2.1 Article Presentation
2.1.1 Background
This article is related to the first specific objective of the thesis, namely studying the recent application of unmanned aerial imagery.
Currently, there are hundreds of commercial developers, whose focus is on the hardware development of unmanned aerial systems. However, less attention has been paid to the development and evaluation of data processing techniques and system requirements with regard to specific applications. Therefore, critical reviews of previous studies are required to assess the current technological and scientific status of unmanned remote sensing (RS) applications.
This article was originally published in GIScience & Remote Sensing Aug 2014 © Informa UK Limited, trading as Taylor & Francis Group, available online: 10.1080/ 15481603.2014.926650.
In this study, a specific category of RS applications was considered, namely natural resource management via unmanned aerial passive imagery. The first reason for this choice was the vast range of applications that could be classified under the flag of natural resource management, such as precision agriculture, rangeland monitoring, natural disaster management, aquatic ecosystem management, polar remote sensing and wildlife research. Therefore, this review could give us a broad insight into unmanned aerial systems dedicated to remote sensing and photogrammetry. The second reason was that all these applications had one technical element in common: they all required visual and geospatial information of the environment. This feature allowed us to study their requirements in terms of imaging sensors and navigation systems. The conclusions made at the end of this study allowed us to make clear decisions regarding the components of our system. The last reason was that surveying and monitoring of open-pit mines (the case study of this thesis) could be categorized in this series of applications.
2.1.2 General methodology
Although more than 200 articles were studied to conduct this review, it was decided to narrow down the research by only considering the articles that represented a complete/semi-complete data-processing chain to achieve their objectives. This selection was made to prove a point, that image acquisition with a UAV is no more a challenging topic in either industry or academia.
In the course of this article, each application is divided to several sub-applications as follows. − Precision agriculture
̠ Crop health monitoring
̠ Modeling biophysical attributes ̠ Studying soil characteristics − Natural disaster management
̠ Thermal disasters ̠ Ground displacement ̠ Floods
− Aquatic ecosystem management
̠ Mapping and monitoring aquatic species ̠ Characterizing water bodies
̠ Channel bathymetry ̠ River tracking
̠ Characterizing thermal properties − Polar remote sensing
− Wildlife research
̠ Bird and mammal detection
First, the methodology and achievements of the studies are presented. Then, the general challenges, issues, and shortcomings as well as the future perspective of the applications are discussed. At the end, a general discussion is provided which gives an inclusive insight to the current characteristics and future requirements of unmanned aerial systems with respect to these applications.
Recent Applications of Unmanned Aerial Imagery in Natural Resource
Management
by Mozhdeh Shahbazi, Jérôme Théau and Patrick Ménard
GIScience & Remote Sensing, ISSN: 1548-1603
Abstract
Unmanned aerial vehicles have become popular platforms for remote sensing applications, particularly when spaceborne technology, manned airborne techniques, and in situ methods are not as efficient for various reasons. These reasons include the temporal and spatial data resolutions, accessibility over time and space, cost efficiency, and operational safety. Given that most commercial developers tend to focus on the hardware development of unmanned aerial systems, less attention is paid to the development and evaluation of their data processing techniques. Therefore, critical reviews of previous studies are required to describe the current state of research using data from unmanned remote sensing platforms. Accordingly, this paper presents the results of a comprehensive review of applications of unmanned aerial imagery for the management of agricultural and natural resources. This review attempts to demonstrate that developing robust methodologies and reliable assessments of results are significant issues for successful applications of unmanned aerial imagery.
Resumé
Les véhicules aériens sans pilote sont devenus des plateformes populaires pour les applications de télédétection, en particulier lorsque la technologie spatioportée, les techniques aéroportées habitées, et les méthodes terrestres ne sont pas assez efficaces pour diverses raisons. Ces raisons incluent notamment les résolutions et accessibilité temporelles et spatiales des données, les couts et la sécurité d’opération. Étant donné que la plupart des développeurs commerciaux ont tendance à se concentrer sur le développement matériel des systèmes aériens sans pilote, moins d'attention est accordée à l'élaboration et à l'évaluation des techniques de traitement des données. Par conséquent, un examen critique des études antérieures est nécessaire pour décrire l'état actuel de la recherche en utilisant des données acquises à l’aide des véhicules aériens sans pilote. Cet article présente donc les résultats d’une revue exhaustive des applications d'imagerie aérienne sans pilote pour la gestion des ressources naturelles et agricoles. Cette revue tente de démontrer que le développement de méthodes robustes et d’évaluations fiables des résultats constituent des aspects critiques pour garantir le succès des applications utilisant l'imagerie aérienne acquise par véhicule aérien sans pilote.
2.2 Introduction
An unmanned aerial system (UAS) is a system comprising a number of sub-systems. These sub-systems include the unmanned aerial vehicle (UAV), vehicle launch (if applicable), control station (terrestrial, marine or aerial), and sensor payload (Gertler 2012).
As with many other remote sensing (RS) systems, the capabilities of UASs were initially explored by military organizations. They were used for different purposes, such as developing weapon platforms and acquiring data for tactical and strategic applications (Watts, Ambrosia, and Hinkley 2012; Austin 2010). In most environmental RS applications, having frequent, quick and/or immediate access to updated data is mandatory. Moreover, the nature of some applications necessitates the use of unmanned control considering the safety, accessibility, and flexibility criteria (Watts, Ambrosia, and Hinkley 2012). UAVs have been identified as secure, lightweight, flexible, and automated platforms for such applications. Therefore, researchers have begun to show growing interest in deploying UASs for various civil applications including, but not limited to, meteorology, precision agriculture, wildlife research, forestry, land management, infrastructure inspection, traffic monitoring, epidemic emergencies, natural disaster management, and wilderness search and rescue.
Currently, there are many commercial developers who focus on the hardware development of unmanned aerial systems. However, less attention has been paid to the development and evaluation of data processing techniques. Therefore, critical reviews of previous studies are required to assess the current technological and scientific status of unmanned RS applications.
The unprecedented capabilities of small UAVs as aerial, low-altitude imaging platforms have not gone unnoticed by researchers. Digital image processing and interpretation as well as photogrammetric techniques can be applied to remotely acquired images, which lead to various sorts of geospatial information (Khorram et al. 2012). Examples of aerial imagery acquired for different purposes are presented in Figure 2.2.1.
Figure 2.2.1. Examples of low-altitude, unmanned aerial imagery. From left to right: visible imagery for gravel-pit mapping, visible imagery for wildlife research, near-infrared imagery for precision agriculture, thermal-infrared imagery for wildlife research (Source: Université de Sherbrooke and Centre
In this regard, this article presents a comprehensive review of applications of unmanned aerial imagery for the management of natural resources. In particular, we focus on image-based processes; we also describe the present state of applications of unmanned aerial imagery, including the challenges and future opportunities. The articles analyzed in this review were selected based on the following criteria:
• The platform of the main data acquisition system comprised an unmanned aerial vehicle or a collaborative configuration of several UAVs.
• The end application was directly related to the management of agriculture and/or the natural environment.
• The payload consisted of a passive imaging sensor, and post-processing was applied to meet the requirements of the end-users.
• The study was not focused, merely, on gathering images, digital surface/terrain modeling and/or manned visual interpretation. Additionally, it proposed and evaluated a chain of automatic image-based processes to meet the application-related objectives.
• The study is considered as a scientific publication, such as an accessible1
• The study was performed in the 21st century, thus reflecting recent developments.
journal paper, a conference proceedings article or an official thesis.
Figure 2.2.2 depicts the number of studies versus the publication date2. It indicates that there has been a
considerable, growing interest in applying unmanned aerial imagery for managing agriculture and the natural environment in the last few years.
Figure 2.2.2. Number of reviewed articles versus publication date.
The applications of the reviewed articles can be categorized into five principal fields: precision agriculture and rangeland monitoring, natural disaster management, aquatic ecosystems management, polar remote sensing and wildlife research. Figure 2.2.3 compares the fields of the reviewed applications. Note that the statistics mentioned in this paper are calculated based on the reviewed articles. The reviewed applications are discussed in detail in the following sections (sections 2.3-2.7).
1 Either open access or accessible through the libraries and archives of the Université de Sherbrooke 2 The publications for 2013 are limited to those published by April.
Section 2.8 describes the overall characteristics of the reviewed systems; and, the conclusion is presented in section 2.9.
Figure 2.2.3. The applications of unmanned aerial imagery in the reviewed studies.
2.3 Precision agriculture and rangeland monitoring
Precision agriculture (PA) and rangeland monitoring have been the most common applications of unmanned aerial imagery (Zhang and Kovacs 2012). The following sections describe these applications and the image-based processes applied in the respective studies.
2.3.1 Land cover mapping and classification
Several studies have involved mapping and classifying land cover, based on various factors obtained from spectral data. Normalized difference vegetation index (NDVI) maps have frequently been used to generate field-scale green cover maps, to classify vegetated areas, and to segment the soil surface (McGwire et al. 2013; Primicerio et al. 2012; Arnold et al. 2010; Suzuki et al. 2010; Gay et al. 2009; Sugiura, Noguchi, and Ishii 2005). To be applicable in management practices, an NDVI map should be produced from geo-referenced and radiometrically adjusted images. Anisotropic reflection properties of the field can also be determined prior to flight and be applied for radiometric image correction (Grenzdorffer and Niemeyer 2011).
Various classification techniques have been applied in different studies to classify land cover. To classify agricultural surfaces where plants are spectrally similar, careful selection of classifiers is required. Feature descriptors based on texture and color were used by Reid, Ramos and Sukkarieh (2011) and Bryson et al. (2010) for classifying different types of vegetation on a farm. Object-oriented techniques of classification provide useful tools to deal with images with high spatial resolution for performing species-level classification (Laliberte and Rango 2011; Laliberte et al. 2011). Optimizing the segmentation scale and determining suitable features, based on texture, structure, shape, color, and other spectral properties, are the most significant challenges of these techniques (Laliberte and Rango 2009). In addition to the achievable accuracy for species-level vegetation classification (more than 85%), the transferability of classification rule sets is another advantage of object-oriented techniques (Laliberte et al. 2011). In other words, once a rule set is adjusted to certain types of species, it can be applied to similar sites with small changes in the training data and particular thresholds.
Other methods of land cover segmentation and unsupervised clustering have also been developed. In particular, these techniques were used for clustering tree species (Gini et al. 2012), mapping vigor differences (Johnson et al. 2003), segmenting catchment vegetation cover (Wundram and Loffler 2008) and measuring bare ground in rangelands (Breckenridge and Dakins 2011). Gini et al. (2012) concluded that the unsupervised clustering technique is efficient for differentiating segments with substantial spectral differences, such as roads and vegetation cover. However, it is not applicable to distinguish various tree species in the study area, and human interpretation is required to re-classify the results. Therefore, supervised classification is recommended instead. Wundram and Loffler (2008) observed a high level of miss-classification, even via supervised classification. The main reason was the similarity of the spectral signatures of the species in the visible range. In this case, integrating textural and topographic information can improve the results.
2.3.2 Crop health monitoring
Crop health monitoring is one of the most popular topics in precision agriculture via unmanned aerial imagery. This application can include disease detection, dead leaf detection, weed cover mapping, herbicide application monitoring, and water stress detection.
Various crop health descriptors should be combined with classification techniques to extract the diseased areas of a field. When the aerial system is only equipped with a sensor capturing visible light, textural features (such as angular moment, entropy, and contrast), fractal signatures, and color can be used to extract crop health factors (Samseemoung et al. 2012; Yue et al. 2012; Doudkin et al. 2009; Aber, Eberts, and Aber 2005). Otherwise, spectral information at other wavelengths can be applied as well. Xiang and Tian (2011a) presented a method to monitor a turf grass field where herbicide was applied, by temporally analyzing the changes in NDVI maps. They reported a slight difference (less than 2%) between herbicide damage areas estimated from imagery versus ground survey measurements. The analyses performed by Garcia-Ruiz et al. (2013) indicated that reflectance at 710 nm and NIR-R1 index
values were very different for healthy and HLB2
2.3.3 Modeling biophysical attributes
-infected trees. They showed that the support vector machine (SVM) classification with non-linear kernel fitting had the highest accuracy for detecting diseased areas.
A considerable number of publications have been dedicated to modeling biophysical attributes of crops using unmanned aerial images as an alternative to destructive in situ measurements. The high spatial resolution of the images allows such parameters to be studied at various scales, for example at the farm scale, tree scale, and even finer scales such as the leaf scale.
The common way to model biophysical attributes of crops is to analyze the correlation between different vegetation indices and ground-based samples. Various techniques can be applied for this purpose, such as partial least squares estimation (Jensen et al. 2007), discriminant function analysis (Garcia-Ruiz et al. 2013), linear regression (Felderhof and Gillieson 2011), and support vector regression (Honkavaara et
3 Near infrared and red 2 Huanglongbing
al. 2012). It is worth noting that vegetation indices have temporal dependencies as well. Therefore, the season and the time of day when an index is derived and used for predicting a crop attribute should carefully be considered by analyzing temporal correlations (Xiang 2008). Table 2.3.1 provides a list of the attributes that were modeled in the reviewed articles.
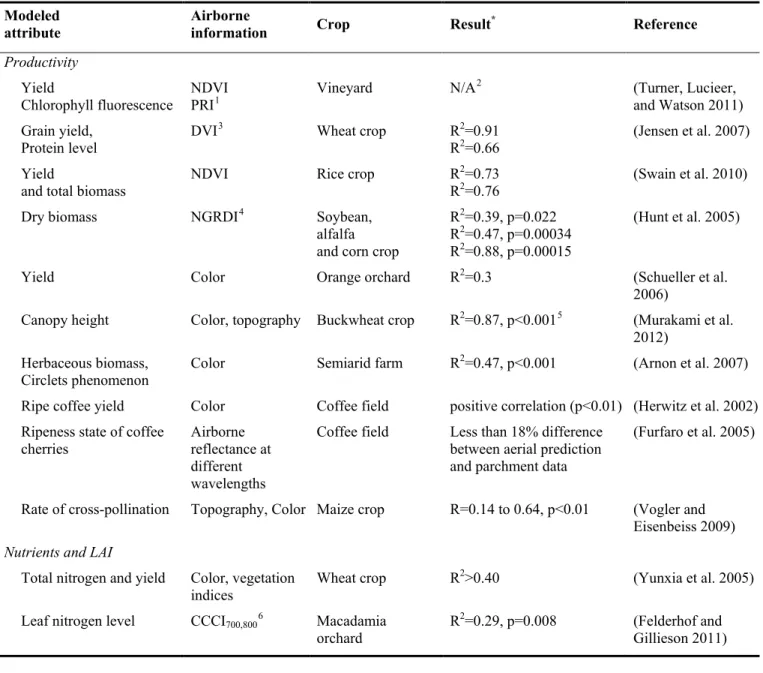
Table 2.3.1. Summary of the studies on crop attribute modeling via unmanned aerial imagery.
Modeled
attribute Airborne information Crop Result* Reference
Productivity Yield
Chlorophyll fluorescence NDVI PRI1 Vineyard N/A
2 (Turner, Lucieer, and Watson 2011) Grain yield,
Protein level DVI
3 Wheat crop R2=0.91
R2=0.66 (Jensen et al. 2007) Yield
and total biomass NDVI Rice crop R 2=0.73
R2=0.76 (Swain et al. 2010) Dry biomass NGRDI4 Soybean,
alfalfa and corn crop
R2=0.39, p=0.022 R2=0.47, p=0.00034 R2=0.88, p=0.00015
(Hunt et al. 2005)
Yield Color Orange orchard R2=0.3 (Schueller et al. 2006)
Canopy height Color, topography Buckwheat crop R2=0.87, p<0.0015 (Murakami et al. 2012)
Herbaceous biomass,
Circlets phenomenon Color Semiarid farm R
2=0.47, p<0.001 (Arnon et al. 2007) Ripe coffee yield Color Coffee field positive correlation (p<0.01) (Herwitz et al. 2002) Ripeness state of coffee
cherries Airborne reflectance at different wavelengths
Coffee field Less than 18% difference between aerial prediction and parchment data
(Furfaro et al. 2005)
Rate of cross-pollination Topography, Color Maize crop R=0.14 to 0.64, p<0.01 (Vogler and Eisenbeiss 2009) Nutrients and LAI
Total nitrogen and yield Color, vegetation
indices Wheat crop R
2>0.40 (Yunxia et al. 2005) Leaf nitrogen level CCCI700,8006 Macadamia
orchard R
2=0.29, p=0.008 (Felderhof and Gillieson 2011)
1 Photochemical reflectance index 2 Not available
3 Difference vegetation index
4 Normalized green–red difference index
5 Correlation of the measured and the estimated canopy height at sample points 6 Canopy chlorophyll content index
Modeled
attribute Airborne information Crop Result* Reference
Leaf nitrogen content DGCI1 Rice crop R2>0.80 (Zhu et al. 2009) Total nitrogen uptake per
square meter,
Leaf area index (LAI)
GNDVI2 , NDVI
Wheat crop R2=0.92 R2=0.82
(Lelong et al. 2008)
LAI GNDVI Wheat crop R2=0.85 (for LAI between 0
to 2.7) (Hunt et al. 2010) LAI Canopy cover Onion crop R2=0.75 to 0.84 (Corcoles et al.
2013) Pigments
FIPAR3 NDVI Orchard R2>0.97 (Guillen-Climent et al. 2012)
Chlorophyll content NDVI Soybean crop R2>0.76 (Samseemoung et al. 2012)
Chlorophyll density Red-Edge, NIR chlorophyll indices (CIs)
Rice crop Strong correlation of field readings and estimated CIs (up to R2=0.8)
(Uto et al. 2013)
Leaf carotenoid,
Leaf chlorophyll content R515/R570, TCARI/OSAVI Vineyard R
2=0.75 to 0.84, p<0.01
R2=0.51, p<0.001 (Zarco-Tejada et al. 2013) Water
Stress status Fluorescence
emission Orchard R
2>0.54 (Zarco-Tejada et al. 2009)
Moisture content NDVI Wheat crop R2=0.37 to 0.78 (Han-Ya et al. 2010) Canopy stomatal
conductance, Leaf water potential, Water stress index,
Temperature Orchard R2=0.78, p<0.05 R2=0.34, p<0.001 (Zarco-Tejada et al. 2012; Berni et al. 2009) Leaf stomatal conductance, Stem water potential (short-term response) Temperature Vineyard R2=0.68, p<0.01 R2=0.50, p<0.05 (Baluja et al. 2012) Leaf stomatal conductance, Stem water potential (long-term response) TCARI /OSAVI4 NDVI Vineyard R2=0.84, p<0.05 R2=0.68, p<0.05 (Baluja et al. 2012)
Water stress indicators (fruit quality parameters, titratable acidity and total
PRI570,515 Citrus
orchard R
2=0.58 to 0.69 (Stagakis et al. 2012)
1 Dark green color index
2 Green normalized difference vegetation index
3 Fraction of intercepted photosynthetically active radiation
Modeled
attribute Airborne information Crop Result* Reference
soluble solids)
*Unless otherwise stated, results are presented as the correlation coefficients (R2) and their corresponding p-values between the crop attributes and the airborne information.
2.3.4 Studying soil characteristics
In addition to the vegetation, soil characteristics have also been studied from unmanned aerial images. Corbane et al. (2012) developed a two-scale classification technique to determine the soil surface characteristics (SSC) classes for a Mediterranean vineyard. The technique was based on multiple structural attributes of soil such as micro-topography, surface crusting, and soil cover. An average accuracy of 73% was achieved via mono-temporal classification, which was significantly improved to 82% via multi-temporal classification.
The soil erosion lines in agricultural areas were studied by D'Oleire-Oltmanns et al. (2012) via processing the digital terrain models (DTM) of a gully system. The DTMs were generated from unmanned aerial imagery and resulted in the horizontal and vertical accuracies of 0.9-2.7 and 1 cm, respectively. Although the DTMs were successfully applied to quantify the gully volume changes, an unavoidable minimum altitude of 250 meters restricted the spatial resolution of the imagery. In this case, this altitude was necessary to maximize the area coverage and minimize the error of camera orientation. The DTMs were processed to be applicable for hydrological modeling applications as well.
A similar study for gully measurement in badlands was performed by Gimenez et al. (2009). Although the error of photogrammetric measurements was as low as 3-12% for wide gullies, the accuracy was highly correlated with the width/depth ratio and morphology of the gullies (R2=0.98). Depending on the
time of day, the effect of sun-shadowing was the main reason for decreased accuracy when measuring deep, narrow gullies.
2.3.5 Challenges and future perspectives
Land cover classification and mapping applications are mainly concerned with typical sources of imaging errors, such as differential atmospheric attenuation of light rays between the ground and cameras, transmission differences caused by the wavelength response of the camera sensors, radiometric changes between overlapping images, shadows, camera vibrations, and forward motion artifacts. These errors must be considered by careful techniques of spectral calibration, atmospheric models, radiometric block adjustment, and motion compensation (Samseemoung et al. 2012; Primicerio et al. 2012; Grenzdorffer and Niemeyer 2011; Doudkin et al. 2009; Gay et al. 2009; Johnson et al. 2003).
Furthermore, the geometric distortions caused by inaccurate image registration and geo-referencing can be a considerable source of error. Due to such distortions, training samples cannot be precisely located on images. As a result, the extracted spectral information does not exactly correspond to the samples, and the estimates of biophysical parameters become erroneous (Honkavaara et al. 2012). In any case, it is believed that modeling crop attributes from unmanned aerial images yields more accurate results in