Publisher’s version / Version de l'éditeur:
Oxford University Press, 2003
READ THESE TERMS AND CONDITIONS CAREFULLY BEFORE USING THIS WEBSITE.
https://nrc-publications.canada.ca/eng/copyright
Vous avez des questions? Nous pouvons vous aider. Pour communiquer directement avec un auteur, consultez la première page de la revue dans laquelle son article a été publié afin de trouver ses coordonnées. Si vous n’arrivez pas à les repérer, communiquez avec nous à [email protected].
Questions? Contact the NRC Publications Archive team at
[email protected]. If you wish to email the authors directly, please see the first page of the publication for their contact information.
Archives des publications du CNRC
This publication could be one of several versions: author’s original, accepted manuscript or the publisher’s version. / La version de cette publication peut être l’une des suivantes : la version prépublication de l’auteur, la version acceptée du manuscrit ou la version de l’éditeur.
Access and use of this website and the material on it are subject to the Terms and Conditions set forth at
Evaluation and Optimization of Clustering in Gene Expression Data
Analysis
Famili, Fazel; Liu, G.; Liu, Ziying
https://publications-cnrc.canada.ca/fra/droits
L’accès à ce site Web et l’utilisation de son contenu sont assujettis aux conditions présentées dans le site LISEZ CES CONDITIONS ATTENTIVEMENT AVANT D’UTILISER CE SITE WEB.
NRC Publications Record / Notice d'Archives des publications de CNRC:
https://nrc-publications.canada.ca/eng/view/object/?id=7b1a57ef-d70d-46db-8bf6-578f42951f41 https://publications-cnrc.canada.ca/fra/voir/objet/?id=7b1a57ef-d70d-46db-8bf6-578f42951f41
Institute for
Information Technology
Institut de technologie de l'information
Evaluation and Optimization of Clustering in Gene
Expression Data Analysis *
Famili, A., Liu, G., Liu, Z.
2003
* published in Journal of Bioinformatics, Oxford University Press. (In Press). NRC 46534.
Copyright 2003 by
National Research Council of Canada
Permission is granted to quote short excerpts and to reproduce figures and tables from this report, provided that the source of such material is fully acknowledged.
Evaluation and optimization of clustering in gene expression data analysis
A. Fazel Famili, Ganming Liu
and Ziying Liu
Institute for Information Technology
National Research Council of Canada, Ottawa, ON. K1A 0R6 Canada
ABSTRACT:
Motivation
:
A measurement of cluster quality is needed to choose potential clusters of genes that contain biologically relevant patterns of gene expressions. This is strongly desirable when large number of gene expression profiles have to be analyzed and proper clusters of genes need to be identified for further analysis, such as the search for meaningful patterns, identification of gene functions or gene response analysis.Results
:
We propose a new cluster quality method, called stability, by which unsupervised learning of gene expression data can be efficiently performed. The method takes into account a cluster’s stability on partition. We evaluate this method and demonstrate its performance using four independent, real gene expression and three simulated data sets. We demonstrate that our method outperforms other techniques listed in the literature. The method has applications in evaluating clustering validity as well as identifying stable clusters.Availability:
Please contact the first author.Contact
: [email protected]Keywords
: Clustering, Cluster Quality, GeneExpression, and Microarray data analysis
INTRODUCTION
A general question facing researchers in many areas, where large amounts of data are produced, is how to organize observed data into meaningful structures and search for useful patterns. Unsupervised learning techniques, such as clustering, have been the most popular method applied to this problem. Over the last 5 years, with the advances in genomics and microarray technologies and large amounts of microarray data produced, clustering has been applied to identify groups of genes with meaningful properties. For example, Eisen et al. (1998) applied a hierarchical clustering algorithm to identify groups of co-regulated yeast genes. Tamayo et al. (1999) used self-organizing maps to identify clusters of genes with similar expression patterns in the yeast cell cycle and human hematopoietic differentiation data sets. In addition, Yeung et al. (2001) have considered clustering as a useful technique because of large number of genes and the complexity of biological networks.
Given a large number of clusters, biologists are faced with the problem of choosing the smallest number of clusters, which potentially contain biologically relevant patterns of gene expressions. Quantitative methods are preferred when assessing whether a cluster of genes is potentially related to a problem or amongst all clusters, which ones would result in meaningful patterns if more investigation were done. Our paper provides a quantitative, data-driven approach to select the most promising clusters
of genes that contain biologically relevant
information (i.e. meaningful patterns of expression). There are many publications related to the optimal number of clusters, the optimal clustering algorithm or the optimal similarity/dissimilarity measure for a given gene expression data set. However, only a few papers address the problem of identifying high quality clusters that potentially contain biologically relevant patterns. In this paper we investigate and compare techniques that could be used to assess the cluster quality. We further introduce a new stability-based technique stability-based on clusters’ immovability on partition. Immovability of a cluster is the rate at which the contents of a cluster remain unchanged, during a clustering process, for K= i to i+n, where n 1, and K is the number of clusters. The advantage of our method over existing methods is that it takes into account all factors that affect the clustering process and at the same time uses the complete data set to determine the cluster quality (the original information is kept intact). Other methods use only some of the factors that determine quality, such as the silhouette index (Rousseeuw 1987), or use only part of the complete data set, in the re-sampling validation method (Dudoit and Fridlyand 2002, Ben-Hur et al. 2002).
In the following sections, we first describe related work and compare it to techniques used in our studies. We then introduce our stability-based technique, and present the results of applying this method to four gene expression data sets from biological applications and 3 simulated data sets. To show the effectiveness of our technique, we also apply some well-known and efficient cluster validation methods to all of our data sets, and
compare it with our method. The final section of the
paper contains the conclusions of our studies and
RELATED WORK
Choosing the highest quality clusters of genes from the results of clustering gene expression data is not a well-studied topic. Only a few researchers have addressed this problem. Vilo et al. (2000) created a large number of independent clusters of gene expression data and simultaneously assessed the “goodness” of each cluster by its average object silhouette value (Rousseeuw 1987). Raychaudhuri et
al. (2003) evaluated a method called, neighbor
divergence per gene (NDPG), which uses scientific literature to assess whether a group of genes are functionally related. This method needs a corpus of documents and an index connecting the documents to genes. Zhang et al. (2000) proposed a parametric bootstrap re-sampling method (PBR) to incorporate information on variations in gene expression levels to assess the reliability of gene clusters identified from large-scale gene expression data. For each re-sampling, a set of “new” observations are generated by replacing the true observation for each gene under each condition with a random variable sampled using the observed expression level and estimated uncertainty in gene expression measurements. More recently Smolkin et al. (2003) assessed the stability of a cluster using their Cluster Stability Score, by which a cluster’s stability is calculated through clustering on random subspace of the attribute space. There are also a number of papers that refer to the cluster validation problem for gene expression data (the optimal number of clusters). The most common cluster validation techniques are based on one of the following three principles: external criteria, internal criteria and replication (Fiske 1983). In most cases, external information is not known, so internal criterion and replication techniques are more often used for cluster validation. Azuaje (2002) evaluated the validation of three internal indices, silhouette index, Dunn’s index and Davies-Bouldin (DB) index, for estimating the optimal number of clusters with two gene expression data sets: leukemia samples and B-cell lymphoma samples. Dudoit and Fridlyand (2002) proposed a re-sampling method called Clest to estimate the number of clusters (K) by repeatedly and randomly dividing the original dataset into two non-overlapping sets. Ben-Hur et al. (2002) proposed a stability-based re-sampling method for estimating the number of clusters, where stability is characterized by the distribution of pair-wise similarities between clusters obtained from sub-samples of the data. Yeung et al. (2001) applied a clustering algorithm to all but one experimental condition in a data set. They used the left-out condition to assess the predictive power (Figure-of-Merit -FOM) of the clustering algorithm. The basic idea is to calculate the mean expression level of all the objects (genes) at the left
out condition in one cluster, and then calculate the difference between each gene's expression level and the mean expression level. The FOM of this cluster is then the average sum of this difference. More recently, Datta et al. (2003) formulated 3 other validation measures using the left-out-one condition strategy to evaluate the performances of 6 clustering algorithms. Lukashin et al. (2001) proposed a clustering algorithm based on simulated annealing procedure and determined the optimal number of clusters simultaneously with the optimization of the distribution of the genes over clusters. In addition, Giurc neanu et al (2003) introduced a stability index to estimate the quality of clusters for randomly selected subsets of the data. A decision based on the correct number of clusters was made from the statistics of the index. Lange et al (2002), introduced a model assessment scheme that is based on the notion of stability. The approach results in an upper bound to cross-validation in the supervised learning with extensions to semi-supervised and unsupervised applications.
METHODS
Among the methods discussed for a cluster’s quality in the literature, NDPG needs external information (scientific literature) and PBR requires generating “new” observations through resampling and is time consuming. Cluster Stability Score repeatedly subsamples the attribute space to do clustering. If two subsets of attributes, which are randomly sampled from the attribute space, happen to contain independent information, stability of a cluster formed from one subset of attributes is not expected when it is formed from the other subset of attributes. The silhouette index cannot always determine the optimal number of clusters when using genes as objects. Also, the silhouette value cannot identify proper clusters containing informative genes for a disease when using patients as objects (this will be illustrated as part of our evaluation strategy in the result section).
Among the techniques for clustering validity, the stability-based re-sampling method and FOM could also be used to assess a cluster’s quality. The
stability-based re-sampling approach generally
involves repeated, resampling of the dataset, each time using only a subset of the whole data, We expected the potential for some resampled subsets to have a different underlying data structure comparing to the original data set. In addition, this technique has high run-time complexity due to multiple re-samplings. FOM has a limitation that it is not applicable if the experiment conditions from which data is generated contain independent information.
A new method for proper assessment of cluster quality is therefore preferred so that: (i) the data set is kept intact during clustering, (ii) one is able to determine the optimal number of clusters and in particular, clusters with meaningful patterns of gene expressions, and (iii) it can work for various gene expression data including time series, labeled and non-labeled data sets. In this paper, we introduce a novel stability-based technique that assesses the immovability of objects in each cluster when it is partitioned. This method satisfies the above three conditions. We call it cluster’s stability on partition, in which no resampling is required and is different from the stability indices described in the last section. Suppose we have a set of clustering results with the number of clusters from 2 to n, which are obtained
from the same clustering algorithm. Let
C
c,l be a setof objects in cluster
l
resulting from a clusteringresult with c (2 c n) clusters. Let k (0<k n-c) be the threshold (we call it the partition threshold) at which the stability calculation of a cluster will stop. Then,
the cluster stability of cluster
l
is:The
S
c,l calculates the k maximum number ofoverlapping objects between the considered cluster
l
and each of the clusters in a clustering result withthe number of clusters i (c<i c+k). Then it takes the minimum of the k maximum values as the stability of
the considered cluster
l
. To make the stabilities ofdifferent clusters comparable, the stability value is normalized to the range from 0 to 1 by dividing it
with the number of objects in
l
. The closer thestability to 1, the more stable the cluster is.
Let
S
c,l be the stability of clusterl
resulting from aclustering result with c clusters, then the general
stability of the entire clustering with c clusters is:
=
=
c l l c cS
c
GS
1 ,1
This is the average of the stabilities of all clusters in the clustering result. The optimal number of clusters is a value q at which the general stability is the largest. The larger the cluster stability, the better the cluster quality. The clusters of genes with the best stabilities can be taken as candidates containing reliable patterns, which are valuable to be further
analyzed for biological patternrecognition.
To illustrate the value of our stability-based method, we evaluated it with four gene expression data sets,
and compared it to the result of silhouette index that is defined as follows (Rousseeuw 1987).
The silhouette of a cluster A is measured on its compactness and how far it is from the next closest cluster. Let i be an arbitrary object in A. We define
)
(i
a
as the average distance between the ith objectand all the other objects in the same cluster as i.
1
|
|
)
,
(
)
(
,−
=
∈ ≠A
j
i
d
i
a
j A j iFor any cluster C other than A, we define
=
C jj
i
d
C
C
i
d
ε)
,
(
|
|
1
)
,
(
and)}
,
(
{
min
)
(
i
d
i
C
b
A C≠=
Then object silhouette of object i is:
in which the range of S(i) is between –1 and 1. The cluster silhouette is the average of the object silhouette for all objects in cluster A:
|
|
)
(
_
1A
i
s
silhouette
cluster
A i==
The general silhouette of a clustering result with c clusters is: =
=
c i isilhouette
cluster
c
silhouette
general
1_
1
_
The optimal number of clusters is a value q at which the general silhouette is the largest. The larger the cluster silhouette, the better the cluster quality.
DATA USED FOR THIS STUDY
The real data used for this study consisted of four gene expression data sets, each containing gene expression measurements for various numbers of genes that were collected for different problem under study. Two of these data sets are publicly available. We provide references for all these data sets for which more information can be obtained.
Yeast: consists of 2321 genes as objects with 16 time
points as attributes. This data is a subset from the original 6220 genes with 17 time points listed by Cho (1998) from which we selected 2321 genes based on the largest variance in their expression. One
)} ( ), ( { max ) ( ) ( ) ( i b i a i a i b i s = −
=
= + + =|
|
|
|
max
min
, , , 1 1 , l c j i l c i j k c c i l cC
C
C
S
abnormal time point was also removed from the data set (suggested by Tomayo 1999). This data has been extensively used in the literature for clustering and unsupervised pattern recognition. A large number of genes contained in this data set have been biologically characterized and assigned to different cell cycle phases.
Leukemia: approximately 7000 genes as objects,
consisting of data for 38 ALL and AML patients as attributes (Golub et al, 1999; Famili and Ouyang, 2003). The objective of the original research was to identify the most informative genes for the purpose of disease modeling and more accurate classification of ALL/AML patients. The most informative genes exhibit expression patterns strongly correlated with the class distinction (Golub et al. 1999).
Hepatitis C Virus: containing 5756 genes for 6
repeated experiments (Famili et al. 2003) related to Hepatitis C transgenic mice. This data was originally used for gene identification. The expression level of the most informative genes should exhibit large deviation between experiment and control.
TGF Modulated: consisting of 331 genes (selected
from an original list of 15264 genes) of cells under experimental conditions stimulus: transforming growth factor (TGF-β1), p38MAPK inhibitor: SB203580 (SB) or both. Each experimental condition was repeated 6 times. The gene expression level is the ratio of the experimental sample divided by the control sample. This data was generated to isolate and characterize a murine mammary epithelial tumor cell line, designated as BRI-JM01. Exposure of this cell line to transforming growth factor (TGF- 1) resulted in inducing an epithelial-to-mesenchymal-transition (EMT) and increased motility, a phenotype critical to tumor progression in cancer (O’Connor, 2003). The most informative genes exhibited expression patterns that strongly correlated with the experimental conditions (stimulus, inhibitors).
Simulated data: In addition to the above data sets,
we generated three simulated data sets, S1, S2, and S3, that contained bivariate normal distribution and were used for this study. Following is a description of these data sets.
S1: consisting of 2 overlapped clusters. One
contained 300 objects with means [1,1] and standard deviations [1,1]. The other contained 100 objects with means [4,4] and standard deviations [1,1]. An additional 15% of noise was added to the data set.
S2: consisting of 3 clusters, two of them overlapped.
Each has 150 objects. The middle cluster in the plot has means [1,1] and standard deviations [1,1]. The other two have means [4,5], [-5.5,-5.5] and standard deviations [1.3,1.3], [1.3,1.3], respectively. The deviation is so designed that the objects in the middle cluster in the plot are co-expressed better than those
-4 -2 0 2 4 6 8 -3 -2 -1 0 1 2 3 4 5 6 7 -10 -8 -6 -4 -2 0 2 4 6 8 10 -9 -7 -5 -3 -1 1 3 5 7 -6 -4 -2 0 2 4 6 8 10 12 14 -3 2 7 12
Figure 1(a, b and c): Simulated data sets of the other two. This data set can be used to verify that larger stability of a cluster indicating its objects are co-expressed well. This data set also contained 10% noise.
S3: consisting of 4 overlapped clusters with objects 400, 300, 200 and 100; means (0,0), (3,3), (6,6), and (9,9); standard deviation (1,1), (1,1), (1,1), and (1,1), respectively. An additional 12% noise objects were added to the data set.
Figure 1(a, b and c) shows the three graphs from our simulated data sets.
RESULTS
To evaluate the performance of our new stability measure, a number of clustering experiments were performed. These all used K-Means with a random seed selection and Euclidean, as distance measure. All experiments were performed using our BioMiner data mining software (Walker R. et al, 2003). Table 1 contains the summary of these experiments. The distance measures listed in this table were selected from amongst 21 different distance measures available in this software. They were selected because they resulted in the highest general silhouette values.
(a)
(b)
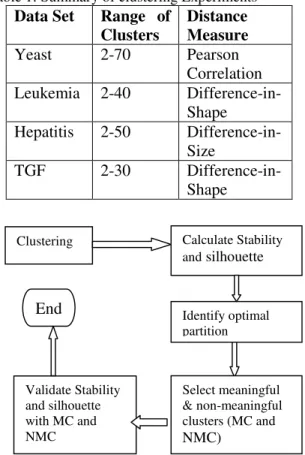
Figure 2 shows the experiment and evaluation procedure. After K-Means clustering, stability and silhouette values were calculated. The optimal partition was determined by the general stability and silhouette values. The meaningful and non-meaningful clusters were selected based on domain
knowledge and were used to validate the
effectiveness of stability over silhouette measures.
Optimal partition - Stability vs. Silhouette
Figures 3 to 6 show the general stability and silhouette values versus the number of clusters for all four data sets. These graphs show interesting results that are described below:
(i) In Yeast data (figure 3), comparing silhouette versus stability, we noticed that the silhouette values do not indicate any significant changes as the number of clusters increase. Considering the stability values, we checked the partitions with the number of clusters less than 10. In each partition, no clusters could be found exhibiting periodic behaviors that correspond to the 5 known cell cycle phases: Early G1, Late G1, S, G2 and M. Therefore, we preclude them from the
partition with the optimal number of clusters. We
noticed that clusters 18 and 21 had the highest general stability (0.68) among those of clustering results with the number of clusters greater than 10. Therefore, we choose 21 (the average number of genes in each cluster is less than that of 18’s) as the optimal number of clusters. Figure 7 shows mean expression levels at 16 time points of the 21 clusters corresponding to the clustering results. The gene expression patterns of the 21 clusters are distinctive. This is evidence to support that 21 is the optimal number of clusters identified by general stability. (ii) In Leukemia data (figure 4), the general stability was between 0.4 and 0.6 throughout the clustering experiments comparing to silhouette values that dropped substantially after 11 clusters. Using stability index, clusters 13, 14 and 15 had the highest general stabilities (0.54) among those of the clustering results with the number of clusters from 3 to 30.
(iii) For Hepatitis data (figure 5), although the silhouette values were fairly high, they did not change significantly while the general stability showed an upward trend from the beginning with the values very close to silhouette, after 12 clusters. Considering the stability values, the clustering result with 25 clusters had the highest general stability (0.65), so we choose 25 as the optimal number of clusters.
(iv) In the case of TGF data (figure 6), the silhouette values dropped after 3 clusters and remained very low. However, stability was much higher, almost from the beginning of the experiments. Similar to other data sets, the clustering process with number of
Table 1: Summary of clustering Experiments
Data Set
Range of
Clusters
Distance
Measure
Yeast
2-70
Pearson
Correlation
Leukemia
2-40
Difference-in-Shape
Hepatitis
2-50
Difference-in-Size
TGF
2-30
Difference-in-Shape
Figure 2: Experimental procedure
clusters 13 resulted in the highest general stability (0.48), so we choose 13 as the optimal number of clusters.
According to the stability and silhouette formula, the data set reaches its optimal partition at the point that general stability and general silhouette reach peak values. For all four real data sets tested, silhouette values reached peaks at very small number of clusters, and decreased (in 3 out of 4 experiments) with the number of clusters increasing. This is obviously not reasonable when clustering data sets containing large numbers of genes. Therefore, stability is a more reliable measure for the optimal
partitions.
0 0.2 0.4 0.6 0.8 1 0 10 20 30 40 50 60 number of clusters g e n e ra l q u a lit y GSil GSb
Figure 3: General stability and silhouette versus the number of clusters for Yeast data.
Clustering Calculate Stability
and silhouette Identify optimal partition Select meaningful & non-meaningful clusters (MC and NMC) Validate Stability and silhouette with MC and NMC
End
0 0.2 0.4 0.6 0.8 1 2 6 10 14 18 22 26 30 number of clusters g e n e ra l q u a lit y GSil GSb
Figure 4: General stability and silhouette versus the number of clusters for Leukemia data.
0 0.2 0.4 0.6 0.8 2 6 10 14 18 22 26 30 34 38 number of clusters g e n e ra l q u a lit y GSil GSb
Figure 5: General stability and silhouette versus the number of clusters for Hepatitis data.
0 0.1 0.2 0.3 0.4 0.5 0.6 2 4 6 8 10 12 14 16 18 20 number of clusters g e n e ra l q u a lit y GSil GSb
Figure 6: General stability and silhouette versus the number of clusters for TGF data.
Meaningful Clusters
The clusters in the best partitions for all four data sets were further evaluated.
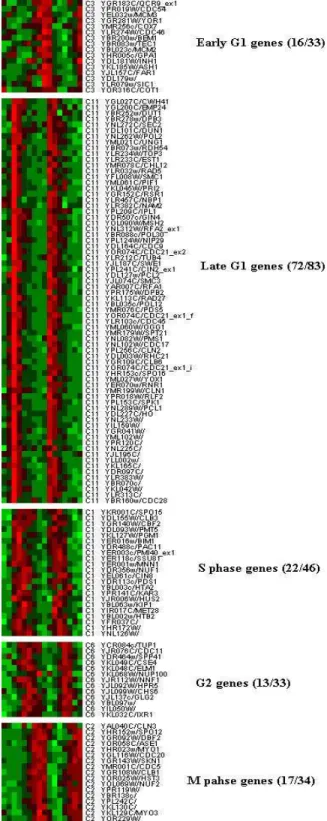
(i) Yeast data: Figure 7 shows mean expression
levels at 16 time points of the 21 clusters corresponding to the clustering results. From this figure, 5 clusters clearly exhibit periodic behaviors (table 2) that correspond to cell cycle phases: namely C3 corresponds to Early G1 phase, C11 corresponds to Late G1 phase, C1 corresponds to S phase, C6 corresponds to G2 phase, and C2 corresponds to M phase. These are consistent with patterns identified by Cho et al. (1998). Figure 13 shows cluster stabilities and silhouettes of the 21 clusters corresponding to the clustering results with the number of clusters at 21. The stabilities of cluster C1,
Figure 7: Mean expression levels at 16 time points for the 21 clusters corresponding to the best clustering results as determined by stability on Yeast data.
Table 2 Proportion of biologically characterized genes in meaningful clusters vs. those in Cho. 1998.
Cell Cycle Proportion Meaningful cluster
Early G1 16/32 C3
Late G1 72/87 C11
S-phase 23/48 C1
G2-phase 14/28 C6
M-phase 17/30 C2
C6 and C11 are 0.45, 0.43 and 0.59, respectively. They are among the set of clusters with the highest stabilities. The silhouettes of C1, C2 and C11 are 0.2, 0.21 and 0.4, which are among the set of clusters with the highest silhouettes. The silhouettes of cluster C3 and C6 are 0.17 and 0.13, which is not high. The stabilities of C2 and C3 are 0.36 and 0.35, respectively. These are not very high. Here, both stability and silhouette measures correctly identify 3 clusters among the 5 clusters with biologically relevant expression patterns.
Table 2 shows the proportion of biologically
characterized genes listed by Cho et al. (1998), contained in our meaningful clusters. There are 225 genes (from the original list of 415 genes listed by Cho) that passed our variation filter. Among them, 142 genes were found in the 5 meaningful clusters we identified. This verified that the cell cycle regulated patterns exist in our meaningful clusters. Figure 8 displays the intensity spectrum plot of the 142 genes. (ii) Leukemia data: Figure 9 illustrates mean expression levels of the 13 clusters corresponding to the clustering results with the number of clusters at 13. Among them, clusters C3, C5 and C13 exhibit obviously high expression levels (meaningful expression patterns) in AML samples (on the X axis the last 11 points are AML patients, the others are ALL). Figure 14 shows cluster stabilities and silhouettes of the 13 clusters corresponding to the clustering results as discussed above. The stabilities of clusters C3, C5 and C13 are 0.67, 0.56 and 0.80, respectively. They are among the set of clusters with the highest stabilities. The silhouettes of clusters C3, C5 and C13 are -0.14, -0.09 and -0.02, respectively,
which are very poor. Here, compared to silhouette measure, stability identified the clusters with gene expression patterns that are class distinctive (ALL
and AML). Among the 25 most informative genes
highly expressed in AML identified by Golub et al. (1999), 14 are found in the 3 clusters we identified with highly expressed patterns in AML. Figure 10 displays the intensity spectrum plot of the 14 genes. However, among the 25 most informative genes highly expressed in ALL identified by Golub et al (1999), none were included in the 3 clusters.
(iii) Hepatitis data: Figure 11 shows mean expression levels of the 25 clusters created from the hepatitis data. The X-axis represents the 6 repeated experiments. The Y-axis represents the log ratio of experiment divided by control. So the farther the mean log ratio value of a cluster of genes is from zero, the more regulated the cluster of genes is by experimental conditions. Among all the clusters in Figure 10, cluster C1 is the most up-regulated cluster and C15 is the most down-regulated cluster. Figure 15 shows cluster stabilities and silhouettes of the 25 clusters corresponding to the clustering results with the number of clusters set to 25. Clusters C1 and C15 have the highest stability value of 1. The other clusters with high stabilities are C16, C2 and C24, with their stability values being 1.0, 0.98 and 0.84, respectively.
Cluster C17 has the lowest stability of 0.42. By comparing these clusters with figure 15, C16 and C2 are strongly down regulated; C24 is strongly up regulated; and C17 does not exhibit any regulated character, whose average expression level is just a straight line located near zero. Overall, we notice that while the stability measure works very well for this data set, the silhouette values do not indicate any additional information.
(iv) TGF data: Figure 12 shows mean expression
levels of the 13 clusters from the TGF data. Among them, clusters C1, C6 and C13 exhibit obviously different expression levels (meaningful expression patterns), for the three experimental conditions of: TGF-β1, TGF-β1+SB and SB. Figure 16 shows cluster stabilities and silhouettes for the 13 clusters. The stabilities of clusters C1, C6 and C13 are 1.0, 1.0, and 0.67, respectively. They are among the set of clusters with the highest stabilities. The silhouettes of C1, C6 and C13 are 0.0, 0.0 and 0.29, respectively. Clusters C1 and C6 have only 1 gene (silhouette algorithm assigns value of 0.0 to the cluster), therefore we exclude them from meaningful clusters. Cluster C13 has the highest silhouette value. For this
data set, both stability and silhouette measures
correctly identified the clusters of genes with gene expression patterns that are distinctive at the 3
different experimental conditions (β1, TGF-β1+SB and SB).
Figure 8: The intensity spectrum plot of biologically characterized genes (listed by Cho et al 1998) that are found in our meaningful clusters.
Figure 9: Mean expression levels of the 13 clusters corresponding to Leukemia data.
Figure 10: The intensity spectrum plot of the 14 genes. Among the 25 genes highly expressed in AML (Golub et al 1999) that are found in our meaningful clusters.
Figure 11: Mean expression levels of the 25 clusters created from Hepatitis data.
Figure 12: Mean expression levels of the 13 clusters obtained with TGF data.
Table 3 is a summary of the experimental results. It shows that the number of known clusters with biologically relevant patterns that have high stability values, are more than the ones with high silhouette. The known non-regulated cluster in Hepatitis data has the lowest stability, but its silhouette is not low.
As shown in this table, the stability measure outperformed silhouette. The reason is that cluster’s stability is measured when it is partitioned in the clustering process, so it is the result of all factors affecting the clustering.
On the other hand, the silhouette measure considers a cluster as a good cluster if it is compact and separated from other clusters. It would appear that there are other factors that are not taken into account by silhouette, such as the shape of a cluster.
Results from simulated data sets
Table 4 shows the general quality for simulated data. In data set 1, all 4 indices correctly identified the correct number of clusters which were 2. In data set 2, stability index correctly identified the correct number of clusters, which were 3. The other three indices wrongly identified it as 2. And finally in data set 3, stability index correctly identified the number of clusters, which were 4. The other three indices wrongly identified it as 2.
As for cluster quality in simulated data, the middle cluster in the plot (Figure 1b) contained smaller standard deviation. This data set was used to verify that larger stability of a cluster indicated that its objects were co-expressed well. The cluster stability of the middle cluster was 1. The other two had stabilities of 0.95 and 0.71, respectively.
0 0.2 0.4 0.6 0.8 C1 C3 C5 C7 C9 C11 C13 C15 C17 C19 C21 cluster label c lu s te r q u a lit y silhouette stability
Figure 13: Cluster stabilities and silhouettes of the 21 clusters formed on Yeast data.
-0.5 0 0.5 1 C1 C3 C5 C7 C9 C11 C13 cluster label c lu s te r q u a lit y silhouette stability
Figure 14: Cluster stabilities and silhouettes of the 13 clusters from Leukemia data.
0 0.2 0.4 0.6 0.8 1 1.2 C1 C4 C7 C10 C13 C16 C19 C22 C25 cluster label c lu s te r q u a lit y silhouette stability
Figure 15: Cluster stabilities and silhouettes of the 25 clusters created with Hepatitis data.
-0.20 0.2 0.4 0.6 0.81 1.2 C1 C3 C5 C7 C9 C11 C13 cluster label c lu s te r q u a lit y silhouette stability
Figure 16: Cluster stabilities and silhouettes of the 13 clusters from TGF data.
Table 3: Summary of experiment result
Data set Yeast Leukemia Hepatitis TGF
Optimal clusters 21 13 25 13 Meaningful clusters (MC) 5 2 4 1 Non meaningful clusters (NMC)
N/A N/A 1 N/A
MC with high
stability 3 2 4 1
MC with high
silhouette 3 0 0 1
NMC with
low stability N/A N/A 1 N/A
NMC with
low silhouette N/A N/A 0 N/A
CONCLUSIONS
A long-standing problem in the analysis of large amounts of microarray data is how to properly cluster the data, how to decide on the correct number of clusters and more importantly, what are the clusters with the most meaningful information. This is extremely important when one wants to reduce data dimensionality (i.e. dealing with large number of genes) or choose the right clusters for labeling and
Table 4: General quality for simulated data.
Data set c GSb GSil Dunn DB
2 0.67 0.61 2.8 -1.85 3 0.55 0.39 0.56 -0.56 4 0.5 0.39 0.2 0.07 Data S1 6 0.55 0.32 0.08 0.34 7 0.52 0.32 0.08 0.07 8 0.54 0.32 -0.41 0.33 9 0.5 0.31 -0.49 0.41 10 0.54 0.33 -0.48 0.28 2 0.76 0.73 2.94 -2.05 3 0.89 0.66 1.17 -1.4 4 0.64 0.51 -0.13 -0.19 5 0.84 0.46 -0.27 -0.01 Data S2 6 0.8 0.45 -0.06 0.29 7 0.65 0.38 -0.27 0.03 8 0.75 0.32 -0.19 0.38 9 0.7 0.42 -0.39 0.14 10 0.7 0.35 -0.5 0.58 2 0.61 0.59 2.11 -1.37 3 0.74 0.55 0.44 -0.41 4 0.78 0.55 1.12 -0.86 5 0.67 0.42 -0.12 0.07 Data S3 6 0.67 0.37 -0.19 0.61 7 0.74 0.39 -0.31 -0.04 8 0.75 0.39 -0.39 -0.16 9 0.62 0.37 -0.65 0.34 10 0.65 0.34 -0.37 0.35
pattern recognition. Here, we investigated some of
the existing techniques and identified their
deficiencies. We then introduced a new, simple and robust method that allows us to quantitatively evaluate any gene expression clustering processes and identify clusters with meaningful patterns. We evaluated the method and its performance using four large gene expression data sets, all collected from real-world applications and three simulated data sets. To summarize:
1. The new stability on partition measure provided a simple and robust quantitative measure allowing us to identify clusters of genes that contain biologically relevant patterns of gene expressions.
2. It is shown that the stability on partition is a good measure to indicate the optimal number of clusters when genes are treated as objects. In addition to providing useful information about the stability of clusters, the approach solves the problem of cluster validity
3. Comparing to other techniques, our
procedure does not use any external
information and does not require
The new cluster quality evaluation method was tested using the K-Means clustering algorithm. As part of our future studies, we plan to use other clustering techniques (such as SOM, and Hierarchical
clustering) to evaluate our cluster quality index. The
new cluster evaluation method allows researchers to perform a meaningful clustering of data, focusing only on genes with the highest information value. This would be a valuable support for gene identification, gene response analysis, disease modeling using microarray data and many other genomics data mining tasks that require a complex data analysis process.
Acknowledgements
The authors would like to acknowledge the contributions of all members of the BioMine project: Alan Barton, Julio Valdes, and Youlian Pan and Junjun Ouyang from IIT, Roy Walker, and Qing Yan Liu and Brandon Smith from the IBS at NRC and a number of former students. Special thanks to Marko
Kryworuchko, Maureen O’Connor and Anne
Lenferink for providing the Hepatitis and TGF data. We would like to thank Bob Orchard for reviewing an earlier version of this paper.
REFERENCES
Azuaje,F., (2002), A cluster validity framework for genome expression data, Bioinformatics, Vol 18, 2: 319-320.
Ben-Hur,A. Elisseeff A, Guyon I, (2002), A stability based method for discovering structure in clustered data, Pac Symp Biocomputing 7: 6-17.
Cho,R.J. et al, (1998), A Genome-Wide
Transcriptional Analysis of the Mitotic Cell Cycle, Molecular Cell, Vol 2, 65-73.
Datta,S. and Datta, S., (2003), Comparisons and validation of clustering techniques for microarray gene expression data, Bioinformatics, Vol 19, 4: 459-466.
Dudoit,S and Fridlyand,J, (2002), A prediction-based re-sampling method for estimating the number of clusters in a dataset, Genome Biology 2002, 3(7):research 0036.1-0036.21
Eisen,M.B., Spellman,P.T., Brown,P.O. and
Botstein,D. (1998) Cluster analysis and display of genome-wide expression patterns. Proc. Natl Acad. Sci. USA, 95, 14863–14868.
Famili,A. and Ouyang. J. (2003), Data mining:
understanding data and disease modeling,
Proceedings of IASTED-AI-03 Conference,
Innsbruck, Austria, Feb. 10-13.
Famili,A. et al. (2003), Knowledge discovery in Hepatitis C Virus transgenic mice, submitted to the
IEA-AIE 2004 conference, Ottawa, ON.
Fiske,D. (1983), Cluster Analysis for Social Scientists, Jossey-Bass Publishers: 104-109
Giurc neanu C.D., et al, (2003), Stability-based cluster analysis applied to microarray data, Seventh International Symposium on Signal Processing and its Applications, Paris, France, July 1-4.
Golub,T.R., et al. (1999), Molecular classification of cancer: class discovery and class prediction by gene expression monitoring. Science, (286) 531-537. Lange T., et al, (2002), Stability-Based Model Selection in: Advances in Neural Information Processing Systems (NIPS 2002).
Lukashin,A.V. and Fuchs,R. (2001), Analysis of temporal gene expression profiles: clustering by simulated annealing and determining the optimal number of clusters, Bioinformatics, Vol 17: 5: 405-414.
O’Connor-McCourt,M. et al. (2003), Analysis of transforming growth factor (TGF)- modulated genes
involved in the epithelial to mesenchymal
transdifferentiation of murine mammary epithelial cells, Poster presentation at ASCR, Washington DC. Raychaudhuri,S. and Altman R, (2003), A literature-based method for assessing the functional coherence of a gene group, Bioinformatics, Vol 19, 5: 396-401. Rousseeuw,P.J. (1987) Silhouettes: a graphical aid to the interpretation and validation of cluster analysis, Journal nf Computational and Applied Mathematics, Vol 20, 53-65, Elsevier Science.
Smolkin, M., and Ghosh D., (2003), Cluster stability scores for microarray data in cancer studies, BMC Bioinformatics, 4, 36, Sept. 2003.
Tamayo,P. et al, (1999), Interpreting patterns of gene expression with self-organizing maps: Methods and application to hematopoietic differentiation, Proc. Natl. Acad. of Sci. USA, Vol. 96: 2906-2912. Walker,R. et al., (2003) Data mining of gene expression changes in Alzheimer brain, to appear in the special issue of AI in Medicine, published by Elsevier Science, (2003).
Vilo,J. et al., (2000), Mining for putative regulatory elements in the yeast genome using gene expression data, ISMB-2000, August 2000: 384-394.
Yeung,K.Y, Haynor, D.R., and Ruzzo W.L, (2001), Validating clustering for gene expression data, Bioinformatics, Vol 17, 4 309-318.
Zhang,K and Zhou H., (2000) Assessing reliability of gene clusters from gene expression data, Journal of Functional Integrated Genomics, 1:156-17.