Grande Ecole Majeure Finance – Master in International Finance
Master’s Thesis
Acquiring technology companies:
Are Google, Amazon, Facebook, Apple and Microsoft (GAFAM)
more successful than non-tech bidders?
Authors:
Giacomo Genzini
Simona Kepalaitė
Supervisor:
Prof. Aram Attar
Paris,
June 2018
A
BSTRACTIn this paper, we compare the relative success of Google, Amazon, Facebook, Apple and Microsoft (GAFAM) on one hand, and a range of non-technology companies on the other hand, when acquiring technology targets. We develop a comprehensive definition of technology companies as well as a measure of success for this specific type of acquisition and provide both qualitative and quantitative analyses on a proprietary database covering over 700 deals. We find that – in principle – GAFAM enjoy a small relative advantage, but that its role in predicting success is limited . Instead, we identify four specific factors on which successful technology firm acquisitions depend – regardless of the nature of the acquirer – and we discuss how each may favour GAFAM or traditional buyers. Additional research would be necessary to establish whether these factors also apply to situations in which technology companies acquire non-technology targets.
A
CKNOWLEDGEMENTSFirstly, we would like to express our gratitude to our alma mater – HEC Paris – without whose education and resources our research would have been much more limited and less insightful. Secondly, we would also like to thank our supervising professor Aram Attar for first suggesting such an interesting research topic and for pointing us in the right direction on multiple occasions. We are also thankful to our friends and families for their support and understanding when we chose to dedicate our time to this research.
Lastly, we would like to thank each other for the fruitful collaboration that lead to the completion of this research.
T
ABLE OFC
ONTENTS ABSTRACT ... 2 ACKNOWLEDGEMENTS ... 3 TABLE OF CONTENTS ... 4 TABLE OF FIGURES ... 5 TABLE OF TABLES ... 6 TABLE OF APPENDICES ... 6 INTRODUCTION ... 7SECTION 1 – THE STARTING POINT ... 9
DEFINITIONS –WHAT MAKES A TECH COMPANY ... 9
LITERATURE REVIEW ... 10
DEFINING “TECH” ... 11
M&APROFILES OF GAFAM ... 13
M&A Profile – Google ... 14
M&A Profile – Amazon ... 15
M&A Profile – Facebook ... 16
M&A Profile – Apple ... 17
M&A Profile – Microsoft ... 18
DEFINING SUCCESS ... 19
SECTION 2 – GAFAM M&A: QUALITATIVE CASE STUDIES... 21
ENTERING NEW GEOGRAPHIES –AMAZON’S MARKETPLACES ... 21
THE MOBILE OPPORTUNITY –HOW DID GAFAM APPROACH IT? ... 22
ADVERTISERS FIRST?–HOW GAFAM MAKE MONEY ... 25
GAFAM RAISING THEIR VOICE –THE ORIGINS OF ALEXA,CORTANA,SIRI AND GOOGLE ASSISTANT ... 30
NOT THE FIRST BUT THE BEST –GOOGLE MAPS ... 32
CATCHING UP IN THE MAPPING SPACE –APPLE MAPS ... 35
STUCK SOMEWHERE IN BETWEEN –MICROSOFT AND YAMMER ... 37
IF YOU CANNOT BUY IT, COPY IT –FACEBOOK AND SNAPCHAT ... 38
SPENDING $500 MILLION TO SHUT DOWN A COMPANY – PRE-EMPTIVE BUYING IN THE AGE OF E-COMMERCE ... 40
SECTION 3 – WHY AND HOW DO NON-TECH COMPANIES ACQUIRE TECH COMPANIES? ... 42
SECTION 4 – NON-TECH TECH CASE STUDIES ... 44
THE FINANCIAL SECTOR ... 44
RETAIL... 45
MEDIA AND NEWS ... 46
AUTOMOTIVE ... 47
SPORTSWEAR ... 50
SECTION 5 – TECH M&A: QUANTITATIVE ANALYSIS ... 52
THE ANALYSES... 53
Descriptive Analyses ... 53
Success Analysis ... 68
SECTION 6 – ARE GAFAM BETTER TECH ACQUIRERS THAN COMPANIES IN TRADITIONAL SECTORS? ... 73
STRATEGIC FIT ... 73
POST-MERGER INTEGRATION ... 74
LONG-TERM COMMITMENT AND TALENT APPRECIATION ... 75
ITERATION –PRACTICE MAKES PERFECT ... 75
SECTION 7 – SUMMARY AND CONCLUSIONS ... 78
REFERENCES ... LXXX SUPPORTING APPENDICES ... XCII Table of Figures Figure 1. Google Map's Street View Global Coverage (Statista, 2017)... 34
Figure 2. $1 Billion+ Deals in Our Sample ... 53
Figure 3. Average Deal Price Distribution ... 54
Figure 4. Target Age Distribution ... 54
Figure 5. Tech Bidder Age Distribution ... 56
Figure 6. Target Funding Distribution (amounts raised in USD) ... 56
Figure 7. Non-Tech Bidder Sectors by Number of Deals ... 57
Figure 8. Top-20 Target Categories by Number of Deals ... 58
Figure 9. Target Employees Distribution ... 59
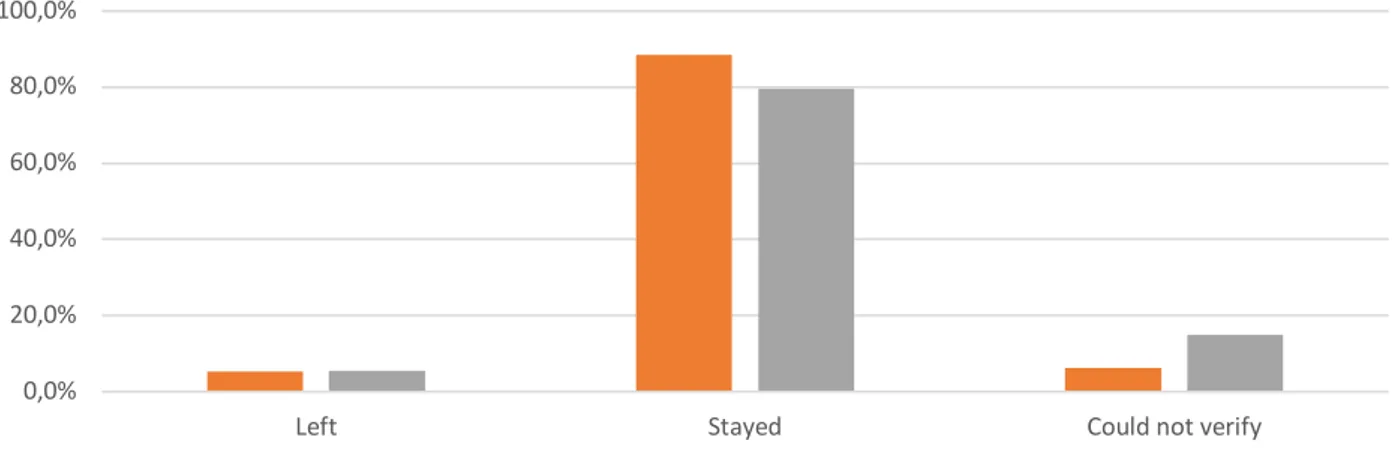
Figure 10. Team Retention Post-Acquisition ... 60
Figure 11. CEO Tenure Post-Acquisition ... 60
Figure 12. Deal Proximity Distribution ... 61
Figure 13. International Target Country of Origin by % of Deals, Split into Target Sector ... 63
Figure 14. PMI Distribution ... 64
Figure 15. Average Deal Prices Per Year, Tech Vs Non-Tech (amounts in USD) ... 66
Figure 16. Average Funding of Targets Each Year, Tech vs Non-Tech (amounts in USD) ... 66
Figure 17. Evolution of Acquisitions Resulting in Existing Product Improvement ... 67
Figure 18. Evolution of Acquisitions Contributing to the Development of New Products ... 67 Figure 19. 10 Most Expensive Deals of Each GAFAM (amounts in millions of USD) ... XCIX
Table of Tables
Table 1. Top 10 Public Companies by Market Capitalization (YCHARTS, June 19th 2018) ... 7
Table 2. Summary of Target Age Distribution by Bidder Type ... 55
Table 3. Summary of Significant Initial Regression Coefficients ... 71
Table 4. Summary of Significant Regression Coefficients in Our Final Model ... 72
Table of Appendices
Appendix A. Non-Tech Bidders ... XCII Appendix B. Database Variables, Detailed List* ... XCIII Appendix C. 10 Most Expensive Acquisitions for Each of the GAFAM ... XCIX Appendix D. Price-Target Age Regression for Both Bidder Types ... C Appendix E. Price-Target Age Regression for Tech Bidder Type ... CI Appendix F. Price-Target Age Regression for Non-Tech Bidder Type ... CII Appendix G. Price-Buyer Age Regression for Both Bidder Types ... CIII Appendix H. Target Categories ... CIV Appendix I. CEO Tenure (10 buckets) – Average Transaction Value ... CV Appendix J. Use of Cash in Acquisitions Made by Non-Tech Buyers ... CVI Appendix K. Success Rating per Bidder ... CVII Appendix L. Deal Price vs. Success ... CVIII Appendix M. Target Funding vs. Success ... CIX Appendix N. PMI Factors and Divestiture vs. Success ... CX Appendix O. PMI Factors, Divestiture and Non-Tech/GAFAM Dummy vs. Success ... CXI Appendix P. PMI Factors and Non-Tech/GAFAM Dummy vs. Success ... CXII Appendix Q. Significant-Only PMI Factors and Non-Tech/GAFAM Dummy vs. Success ... CXIII
I
NTRODUCTIONTechnology is the engine of economic growth. By increasing total factor productivity, it allows companies to increase the quantity, quality and value of their outputs, enabling them to create better products and expand into more sophisticated industries that account for a growing share of the economy and lead its development (Persson, 2010).
A lot has been written on the role of technology in driving productivity, with research focusing on both internal technology development and external acquisition. In the latter area, the role of Intellectual Property (IP) transfers - i.e. the way patents are filed for and traded – has been analysed extensively (Abernathy & Townsend, 1975; Agrawal, 2001; Cassiman & Veugelers, 2006; Gradstrand & Sjölander, 1990; Granstrand, Bohlin, Oskarsson & Sjöberg, 1992; Tsai & Wang, 2005; Stiroh, 2001).
Our goal is to shed some light on another aspect of external technology acquisition, focusing on the acquisition of entire technology companies, as opposed to the mere purchase of their IP. Others have already addressed the topic from different angles, mainly focusing on the different ways in which knowledge is extracted and integrated. Building knowledge through acquisitions is especially important because companies may not be able to internally develop the competences required to stay leaders in industries shaped by rapid innovation and technological complexity (Ranft & Lord 2002).
Our research question is whether companies whose businesses are entirely based on technology – “Tech” companies – are more successful at acquiring their peers than companies operating in more traditional sectors – “Non-Tech” companies. Most Non-Tech firms may have been in business for decades, but – with few exceptions – they have only recently begun to engage in technology M&A activities. This is most likely a response to the rapid changes that technology – digital in particular – has brought to their industries.
In order to answer our question, we are going to focus on five companies – Google, Amazon,
Facebook, Apple and Microsoft (henceforth referred to as GAFAM) – that in the last few years have
been frequently covered together by financial analysts and the media alike. While markedly different, these five companies share a few basic traits which make them similar in the eye of the public: they are all innovative technology firms, they are all American-based and, as we write, they are the five most valuable public companies in the world.
Table 1. Top 10 Public Companies by Market Capitalization (YCHARTS, June 19th 2018)
# COMPANY MARKET CAP
($ BILLION) # COMPANY MARKET CAP ($ BILLION)
1 Apple 915.20 6 Alibaba 522.30
2 Amazon.com 827.75 7 Tencent Holdings 490.46
3 Alphabet 805.76 8 Berkshire Hathaway 473.13
4 Microsoft 764.17 9 JPMorgan Chase 364.75
They also share a number of key characteristics which make them a suitable proxy for the technology industry as a whole. Most importantly, each of them has invested significantly in non-organic growth, producing vast amounts of data from which we can extract valuable insights. To set the basis for our analysis, the first section of this paper lays down a few operative definitions and provides an overview of the M&A strategies of each of the GAFAM companies.
Building on that, Section 2 provides a selection of qualitative case studies which – we believe – highlight the key themes emerging from our analysis of GAFAM acquisitions.
In Sections 3 and 4 we replicate the same process but focus on Non-Tech bidders. We present a comparable set of deals involving non-technology players acquiring technology companies, discuss the motives behind these acquisitions and explore the similarities and differences with our first sample through more qualitative case studies.
In order to make our analysis as rigorous as possible, we have reviewed and classified every acquisition made by the five GAFAM companies from their incorporation until the end of 2017, gathering and coding both quantitative and qualitative data points. The same has been done for the sample of non-technology buyers presented in Section 3. Section 5 therefore describes the resulting databases and provides a data-driven, quantitative analysis of the two groups of acquisitions in order to make our answer to the research question as objective as possible. We provide a wide range of statistical outputs and our own interpretation of the results, discussing the merits and limitations of this type of analysis.
Section 6 brings together the results of the previous sections and combines both qualitative and quantitative outputs to provide a final answer to our research question.
Section 7 concludes this paper with a summary of our key findings and a few suggestions on further topics of research.
BIDDER TARGET
Tech Non-Tech Tech Sections 1-2-5 Sections 3-4-5
S
ECTION1
–
T
HE STARTING POINTTechnology's central role in driving economic growth is undisputed. Economic history clearly identifies the Industrial Revolution as the pivotal moment that separates the last two and a half centuries of fast economic development from millennia of essentially flat GDP levels across the world (Cameron & Neal, 2003).
At the macro-level, economists have addressed the subject from multiple angles. The most widely recognized theory is the one formulated by Robert Solow (1956), whose eponymous growth model incorporates productivity improvement stemming from technological progress as one of three sources of economic growth – capital accumulation and labour intensity being the other two. At the micro-level, research has focused on internal technology generation and external acquisition. The first body of studies focuses on the capitalization of R&D expenditures as a way to quantify the potential for internal technology generation and value creation within firms. While researchers are not unanimous, their general conclusion is that returns on R&D investments are far more uncertain than the ones on PP&E (Kothari, Laguerre & Leone, 2002), and that markets tend to discount R&D-intensive companies to compensate for this extra risk (Lev & Sougiannis, 1996; Cazavan-Jeni & Jeanjean, 2007).
The second branch looks at the challenges that arise when acquiring technology from external sources, either through the purchase of IP in the form of patents or indirectly through acqui-hires (Coyle & Polsky, 2013; Makinen, Haber & Raymundo, 2012).
Our goal is to add more detail to the third path, namely inorganic (or semi-organic) growth through the acquisition of technology companies, be them promising start-ups or more mature businesses. Since we are interested in comparing the relative performance of technology and non-technology companies (from here on simply referred to as “Tech” and “Non-Tech” companies) when acquiring smaller Tech companies, the definition of what constitutes a “Tech company” is of paramount importance.
Definitions – What makes a Tech company
A relatively small number of remarkable discoveries and inventions made the rapid change from secular stagnation to fast economic growth possible, and a few companies were able to capitalize on them. First in Europe and the USA and later in Asia and Latin America, these companies were able to introduce new products and jobs that allowed people to improve their lifestyles and economic conditions and to escape the Malthusian trap (Galor & Weil, 2000; Persson, 2010). The steam engine, the internal combustion engine, electricity, vaccines, nuclear power and radio signals are only some of the inventions that have contributed to the development of human society in the last few centuries. Each can be traced back to one or more core technologies that multiple firms were able to master and spread over time.
Industrial firms, chemical firms, consumer good firms and even media companies are all reflections of their underlying technologies, and a case could be made that they all fit the definition of a “Tech company”. At some point in time, each of them embodied the latest technical developments and was perceived as the pinnacle of innovation.
Industrial conglomerates that struggle today were once the torchbearers of progress and technological advancement.
As interesting and fundamental as it is, virtually no formal academic research covers the topic. The issue of defining Tech companies has been tackled by many authors over the last 30 years and beyond, but always as a preliminary question rather than as a stand-alone matter. Since we are in the same position, we limit ourselves to a brief overview of their definitions and provide our own version for the purpose of this research.
Literature Review
Scholars inevitably run across the issue of defining Tech companies when they study Venture Capital and innovation financing. For example, Bachher and Guild (1996) define “technology based companies” as “those companies intending to commercialize a technology for the first time and thereby expecting to derive a significant source of competitive advantage from the technology”. Bauer, Dehning and Stratopoulos (2012) expand the analysis to encompass the financial performance of global Information and Communication Technology Companies at large. They base their samples on BusinessWeek’s InfoTech100 (2007) and on the Global Industry Classification Codes (GICS) 45 and 50, corresponding to “Information Technology” and “Telecommunication Services” firms respectively. In turn, BusinessWeek’s classification is based on S&P Compustat data and considers a sample of firms hand-picked from 8 industry categories.
Fernàndez, Callén and Laìnez Gadea (2009) look at European Technology companies and the impact of non-financial news on their stock price. Their sample is based on the “Sectorial e-business Watch”, an initiative of the DG Enterprise and Industry of the European Union which monitored the penetration of “ICT and e-businesses” in 15 selected industrial sectors.
Bernal, de Nieves and Briones (2016) encounter the issue when studying CSR strategy within Spanish technology companies and identify them based on their affiliation to one of the country’s Scientific and Technological Parks, building on research of Vásquez-Urriago, Barge-Gil and Rico (2012). Overall, these classifications all suggest innovation and ICT (Information and Telecommunications Technology) capabilities as the two main criteria to identify Tech companies. However, the final sample composition appears to be affected by arbitrary choices regarding the industries in which innovation takes place.
Given the intrinsic ambiguity of this type of definition, it is interesting to take into account the perspective of VC investors who interact with Tech companies on a daily basis as part of their vocation. Marli Guzzetta – Research Director at Inc. Magazine – gathered the views of some of them in 2016.
Upfront Ventures partner Greg Bettinelli defines Tech companies as firms that “use technology to create an unfair advantage in terms of product uniqueness or scale or improved margins”. In case of a doubt, he suggests considering whether a given company could exist without technology: if the answer is “no”, then that company must be a Tech company.
Hayley Barna of First Round Capital also stresses the role of technology in giving some companies an edge over industry incumbents and theorizes the existence of a middle ground between Tech and Non-Tech firms, suggesting that a full spectrum exists.
Alex Payne, technologist and co-founder of Simple Finance Technology corp. stresses the need for a Tech company’s product to consist of “applied scientific knowledge that solves concrete problems and enables other endeavours”.
As vague and inconclusive as they may sound, these definitions clearly show that Tech companies operate across sectors and that no such thing exists as a secluded “Tech industry”. They also suggest that companies enjoy some leeway in the way they market themselves. On one hand, firms that succeed in presenting themselves as Tech companies tend to be more appealing to investors and talents, resulting in cheaper capital, higher valuations and a more motivated workforce; on the other hand, expectations are higher for Tech companies, and so is the pressure on management. The clearest example of this definition-arbitrage is Juicero, a company that raised $120 million in venture capital to produce a connected juice machine that retailed for $400+. Despite the “Tech-valuation”, the product itself was rather low-tech and overly complicated, leading to a public scandal for misleading claims and eventually forcing the company to file for bankruptcy in 2017. A similar effect was extensively documented in the aftermath of the dot-com bubble, when several traditional companies rebranded to include “.com” in their name and reaped short-term benefits on the market (Rau, Patel, Osobov, Khorana & Cooper, 2002). More recently, similar “cosmetic effects” have been sought through the inclusion of blockchain or AI features in otherwise ordinary firms. One prominent example is the Long Island Juice Company that, after announcing that it would change its name to Long Blockchain Corp., saw its shares increase by 500% (Johnson, Samson & Megaw, 2017).
The allure of tech positioning can be tempting for traditional companies as well: both Goldman
Sachs and JPMorgan recently claimed their status as “Tech companies”. While these claims can be
backed by the sheer size of the engineering workforce companies employ, we resist the temptation to classify them as “Tech companies” and recognize that nowadays technology plays a crucial role in virtually every industry.
Defining “Tech”
Taking a cue from the elements discussed above, we elaborated our definition of a “Tech company” based on the following criteria:
• The company develops its own core technology internally rather than purchasing it from third parties, with limited exceptions. This technology may or may not be sold to clients, but it constitutes a competitive advantage.
• The core business of the company could not exist without this proprietary technology. This excludes basic technologies such as electricity but encompasses more specific inventions such as sensors or patented software.
• The core technology on which the company’s success is based on is innovative: it did not exist 10 years ago and it will probably be obsolete in another decade.
In other terms, Tech companies either exist for the purpose of supplying innovative technology to others, or they could not exist if they did not produce their own technology.
These three tenets allow for a certain degree of flexibility but set a limit to it. For example, the definition excludes traditional retail banks because their business could certainly exist without modern technologies (in fact, it did), and the infrastructure on which they operate is not itself a source of competitive advantage.
Over the last 20 years, many technological products have been enabled by a combination of internet and software. These circumstances might suggest a fourth tenet to be included in our definition, namely near-zero marginal costs and high scalability. While certainly interesting, however, this property seems more typical of the current phase of innovation rather than of technology in more
general terms. Most manufacturers of consumer electronics hardware face significant marginal costs, but no one questions their “Tech” status.
The list of contemporary Tech companies looks very different from the list that would have been written just 30 years ago, but this is consistent with the very definition of a Tech company that we propose: the definition of a company as “technological” depends on its ability to constantly innovate and add value to a given industry. As the potential for innovation decreases in a given industry as a whole – and new industries develop in which this potential is higher – old Tech companies find that their success rests increasingly less on technological advancements and increasingly more on operational efficiency.
We should stress that even accounting for this flexibility some corner cases exist that are hard to classify. For example, Tesla Motors is broadly regarded as a Tech company – a fact that is strongly reflected by its financial valuation. However, the cars it sells are not fundamentally different from some of the electric models that traditional manufacturers, such as Toyota or Nissan, have been producing for years. A similar argument could be made for some traditional players in the finance industry, which have an analogical legacy but have been quick to transform into digital players. While we have adopted a conservative view throughout our research, one should be open to reclassifying traditional players as “Tech companies”, should they radically change their DNA in response to competitive pressure from more technological competitors. We will return to this point in sections 3 and 4.
M&A Profiles of GAFAM
Over the last few years, Google, Amazon, Facebook, Apple and Microsoft have often been collectively referred to as GAFAM by the press and by some financial analysts (Google has since been reorganized as Alphabet, but the “G” survives in the acronym and is used throughout our paper). While markedly different in many ways, these firms are often addressed together because of their innovative nature, proven success and scale. As of June 2018, they were the five largest publicly traded companies in the world with an aggregate market capitalization above £3.8 billion (see Table 1), and the first trillion-dollar company is likely to be one of them.
They are all American (originated and based), but together they employ over 900,000 people around the world, and their products and services are available in most countries. Alibaba and Tencent are the largest non-GAFAM Tech-companies by market capitalization. They dominate China but not even their near duopoly – coupled with Chinese censorship and non-tariff barriers that hinder GAFAM expansion in favour of local champions – has been able to prevent Apple, Amazon and
Microsoft from having a role in China. Google famously abandoned China in 2010 under regulatory
pressure from the Chinese government, and Facebook was blocked the year before. However, the two companies have not given up on China, and are both working on ways to access its huge market. Conversely, Alibaba and Tencent have been expanding freely in Western countries, only to find that GAFAM companies are much stronger competitors there. While Chinese Tech companies deserve close attention and are only going to grow, their tight relationship with the government and their almost exclusive reliance on the home market – however large – make them fundamentally different from GAFAM, prompting us to exclude them from our current research.
More recently, some financial commentators (starting with CNBC’s Jim Cramer) have been substituting Netflix for Microsoft because of the two companies’ relative financial performance and future prospects, giving rise to FAANG. However, Microsoft bears many more similarities with the rest of the group than Netflix.
Most significantly, our focus on GAFAM is justified by the fact that these five firms are among the most acquisitive Tech companies in the world: together they have acquired more than 500 companies to date (in contrast, Netflix made its very first acquisition only in 2017). This makes them ideal candidates for our research on the relative success of Tech and Non-Tech acquirers.
Scott Galloway – NYU Stern professor and author of The Four – also places Microsoft in a different category, arguing that its influence on society is in decline and its market power has peaked. In
Microsoft’s defence, we notice that its market capitalization has been steadily rising in the last few
years and, as discussed below, the last change of leadership may have infused new life and a new vision in the company.
Other firms such as Twitter and Snapchat – but also Intel, Cisco and IBM – have also contributed significantly to technological innovation in the last decade. However, these companies are smaller, tend to have a narrower focus on a single core business and – crucially for our research – have not been as active in M&A as the five companies we analyse in this paper.
At this point, it is important to specify that our research excludes those early-stage investments for partial ownership that most GAFAM companies make through separate Corporate Venture Capital branches. We focus on companies on which GAFAM have full control.
What follows is a brief overview of the acquisition strategies of each of the GAFAM. While sections 2 and 5 stress their similarities, it is worth taking the time now to outline their main differences, as well as the assumptions and strategic choices behind them.
M&A Profile – Google
Google’s (currently Alphabet) acquisition strategy is difficult to define due to the sheer quantity of
deals made (approx. 220 companies acquired1 to date) and also due to their broad scope – Google’s acquisitions are not focused in a particular field. However, the strategy has been globally described as taking on a semi-organic growth approach (Geis, 2015) and is an obvious source of innovation and growth for the company – some of its core and most famous products are direct and indirect results of these acquisitions.
Taking a closer look, the strategy could be broken into two broad and interconnected streams: strategic core business developments (improvements and expansions through differentiation) and bets on the future of technology (moonshots and independent ventures).
These deals originate from various sources but two principal ones stand-out: need and network. Target companies are either sought out to fix a particular internal problem, or an interesting company is introduced to Google through its vast network, especially through start-up founders who had previously joined through acquisitions.
When evaluating a potential acquisition, two core criteria are used at Google:
• The Toothbrush Test – is the product something to be used daily and would it make the user's life better?
• The Team – is the founding/managing team a good fit for Google?
Whereas the toothbrush test is enough to attract Google’s interest in a company – no matter if it relates to its areas of activity – the team fit is thoroughly vetted as well – founding members meet the CEO Larry Page and VP Sundar Pichai before any decision is taken. Only if the company matches both criteria, Google is interested in pursuing the acquisition.
The success of the deal is internally assessed based on the integration of acquired companies and their employees and is closely monitored. Google makes sure to deliver the promises made to the founders of acquired companies and also runs 90-day follow-ups on all of the deals executed, even to the disbelief of the start-up founders, according to Don Harrison – VP of Corporate Development (as reported by D'Onfro, 2015). Based on the internal measures, back in 2012, Google estimated that two thirds of their acquisitions had been successful (Ludwig, 2012).
The level of integration itself is also varied: either companies and their employees are absorbed into existing or forming structures (e.g. ASI) or they maintain their autonomy with some or no integration with Google’s other products (e.g. Nest, YouTube and moonshots).
The promise of freedom, coupled with access to Google’s vast resources is a common attraction point, especially for the teams of start-ups that are already operating successfully on their own. By joining Google, the team can then concentrate completely on their principal goals.
It has also been speculated by a few sources (for example Yarow, 2010) that acquisitions have become a way for Google to hire employees when competition for talent is at an all-time high in Silicon Valley. Indeed, from our research we can see that a significant number of founders have joined Google after the acquisition, with some even staying on for long periods of time – something unusual in Silicon Valley but not as much for Google (Luckerson, 2015).
1 For the scope of this research, we only consider deals made by Google’s (and later Alphabet’s) core M&A team
M&A Profile – Amazon
Amazon has relied extensively on M&A to drive its expansion, both geographically and across
businesses. The company started out as a US-only online bookstore in 1994, and its first acquisitions targeted competitors in other countries (bookpages.co.uk and telebuch.de) which soon became local versions (marketplaces) of the Amazon platform. The same method was applied to enter the first product categories outside books, with the acquisition of vertical e-commerce websites specialized in the sale of music CDs (CDnow), power tools (Tool Crib of the North), toys (Back to
Basics) and apparel (Zappos, BuyVip).
Each of Amazon’s acquisitions has been driven by one of three factors: • geographic/channel expansion
• product category addition • technology acquisition
Regardless of the factor, a clear picture emerges from the analysis of 20 years of deals: Amazon relied on acquisitions to expand its geographic reach, product catalogue and technical capabilities at first, but its real strength is the way in which it has been able to systematically integrate its targets into a single ecosystem and to learn from the process.
Having bought local players in Germany and the UK, Amazon learnt how to open its own marketplaces in countries like France, Spain, Italy and Australia starting from scratch. In much the same way, it did not need to purchase a vertical specialist when it started selling gardening tools, for example. And while many key pieces of technology were obtained through acquisitions (the Kiva robots that now power many of the firm’s fulfilment centres are probably the best example),
Amazon has become a leader in cloud computing and software engineering mainly through in-house
development.
While not all acquisitions have been widely publicized, Amazon has always been quite explicit about its M&A strategy, acquiring companies in adjacent fields with clear integration goals. Very few firms have remained independent for long (Zappos and Twitch are remarkable exceptions): the majority of Amazon’s targets have been integrated into the bigger ecosystem within just a few years.
The picture that emerges from the 86 deals we covered is that of a company which has been able to refine and master its internal integration processes, with scalability and repeatability in mind. The acquisition of talent has been secondary with respect to that of capabilities: less than half of the CEOs of the companies Amazon bought were still working at the firm 3 years after the deal was done, but the capabilities of these companies have always been integrated.
While we did see a gradual shift from inorganic to organic growth in the three dimensions above, we should note that Amazon has not stopped making acquisitions for any of the three points mentioned above: while it opened its Australian marketplace from scratch, it did enter the Middle East with the purchase of a local platform (Souq). And despite its experiments with brick-and-mortar retail, it has entered physical groceries through the acquisition of Whole Foods, its largest acquisition to date2. It has also been investing heavily in cyber security and gaming software.
2 Since Whole Foods is not a technology company, we did not include it into our analysis. However, we do recognize its
M&A Profile – Facebook
Facebook’s acquisition strategy has evolved as the company grew over time, but it retains a very
targeted approach with an almost exclusive concentration on software companies (with the notable exception of Oculus Rift and a few smaller companies). Acquisitions are a key aspect of the company’s growth and maintained leadership position – 4 out of 6 Facebook’s standalone brands were acquired (Instagram, Whatsapp, Oculus, tbh) and most of the other companies were acquired to bring improvements to the company's core activities.
Facebook’s acquisition strategy started out very gradually as the company made only two deals
before 2010 – in contrast, since then the company made between 7 and 10 deals every year, slowing down again in 2017. The acquisitions were also almost exclusively in the form of acquihires up until the purchase of Instagram in 2012. This specific acquisition thesis was described by founder M. Zuckerberg in 2010: “We have not once bought a company for the company. We buy companies to
get excellent people.” And even if the strategy has broadened in the years since, it is still heavily
concentrated on the quality of the people onboarded through the acquisition.
Facebook has been acquiring companies that allow it to maintain its established leadership position
by keeping up with the fleeting crowds – the purchase of Instagram brought a younger user base and so did the acquisition of tbh, while WhatsApp gave Facebook access to a more international user base. Moving forward, it is safe to assume that Facebook will try to concentrate even more on its monetization efforts – it has been involved in bidding wars on advertising companies3 with Google on a few occasions already.
In 2017, M. Zuckerberg explained the four main acquisition strategies employed at Facebook, in all of which he himself seems to be heavily involved (Heath, 2017):
1. Building relationships first – in line with long-term vision, M. Zuckerberg establishes friendships with company founders that he is interested in long before Facebook makes inquiries about a potential acquisition.
2. Having a shared vision – M. Zuckerberg makes sure that both companies are equally excited to be working together and that they both see the benefit of a mutual effort.
3. Sometimes using scare tactics – M. Zuckerberg has admitted to occasionally using scare tactics on small businesses, emphasising how difficult it would be to try to run their business alone, but maintained that it is not the preferred modus operandi.
4. Moving fast and buying things – by playing the long game since the very beginning (establishing a relationship long before a company is ready to be acquired), Facebook can close deals quickly once the time is right and does not have to waste time on due diligence at a crucial moment.
All in all, these steps help to ensure that Facebook not only chooses their targets right, but also that it is more likely to place the winning bid – even if on some occasions it is below the target’s expectations or other competing bids. Looking forward, it is very likely that Facebook's acquisition strategy will deviate from its focus on purely software targets, especially as in 2016 it established its own consumer hardware lab called Building 8.
M&A Profile – Apple
“Apple buys smaller technology companies from time to time, and we generally do not discuss our purpose or plans.”
While the deals of other GAFAM companies are usually quite straightforward to interpret, Apple’s acquisitions are much more cryptic. The reason is twofold: not only does Apple talk much less about its purchases (the quote above is the traditional reply the company has been offering to journalists inquiring about acquisitions for the past twenty years), it also tends to make acquisitions in the very early stages of development, years before their capabilities find commercial application in one of
Apple’s products.
While we can only speculate whether Apple’s development cycles are longer than those of its peers – and whether other firms are faster at integrating acquisitions – we do observe that the purpose of many of Apple’s acquisitions is not clear until many years after they are made.
This is consistent with Apple’s general preference for product-quality over speed to market, but it does make the analysis of its acquisition strategy more challenging than for some of its peers. It is also consistent with Apple’s reliance on hardware as a sales driver: while other GAFAM companies make most of their money selling services or advertising, Apple provides most software as a free complement to its hardware, for which it charges customers. It could be argued that hardware acquisitions (be them about finished products, simple components or production technology) take longer – on average – to make an impact, simply because physical products are not as quickly scalable as software.
As an example, Apple acquired LuxVue Technology – a company that produces MicroLED displays in 2014. And rumours are only now beginning to surface that the technology acquired might be employed in the next generation of Apple Watches, which could be launched in late 2018.
Another characteristic of Apple is its long-term investment in a full ecosystem – as opposed to a portfolio of hardware and software products. This element certainly plays in favour of customers, but it can make it harder to identify where exactly the firm’s acquisitions come into play. The acquisitions of Lattice Data (an Artificial Intelligence start-up), Turi (a slightly more mature company working on Machine Learning) and Shazam (a music recognition mobile application, EU approval pending) amount to over $800 million, but the way in which they fit Apple’s plans remains uncertain today.
Remarkable exceptions to this secrecy exist: Beats Electronics was explicitly bought for its Beats
Music streaming service, which served as foundation for Apple Music. Similarly, it was clear that Apple was designing its own mapping service as soon as it purchased Placebase in 2009. Still, it took
the company another four years of work to debut the service, and ten more mapping companies have been acquired since then.
Most of Apple’s acquisitions centre around technology and people: the companies behind them are usually terminated, their websites shut down and their products either rebranded or incorporated into a broader ecosystem. The Beats brand is one of very few exceptions.
M&A Profile – Microsoft
Microsoft’s vast acquisition record (approx. 175 companies acquired4) comes from its long history and can be globally described as a strategy to strengthen the company’s position in the markets where it already exists – overall, the company has focused on core product development and improvements. The majority of its acquisition deals have come from a bottom-up approach – when a product team has a need that could be fulfilled by an acquisition – and have been focused on smaller companies.
Microsoft's propensity to sometimes purchase Tech companies after establishing a partnership
could be viewed as a differentiating factor from other GAFAM companies' strategies. Moreover, the acquisition activity profile and strategy can be clearly divided into three distinctive periods, based on the tenures of its three CEOs. The difference in strategies is especially stark between the previous CEO Steve Ballmer, who resigned in 2014, and the current CEO Satya Nadella, who succeeded him. During Steve Ballmer’s tenure (2000 – 2014), Microsoft seems to have lacked clear strategic vision in both corporate and M&A terms. This prevented it from making some important strategic moves, making it miss attractive opportunities and eventually lag behind its competitors. In addition, during this period Microsoft made some very big – albeit incoherent – deals that did not work out for the firm, earning it the reputation of a company that never does well with large acquisitions. One well-known example of this was Ballmer's decision to purchase Nokia's mobile phone business in 2013 for over $7.4 billion, even as other key people at Microsoft expressed their concern and disapproval of the deal. It is now widely accepted that this deal was a failure, as Microsoft did not make use of the acquisition, wrote-off an extensive part of it and finally divested. Another example is the $6.3 billion acquisition of aQuantive in 2007, amid an online advertising acquisition spree intended to allow Microsoft to catch-up with Google. This particular deal led to write-offs of $6.2 billion in 2012, as the growth acceleration expected from the acquisition failed to materialize.
Under the new CEO Satya Nadella, Microsoft’s M&A activity has increased significantly and has become much more focused as he turns around and centres the firm’s overall strategy around the cloud rather than the Windows product. Not only has Nadella put the focus on particular industries of interest, he has also led acquisition efforts in a more disciplined and centralized manner – M&A activities have been consolidated and some interesting but unclear opportunities foregone (e.g. the purchase of Slack that Microsoft walked away from) – showing more restraint than his predecessor. In this new era, Microsoft seems to be following a new type of M&A philosophy –the company now practices what the Financial Times (2018) has called a “network approach”, where Microsoft ventures to purchase companies that are more online communities and networks than anything else, with overlapping mutual interests. The challenge comes later: how to exploit the areas of common ground without destroying the independent value of those communities and networks. The latest big acquisitions of Majong, LinkedIn and GitHub (announced in June 2018) fit this pattern rather well. The three companies represent Microsoft’s interest in game developer, business professional and software developer communities with the intent of reinforcing the company’s image as a professionals’ tool provider that was somewhat diminished over the recent years. However, as these acquisitions are fairly recent it is still too early to say whether this strategy will be fruitful.
4 Microsoft makes deals in three forms – partnerships, acquisitions and investments. Once again, it should be noted that
Defining success
Given the nature of technology acquisitions made by technology companies – which as the profiles above outline often aim at building more sophisticated products rather than simply extracting synergies or exploiting scale – defining success is not easy. Existing literature in the field does not help much, in that it lacks a consistent methodology and assesses M&A outcomes on a diverse range of factors, including financial, operational and behavioural (Marks & Mirvis, 2001).
In most cases, M&A targets are completely absorbed by acquirers to the point that they cease to exist as separate distinguishable entities, which makes it virtually impossible to measure the added value generated through their acquisition: even as their websites are shut down and their brands dissolved, the technologies and know-how of the target companies live on and ideally contribute to the success of the acquirer as a whole. When this does not happen, it sends a very strong signal that the deal destroyed value.
The most traditional approach to assess the success of an acquisition revolves around the “make or buy dilemma”, first formalized by Coase (1937) and revisited by several authors since then (cfr Williamson 1975; Anderson 1986). It could be argued that where the cost of buying a technology through an acquisition is lower than the cost of internal development, the buy option should prevail and acquisitions should be successful. As market friction increases, so does the appeal of internal development.
While intuitively correct, this approach oversimplifies the decision to be evaluated, because the alternative cost of internal development is supposed to include many elements which are impossible to quantify. More recently, Slack (2007) and others have highlighted that the long-term implications of the make-buy decision are far more significant than the short term economic consequences. Factors such as exclusivity and secrecy are difficult to incorporate in a purely economic computation of the costs and benefits of an acquisition, but often determine the difference between success or failure of a deal.
A large userbase is another asset that can be hard to price as establishing the cost of recreating it from scratch (i.e. estimating the business’ Customer Acquisition Cost) involves assumptions about the product being offered, marketing activities, their conversion rates and the natural churn of the business, all factors which vary enormously on a case by case basis and are often impossible to estimate independently and from the outside.
A second school of thought concentrates on post-merger integration, focusing mainly on capability and knowledge sharing and integration. Whereas some sources have strongly argued that knowledge integration is essential for one to claim a value-creating acquisition (Larsson & Finkelstein, 1999; Ranft & Lord, 2002), subsequent research has highlighted the integration-autonomy dilemma (Datta & Grant, 1990; Duncan & Mtar, 2006; Puranam & Srikanth, 2007; Puranam, Singh & Chaudhuri, 2009 and others). And while successful integration is not necessarily easier to define than successful acquisition, a few sources mention the retention of the target’s key human capital as an indicator or precedent of successful post-merger performance (Aghasi, Colombo & Rossi-Lamastra, 2017; Chaudhuri & Tabrizi, 1999; Graebner 2004).
Given the potentially infinite list of “things that could go wrong”, a conservative approach could simply define as successful those acquisitions that do not dilute the value of the company being acquired in terms of technology and user base (where applicable). It is tempting to include the target’s team among the assets that should not be destroyed, but we recognize that many acquirers are able to preserve the value of their targets even when their founding members leave. This approach is a first approximation, but it ignores the cost of acquisition.
A third, specular approach involves an analysis of those deals that were clearly unsuccessful and a definition of success that is “reverse-engineered” based on the opposite criteria. Companies that were sold for less than they were acquired for, or which were shut down or written-off without their technologies or products being integrated clearly qualify as unsuccessful. Conversely, survival and evolution of the acquired technology within the acquirer’s organization therefore appears to be a crucial factor in achieving a successful deal.
A fourth approach consists of assessing the threat to the acquirer’s business represented by the target before its acquisition and comparing the cost of the acquisition to the decline in sales and profits that would have resulted from a loss in market share, had the target remained independent: buying fast-growing competitors and shutting them down can save incumbents a lot of money, i.e. the opportunity cost of not buying them is high (Marks & Mirvis, 2001).
Regardless of the starting point, the single most important factor that predicts and signals the success of an acquisition is the fit of the target with the company integrating it. In our analysis, we focus on business fit, limiting considerations about culture which can make or break very large deals but are very hard to track and are less likely to influence the integration of smaller, younger firms. Our definition of success therefore considers the following elements:
• Whether the company acquired was divested/written-off/spun-off or not.
• Whether the company was well integrated or not. For this second point we look at several indicators, including:
o Whether the target company formed a new division in the one acquiring it, and whether its products were kept unchanged. When this was the case, we look at whether this situation was stable or momentary.
o Whether the target was used to expand into a new channel or market. o Whether it clearly became part of a new or existing product.
o Whether the technology of the target was used to improve the internal efficiency of the acquirer’s operations.
Recognizing the complexity and uniqueness of each deal, we also collected additional variables (as explained in Section 5) and evaluated every transaction to our best judgement, considering the context in which it happened and looking for additional data where needed.
S
ECTION2
–
GAFAM
M&A:
Q
UALITATIVE CASE STUDIESWhile the quantitative analysis of our dataset in Section 5 highlights interesting insights and trends, it can fall short when it comes to providing a clear-cut judgement on the success of some acquisitions. This should be expected, considering the infinite range of variables that could be explored, their availability across deals and the sheer definition of success itself.
In this more qualitative section, we look at some of the more complex deals strategic drive whose may not transpire from a merely numerical analysis. Our main goal for this section is to provide a broader context for the analysis of such acquisitions, looking at business models, industry trends and competitive dynamics in more detail. By showing how many acquisitions are actually intertwined and contribute to the long-term objectives of the five GAFAM, we hope to shed more light on the rationale behind these deals and to complement and support our quantitative Section 5. We provide examples of both success and failure, and focus on their underlying causes.
The case studies that follow are just some of the most significant examples we identified: we first present a few cases of “classic” business expansion and then move on to more complex examples of competitive interaction resulting in M&A.
Entering new geographies – Amazon’s Marketplaces
Amazon relied on acquisitions to enter its first foreign markets: until 1998, the e-commerce platform
operated exclusively in the US, where it sold books. In the spring of 1998, however, the company disclosed the acquisition of Bookpages.co.uk and Telebuch.de, two smaller firms operating very similar businesses in the UK and Germany. The two websites became Amazon.uk and Amazon.de, which launched in the same year.
The strategy was clear: Amazon had no knowledge of the English and German markets, but it knew how to sell books online, so acquiring a local competitor and turning it into a foreign version of its American platform was a sensible business decision.
What is more interesting is the fact that the same strategy was not adopted for the rest of Europe. Once the firm learnt enough about the European market, it was able to launch its French, Italian and Spanish marketplaces organically without acquiring any local players. This was not because of a lack of potential local targets. Rather, as the company scaled up and understood how to expand across product categories and regions within a given country, cross border expansion became more of a matter of translation and local compliance. Products could be shipped from the closest fulfilment centre, regardless of its nationality, and building state-of-the-art infrastructure from scratch probably became more convenient than converting existing facilities.
In China, the same playbook was used. The company had no presence in the region and was entering a competitive market dominated by Alibaba, JD.com and a few relatively smaller players. Facing a huge market with strong incumbents, Amazon once again opted for an acquisition and, in 2004, decided to purchase and rebrand Joyo.com – a local player. At the time, Joyo was the largest e-commerce platform for books, which made its acquisition extremely consistent with Amazon’s initial moves in Europe.
However, things were markedly different this time: Amazon was already selling multiple product categories in other countries, and local competitors were much bigger than any company Amazon had ever faced. They had deep market knowledge and sold virtually everything. For these reasons,
the launch of Amazon.cn was not successful and the company has been struggling in China ever since.
The mistake it made was not the acquisition of a local player, but rather investing too little to expand quickly. Recognizing its own mistakes, Amazon entered India in 2013 determined to spend as much as needed and to pursue a more aggressive expansion. Indian laws prevent foreign businesses from selling goods directly to Indians, so Amazon.in had to be founded as a marketplace with no inventory, connecting buyers and sellers, and handling logistics and purchase experience (something akin to the “Fulfilled by Amazon” program that exists alongside the direct sale method in other countries).
This made the local acquisition route impractical, but it did not prevent Amazon from acquiring Indian expertise in other ways: back in 1998, Amazon had acquired Junglee.com, a generalist e-commerce platform founded and run by Indian graduates in the US that aggregated offers from online and offline retailers. The website – which covered the US market only, at first – was launched in India in 2012 and served as a testbed for Amazon.in, into which it was integrated in 2016.
The latest episode in Amazon’s expansion saga was the acquisition of Souq.com, an e-commerce platform operating in the Middle East (UAE, Saudi Arabia, Egypt, Bahrain, Oman and Qatar). The purchase allowed Amazon to enter the region as a market leader, integrating Souq.com while preserving its interface. Future plans have not been disclosed: today Souq.com operates as an independent website (its logo has been updated to include the line “an amazon company”) but
Amazon’s track record suggests that the platform could be fully rebranded and eventually folded
into local versions of amazon.com.
An important trend emerges from the analysis of Amazon’s geographical expansion strategy: acquisitions were successful as long as they were sustained with adequate investments. This was the case in Europe, but not in China. It is too early to say whether Amazon’s investments in India will be enough to make it a local leader – especially considering Walmart’s majority-investment in a local e-commerce Flipkart – but the fact that Amazon’s leadership was quick to admit it had underinvested in China leaves us confident that things will be different here.
Another key takeaway that emerges from this analysis but can be generalized is that Amazon became a better acquirer of foreign marketplaces as time went by. Its European attempts succeeded because they were extremely focused and happened at a relative early stage in the development of the ecommerce industry. Acquisitions failed in China, where the company apparently underestimated the power of local competitors. In India and the Middle East, Amazon seems to have learnt its lesson and became more cautious.
Time will tell to what extent this experience is applicable to new acquisitions, but the point seems to hold for other companies making multiple acquisitions in the same domain (e.g. Apple acquiring more mapping companies).
The mobile opportunity – How did GAFAM approach it?
The world was different before 2007. Smartphones as we know them did not exist and “mobile” did not have the meaning it has today. The digital world was accessed exclusively through computers, and laptops represented the most extreme form of portable productivity – with only BlackBerry existing as a niche product for managers. Microsoft and Apple contributed to the development of Desktop computing, while Google, Amazon and Facebook were born in this environment. Mobile phones were just phones, and there was essentially no overlap between the companies
manufacturing them and the ones making computers. Nokia was the market leader, followed by
Motorola, Samsung and Sony.
On January 9th 2007, everything changed. Apple announced the iPhone, a touchscreen-based mobile phone running an adapted version of the company’s powerful desktop operating system which – in the words of Steve Jobs – was 5 years ahead of anything the competition could produce. Whereas software capabilities were developed in-house and came from the company’s experience with the Mac, the most innovative piece of hardware technology – the touchscreen – was developed by
FingerWorks, a small company Apple purchased in 2005.
Indeed, the iPhone was a revolutionary product, but while many focus on the technical aspect of this revolution – which is undeniable, considering the acceleration in mobile hardware and software development it initiated – its impact on business models was equally profound.
Two models prevailed in the desktop era: on one side was the fully integrated scheme championed by Apple, which developed both its hardware and software; on the other side was the predominant model imposed by Microsoft, which developed the Windows operating system and licensed it out to hardware manufacturers for a fee. A third model existed whereby users would purchase a PC and independently install a free open-source operating system – usually a version of Linux – but it only catered to a niche of expert users.
When it came to addressing mobile as a platform, Apple’s approach – writing iOS software and designing the iPhone, outsourcing only its final assembly – was perfectly consistent with what it had been doing with the Mac.
Microsoft, on the other side, faced a dilemma: the mobile opportunity was compelling – in fact, a Windows Mobile OS had existed since 1996 – but the technology in the iPhone was much more
advanced than anything seen until then. Over the next few years, Microsoft actually managed to create an OS powerful and elegant enough that some thought it would actually be a worthy competitor to Apple and Android. The modern Windows Mobile OS was launched in 2010 and in the next couple years received great reviews for being something different – at a time when Apple had been recreating the same phone over and over again – and functional – Windows Mobile was much faster than Android was then.
Partnerships with key mobile phone manufacturers – Nokia adopted Window Mobile OS over
Symbian and Meego, HTC and Samsung were early adopters as well – helped propel Windows
phones to hardware competitiveness as well – Nokia Lumia 1020 with Windows Mobile OS was one of the first modern camera-phones.
In 2013, Microsoft decided to follow Apple’s model and increase its exposure to hardware, acquiring
Nokia’s mobile phone unit for $7.2 billion. However, Windows phone’s every chance of success was
scrapped by the almost non-existence of third-party developer applications for Windows Mobile. Not only did the Windows Mobile OS meet its demise (it was officially discontinued in 2017),
Microsoft also brought down Nokia with it: the business was shut down in 2015 after a $7.6 billion
write-off related to the deal. Once a promising contender, Microsoft eventually gave way to the two mobile behemoths we have today.
Even though the iPhone caught the mobile industry by surprise, Apple and Microsoft’s interest in the field was to be expected considering the similarities between desktop computers and mobile phones. After all, both were powered by microchips, connected to the internet, accepted inputs through keyboards and had screens. What was more difficult to predict was Google’s interest in mobile operating systems. The company had the early intuition that mobile web traffic would soon explode, and did its best to position itself accordingly.
Google quietly acquired Android for an estimated $50 million in 2005, after Android’s first
unsuccessful pitch to Samsung. At the time it was an interesting experiment as no one expected
Google to break into an already well-established market. Surprisingly, Google took a complete
different route than anyone else, especially Microsoft: Android was developed based on a Linux kernel and created as an open-source operating system that was welcoming to third-party developers and was ultimately intended to be free for anyone to use. After Google offered sizeable rewards to developers to create the best Android-based application in 2007, it became clear that
Google is not going to compete with the iPhone straight on but will rather foster the development
of an OS that is independent from any hardware. Not only did Google open-source Android software from version 1.1 – released in 2008 – it also open-sourced its mascot and logo, truly embracing this model.
Eventually, the free “Linux model” prevailed. Looking at the bigger picture, this was consistent with the broader trend of the freemium model taking off, with users trading their personal data in exchange for “free” services. Google overtook Microsoft in disrupting the scene and became Apple’s main competitor on the OS front – by 2015, 96.8% of all mobile phones sold were either iOS or
Android powered (Savov, 2015).
It is worth mentioning that Google did venture into mobile hardware as well. Google’s most expensive ever acquisition was that of Motorola Mobility in 2011. Google paid a total of $12.5 billion for the mobile hardware manufacturer and subsequently sold it for $10 billion less to Lenovo in 2014. The outcome of this acquisition is debatable – Google kept the patents it took over through the acquisition and, possibly, used the acquisition both to scare Samsung into obeying Google’s wishes of not tampering too much with Android (the two companies signed a global patent deal days before the divestiture) and to experiment with hardware making. On the other hand, Google has also been involved in the Nexus phone line since 2010 (made by various contract manufacturers), which has been succeeded by the Pixel line in 2016 (made with HTC as contract manufacturer). In 2017, Google has ventured forward by acquihiring a massive portion of HTC’s mobile division team.
While Google, Apple and Microsoft have all been tightly involved with the progress of the mobile industry as a whole, Amazon and Facebook were not immune to its charm.
Amazon has had a hardware division since 2004. Called Lab126, it was launched to develop the Kindle – Amazon’s first e-reader – and grew both organically and through acquisitions. In particular, Amazon’s hardware acquisition strategy has focused on touchscreen technology – with Touchco in
2010 and Liquavista in 2013 – and microchip design – with the acquisition of Israeli Annapurna Labs in 2015.
The company began developing its Fire Phone in 2010 and announced it in 2014. The project was ambitious and introduced several innovative technologies such as a holographic 3D screen and a system that recognized objects, text and even sound, and suggested related purchases through amazon.com. The hardware was developed entirely in-house, while the operating system was a customized version of Android.
The phone was probably a way to both showcase the company’s own innovative technologies and enrich Amazon’s ecosystem with a product that could bring Amazon’s marketplace and additional services into its customers’ pocket. Whatever the original ambition, the Fire Phone was discontinued one year after it was first announced and is considered to be one of the Tech industry’s most notable flops.