HAL Id: hal-02874555
https://hal.archives-ouvertes.fr/hal-02874555
Submitted on 16 Jul 2020HAL is a multi-disciplinary open access archive for the deposit and dissemination of sci-entific research documents, whether they are pub-lished or not. The documents may come from teaching and research institutions in France or abroad, or from public or private research centers.
L’archive ouverte pluridisciplinaire HAL, est destinée au dépôt et à la diffusion de documents scientifiques de niveau recherche, publiés ou non, émanant des établissements d’enseignement et de recherche français ou étrangers, des laboratoires publics ou privés.
New insights into the structure of membrane fouling by
biomolecules using comparison with isotherms and
ATR-FTIR local quantification
Sepideh Habibi, Murielle Rabiller-Baudry, Filipa Lopes, Fabien Bellet, Benoit
Goyeau, Mohammed Rakib, Estelle Couallier
To cite this version:
Sepideh Habibi, Murielle Rabiller-Baudry, Filipa Lopes, Fabien Bellet, Benoit Goyeau, et al.. New insights into the structure of membrane fouling by biomolecules using comparison with isotherms and ATR-FTIR local quantification. Environmental Technology, Taylor & Francis: STM, Behavioural Science and Public Health Titles, 2020, pp.1-18. �10.1080/09593330.2020.1783370�. �hal-02874555�
Publisher: Taylor & Francis & Informa UK Limited, trading as Taylor & Francis Group Journal: Environmental Technology
DOI: 10.1080/09593330.2020.1783370
N
EW INSIGHTS INTO THE STRUCTURE OF
MEMBRANE FOULING BY BIOMOLECULES
USING COMPARISON WITH ISOTHERMS AND
ATR-FTIR
LOCAL QUANTIFICATION
Sepideh Habibia, Murielle Rabiller-BaudryC, Filipa Lopesa, Fabien Belletb, Benoit Goyeaub, Mohammed Rakiba, Estelle Coualliera,d *
a: Laboratoire de Génie des Procédés et Matériaux, LGPM, CentraleSupélec, Université Paris-Saclay, Grande Voie des Vignes, 92295 Châtenay-Malabry, France
b: Laboratoire EM2C, CNRS, CentraleSupélec, Université Paris-Saclay, Grande Voie desVignes, 92295 Châtenay-Malabry, France
c : Univ Rennes, CNRS, ISCR (Institut des Sciences Chimiques de Rennes) – UMR 6226, F-35000 Rennes, France
d : Université de Nantes, CNRS, ONIRIS, Laboratoire de Génie des Procédés, Environnement et Agroalimentaire, GEPEA, F-44600 Saint Nazaire, France
ABSTRACT
The objective of this paper was to propose a deepened analyze of a microfiltration membrane fouling by two biomolecules: a protein (Bovine Serum Albumin) and a peptide (Glutathione). In addition to an analysis of flux decline, the mass of biomolecules accumulated on the membrane during filtration was quantified and compared to adsorption experiments, using Fourier Transform Infra Red spectroscopy in Attenuated Total Reflection mode (ATR-FTIR). It was demonstrated that the same quantity of accumulated biomolecules on the apparent membrane area can generate totally different flux declines because of different fouling mechanisms. On the one hand, Glutathione can adsorb in the whole porous media of the membrane, penetrating through the pores, modifying the hydrophilicity at low concentrations and generating pore constriction at high concentrations. On the other hand, BSA organize a dense irreversible fouling in the first minutes of filtration containing a quantity equivalent to more than 45 monolayers, leading to pore blocking and pore constriction. This structure is resistant to rinsing and NaOH cleaning. Then a reversible fouling, containing a quantity equivalent to more than 90 monolayers is settled. The above structure can be removed with an intensive water rinsing and corresponds to a rather porous cake leading to a low resistance to water permeation, whereas the intermediate structure can only be removed with chemical cleaning and has a higher impact on water permeation.
The original approach detailed in this paper allowed to go deeper in the understanding of the membrane fouling by soft matter, not detailed in previous papers.
HIGHLIGHTS
The microfiltration of two biomolecules, glutathione and Bovine Serum Albumin, was carried out and compared to adsorption isotherms of the same compounds in static and dynamic conditions.
Flux analyses and local quantification of biomolecules on the membrane by Infra Red spectroscopy before and after membrane cleaning were associated to the results from isotherms to elucidate the membrane fouling structure.
BSA filtration leads to pore constriction, pore blocking and cake formation whereas glutathione leads to adsorption and pore constriction.
120µg cm-2 of glutathione accumulated on the membrane has no effect on the flux whereas 108µg cm-2 of BSA generates 44% of flux decline.
A mass of protein equivalent to 165 monolayers accumulates on the membrane during the filtration of a BSA solution at 6g.L-1. After membrane cleaning, the irreversible fouling still corresponds to more than 45 monolayers.
KEYWORDS
1. I
NTRODUCTION
Porous membrane fouling occurs for example during water treatment (tap water production, wastewater or industrial effluent treatment, grey water recycling), filtration of complex media from food industry (milk, fruit juice, fermentation broth etc.) or fractionation of valuable bioresources during downstream processing. Membrane fouling is a complex mechanism associating accumulation of colloids, mineral and organic matter, and biofilm development (involving micro-organisms). Organic molecules may come from the filtered product and/or excreted by microorganisms (such as proteins and polysaccharides). The objective of this paper is to introduce new insights into the structure of the fouling obtained during the filtration of two biomolecules: the Bovin Serum Albumin (BSA) protein and the peptide Glutathione.
1.1. B
IOMOLECULES FILTRATIONIn the context of protein/peptide filtration, the effect of several parameters has been deeply studied [1]: nature and concentration of the protein/peptide [2-18], membrane molecular weight cut off and physico-chemical properties [2, 9, 14, 19-26], filtration mode (cross-flow or dead-end filtration) but also the physico-chemical environment through the pH and the ionic strength modifying the solute charge and the interactions in the membrane-solvent-solute system [3, 5, 6, 9, 13, 14, 16, 18-20, 27-37].
Two types of proteins have to be distinguished depending on the possible evolution of their structure when comparing native protein in bulk solution and adsorbed protein onto a surface. According to Arai and Norde [38, 39] those keeping their structure despite adsorption are called “hard” proteins whereas those loosing their structure are called “soft” proteins.
It has been stated that the nonpolar surfaces (hydrophobic) destabilize soft proteins like BSA [38-40] and thereby facilitate conformational reorientations leading to strong inter-protein and protein-surface interactions. Additionally it was demonstrated by Bégoin [41], using contact angle measurements and surface tension calculations, that residual irreversible fouling of polyethersulfone (PES) polymeric
membranes by soft soluble proteins of milk are mostly due to hydrophobic interactions.
Depending on the protein, the quaternary structure (association of several monomers into a stable structure without covalent link establishment) can also change with pH and consequently the effective radius of some proteins; the soluble state can therefore significantly depend on their aggregation provoked by pH variations. -lactoglobulin of milk is a typical example as this protein can be either monomer, dimer or octamer, depending on the pH [42].
1.2. BSA
FILTRATIONBSA in its native form at neutral pH is a mixture of both monomer and dimer, with a dimer to monomer ratio of about 5/95 [40]. The stokes radius of the monomer is Rs= 3.5 nm [43]. An increase in BSA radius at acidic pH (below pH = 4) has been reported due to internal electrostatic repulsions [44, 45].
Pujar and Zydney [46] have studied BSA by the Size Exclusion Chromatography and compared the retention in HPLC with that obtained in UF. They propose the use of an effective radius (Reff) to describe the behaviour of the protein useful in SEC as well as in UF. This Reff is calculated with the Stokes radius of the protein, the pH, the ionic strength, but also ratio between the protein radius and the membrane pore radius. Thus Reff is not exactly an intrinsic parameter describing the protein but an apparent value describing its behaviour facing size exclusion. Using this approach, de la Casa et al. [32] calculate the BSA effective radius for a 0.14 µm ceramic MF membrane without any salt addition and drawn that Reff = 3.5 nm at pH=4.9 (IEP) and Reff = 440.9 nm at pH = 7.0; it should be pointed out that increasing the ionic strength would modify these values. This interesting approach allowed to better describe the BSA retention/transmission during filtration of BSA on a 0.14 µm ceramic membrane.
BSA microfiltration was described in numerous papers [14, 31, 47]. In several studies, membrane performances (permeability, retention) have been investigated at different pH but also in different electrostatic conditions (salt concentration). Hydrodynamics can also affect the quantity and the quality of protein adsorption on membranes. Convective forces increase the species accumulation near
the membrane surface [16, 48, 49] whereas shear stress due to high cross-flow velocity would decrease the thickness of the protein layer.
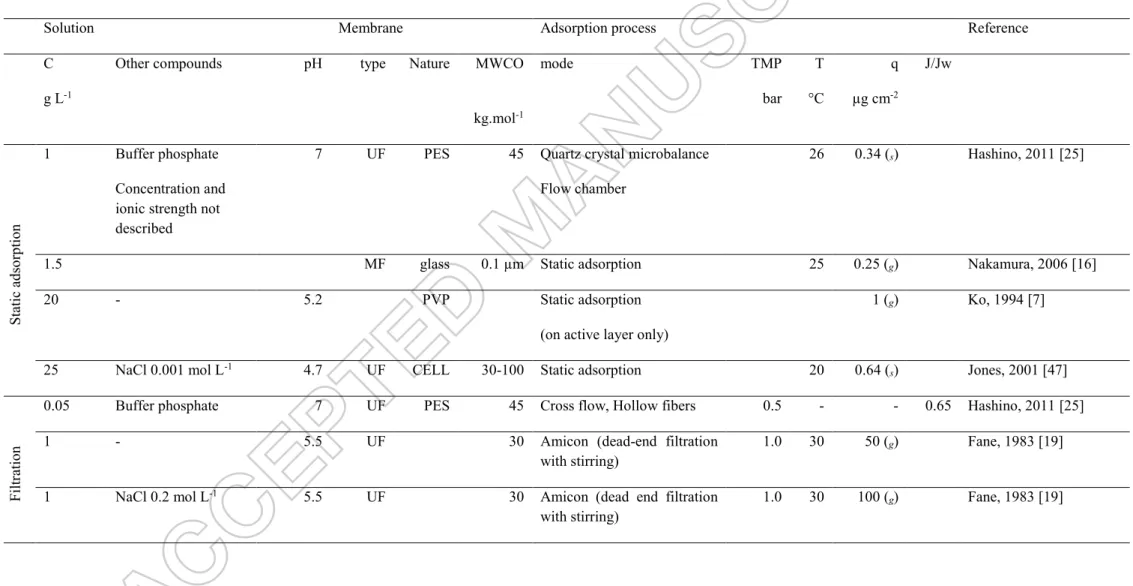
Experimental data of several studies on BSA quantities accumulated at pH = 7 (close to our experimental conditions) on membrane during isothermal adsorption in static conditions or filtrations are listed in Table 1. A large dispersion of experimental values is logically obtained, depending on the membrane (chemical nature, pore size), protein concentration, hydrodynamics, but certainly also due to the precision of the analytical methods. Several authors proposed to quantify BSA in solution with UV analysis after desorption from the membrane by a surfactant added to the solution. The advantage is the simplicity of UV analysis, but the quantification of small amounts of protein is difficult. The quantity of accumulated BSA on the membrane during filtration was estimated between 7 and 165 g m-2 (using geometric membrane area). These values were mostly evaluated during dead-end filtration with stirring experiments.
Table 1: Experimental values of BSA adsorption during static isotherms or filtration tests described in literature.
PES: polyethersulfone; PC Polycarbonate, CELL: regenerated cellulose, PVP: Polyvinylpyrrolidone, PAN: polyacrylonitrile, C: bulk concentration, MWCO: molar weight cut off, TMP: transmembrane pressure, T: temperature, q: mass of BSA per membrane unit surface- (regards to the geometric area of the membrane (g) or the specific area
(s), J/Jw: permeate flux of protein solution / initial permeate water flux ratio
Solution Membrane Adsorption process Reference
C g L-1
Other compounds pH type Nature MWCO
kg.mol-1 mode TMP bar T °C q µg cm-2 J/Jw Static a ds or ptio n 1 Buffer phosphate Concentration and ionic strength not described
7 UF PES 45 Quartz crystal microbalance
Flow chamber
26 0.34 (s) Hashino, 2011 [25]
1.5 MF glass 0.1 µm Static adsorption 25 0.25 (g) Nakamura, 2006 [16]
20 - 5.2 PVP Static adsorption
(on active layer only)
1 (g) Ko, 1994 [7]
25 NaCl 0.001 mol L-1 4.7 UF CELL 30-100 Static adsorption 20 0.64 (
s) Jones, 2001 [47]
Fil
tr
atio
n
0.05 Buffer phosphate 7 UF PES 45 Cross flow, Hollow fibers 0.5 - - 0.65 Hashino, 2011 [25]
1 - 5.5 UF 30 Amicon (dead-end filtration
with stirring)
1.0 30 50 (g) Fane, 1983 [19]
1 NaCl 0.2 mol L-1 5.5 UF 30 Amicon (dead end filtration
with stirring)
1 _ 6.8 MF PC 0.1 µm Dead end filtration without stirring
0.7 25 130 (g) 0.45 Herrero, 1997 [29]
5 - 5.2 PVP filtration (no details) >7 (g) Ko, 1994 [7]
10 _ 6.8 MF PC 0.1 µm Dead end filtration without
stirring
0.7 25 165 (g) - Herrero, 1997 [29]
10 - 7.2 UF PAN 20 Dead end filtration with
stirring
2.0 18 37 (g) Aimar, 1986 [3]
24 - 7.2 UF PAN 20 dead end filtration with
stirring
2.0 18 80(g) Aimar, 1986 [3]
25 NaCl 0.001 mol L-1 4.7 UF CELL 30-100 Amicon (dead end filtration
with stirring)
1.4 20 1 (s)
=10.4 (g)
1.3. M
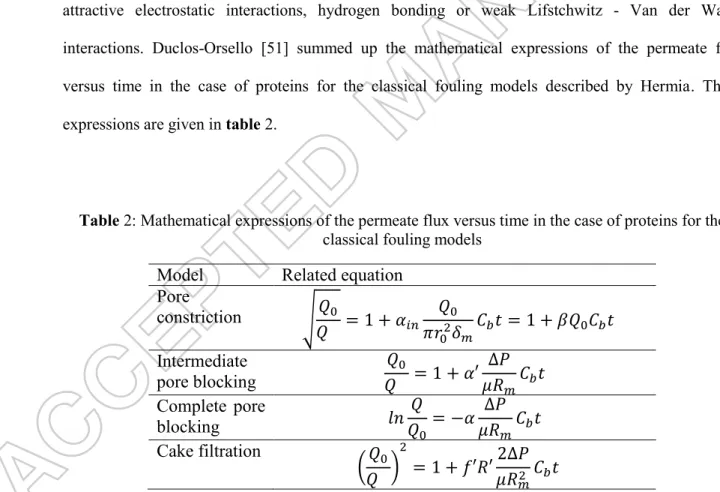
ODELING OF MEMBRANE FOULINGClassic modelling of membrane fouling usually takes into account the following phenomena: adsorption, pore constriction (accumulation of solutes on the external and internal surface, changing membrane hydrophobicity and its pore diameter), partial or total pore blocking (accumulation of particles at the pore entrance, diminishing or blocking access to the pore), cake formation (accumulation of particles on the membrane forming a second porous media) and concentration polarization (rise of solute concentration in the layer near the membrane surface). Hermia [50] proposed equations to model these phenomena in the case of dead-end filtration, and several authors based their analysis on this former work. It should be mentioned that adsorption here is a generic term describing local interactions between membrane material and solute from the bulk, via strong attractive electrostatic interactions, hydrogen bonding or weak Lifstchwitz - Van der Waals interactions. Duclos-Orsello [51] summed up the mathematical expressions of the permeate flux versus time in the case of proteins for the classical fouling models described by Hermia. These expressions are given in table 2.
Table 2: Mathematical expressions of the permeate flux versus time in the case of proteins for the classical fouling models
Model
Related equation
Pore
constriction
√
𝑄
0𝑄
= 1 + 𝛼
𝑖𝑛𝑄
0𝜋𝑟
02𝛿
𝑚𝐶
𝑏𝑡 = 1 + 𝛽𝑄
0𝐶
𝑏𝑡
Intermediate
pore blocking
𝑄
𝑄
0= 1 + 𝛼′
∆𝑃
𝜇𝑅
𝑚𝐶
𝑏𝑡
Complete pore
blocking
𝑙𝑛
𝑄
𝑄
0= −𝛼
∆𝑃
𝜇𝑅
𝑚𝐶
𝑏𝑡
Cake filtration
(
𝑄
0𝑄
)
2= 1 + 𝑓′𝑅′
2∆𝑃
𝜇𝑅
𝑚2𝐶
𝑏𝑡
With Q the permeate flow, Q0 the initial permeate flow, Cb the retentate bulk concentration, µ the viscosity, Rm the membrane
resistance, ∆𝑃 the pressure gradient, 𝛼 and 𝛼′ the area blocked per unit mass of protein aggregates convected to the
membrane surface occupied or not by previous deposition, 𝑓′ the fraction of protein aggregates present in the protein
solution, 𝑅′ the specific protein layer resistance, 𝛼𝑖𝑛 the volume of foulant uniformly deposited in the pore interior per unit
The Hermia model was early used to study protein microfiltration [52]; thereafter the teams of A.L. Zydney and C.C. Ho deepened the modelling to describe the membrane fouling by BSA [51, 53]. The models were progressively enhanced to better fit the experimental results obtained with filtration in Amicon® cells in stirred or unstirred dead end modes. The authors took into account the initial fouling of the membrane adsorption, pore blocking before cake deposition, the inhomogeneity of the cake and the pore constriction. In 2015, Astaraee [54] enriched the model initially proposed by Ho in 2000 [53] attempting to deal with the membrane hydrophobicity. The first deposit layer resistance, and the resistance of the foulant aggregates deposited from the beginning of filtration in the fouled regions of membrane (theoretically determined by the convective flow rate of foulant aggregates to the membrane surface) are two parameters used in the last proposed models. Modified Hermia’s models have also been developed to confirm fouling mechanisms in crossflow filtration [55-57].
1.4. O
BJECTIVESThe objective of this paper was to propose a deepened analyze of a microfiltration membrane fouling by biomolecules. In addition to membrane characterization and a classical analysis of flux decline during filtration based on Hermia’s model [50], it was chosen to compare the mass of accumulated biomolecules on the membrane during filtration to adsorption experiments in static and dynamic conditions. The mass remaining after cleaning operations was also quantified. This comparison allowed confirming the previously supposed fouling mechanisms, but most importantly it allowed quantifying the mass of biomolecules implied in each fouling step, not detailed in previous papers. A well-known protein (Bovine Serum Albumin, 66 kg.mol-1, 583 amino acids) and a peptide: Glutathione (0.307 kg.mol-1, 3 amino acids) were selected. This peptide was rarely described in membrane filtration studies and is interesting because of its antioxidant properties [58-60]. BSA was chosen because it is a soft protein [36]. Though similar interactions (either electrostatic, Van der Waals, hydrogen bonding) as those responsible for BSA adsorption are expected, glutathione has a simpler structure and a lower overall hydrophobicity than that of the protein. This small compound is
supposed to foul the membrane only by pore constriction without any cake formation and pore blocking. That is why the comparison with BSA is interesting. The quantification of accumulated molecules by the Fourier Transform Infra Red spectroscopy in Attenuated Total Reflection mode (ATR-FTIR) was carried on following the methodology developed by Rabiller-Baudry and co-workers [48, 61, 62] after static adsorption and filtration tests.
2. M
ATERIAL AND METHODS
2.1.
P
ROTEIN AND PEPTIDEBovine serum albumin (BSA) and L-Glutathione were supplied by Sigma-Aldrich. The solutions were prepared with milliQ water (see hereafter). Mean pH of the several protein and peptide solutions was 7.0 ± 0.4 (natural pH). In these conditions both BSA and glutathione are negatively charged.
2.2.
M
EMBRANESA microfiltration flat membrane was supplied by KOCH (USA) (MFK-618). According to the provider, the mean pore diameter is 0.1 µm and the membrane is made of PES on polyester. The pristine membrane samples were stocked in glycerol and stored at 4°C. Before use, they were placed in the filtration system, rinsed with water and then cleaned with the following solutions: NaOH, HNO3 and NaOCl following a classical cascade of cleaning protocol. A demineralized water rinsing was carried out before and after each cleaning step. The membranes were then conditioned with an increase of transmembrane pressure from 0 to 2 bar.
After protein or peptide filtration experiments, membrane samples were dried in an oven at 35°C for 48 h and thereafter placed in a desiccator for 24 h prior characterization or protein quantification.
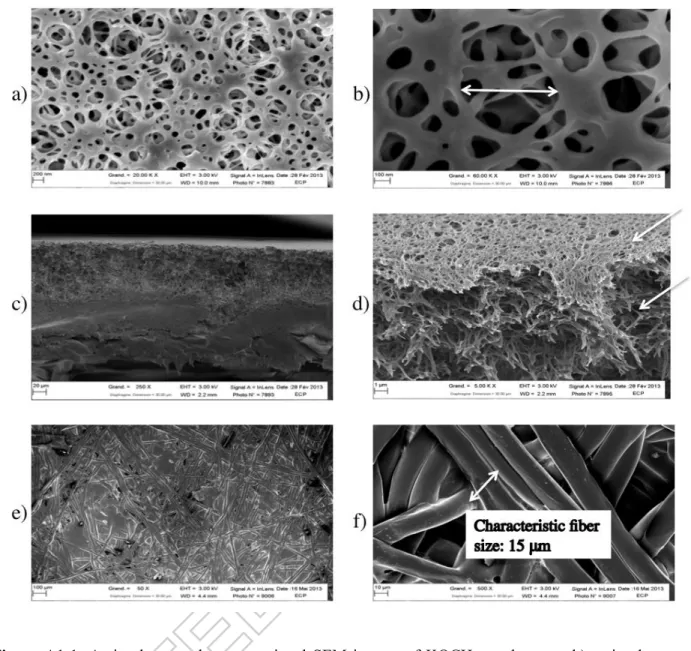
The MFK-618 membrane characterizations performed in this study are detailed in Appendix A1 and the results are summed up in Table 3.
Table 3: Membrane characteristics (KOCH-MFK-618)
SEM: scanning electron microscopy, Hg: intrusion mercury porosimetry KOCH-MFK-618
membrane active layer intermediate layer mechanical support Thickness (μm)
(SEM) 216±2 0.10-0.35 80-100 115-135
Mean pore diameter (μm) 0.39-0.60 (porolux) (Hg) 2.9 (Hg) 88 Pore diameter distribution (μm) - 0.02-0.60 (SEM)
0.06-11 (Hg) 0.06-450
(Hg)
Porosity (%) (Hg) 68.3 (SEM) 30
Fiber diameter (μm) (SEM) - - - 15
2.3.
F
ILTRATION SET UP AND EXPERIMENTSA plate and frame type microfiltration module, PLEIADE Rayflow 100 (Novasep, 7.5×17.2 =129 cm2) and a peristaltic pomp (Watson Marlow 624U) were used for the filtration experiments.
Filtrations experiments were carried out in full recycling mode (retentate and permeate recycled to the feed tank corresponding to a volume reduction ratio VRR equal to 1). In order to determine the evolution of membrane permeability with time, before each experiment, the initial permeability of conditioned membranes was measured by filtering milliQ water over a range of transmembrane pressure of 0.5-1.5 bar.
Then biomolecule solutions (6-12 g L-1 for BSA and 4-12 g L-1 for L-Glutathione) were microfiltered with a velocity close to 0.3 m s-1, transmembrane pressure of 1.00 ±0.05 bar and at room temperature of 22±2 °C. All given permeate fluxes were corrected at 20°C to facilitate comparisons between experiments, considering that the permeate viscosity is that of water. Permeate and retentate fluxes were measured manually and the accuracy was better than 2 %. Filtration experiments lasted 6 h for BSA and 4 h for glutathione solutions. It was previously checked that permeate flux were stable after this filtration times (data not shown). Four experiments with Glutathione 6 g L-1 and BSA 7.5 g L-1 were carried out to verify the flux repeatability and standard deviations for J/J0 were better than 5% (with J0 the reference water flux and J the flux during the protein/peptide MF, respectively).
To evaluate the reversibility of the membrane fouling and identify the different fouling layers (the physically reversible fouling, the hardly attached compounds and the dense adsorbed multilayers) a cleaning protocol was followed after filtration. Water permeability of membranes fouled with Glutathione (6 g L-1)and with BSA (7.5 g L-1) were measured as follows: 1- directly on fouled membranes without significant rinsing, 2-after 30 min water rinsing (allowing to determine the initial physically not reversible fouling amount). Then the membranes were cleaned 30 min with NaOH (0.4 wt%, pH 13) at room temperature (21°C). NaOH was chosen to remove the hardly attached accumulated matter. The residual fouling, called (final) irreversible fouling, is assumed to match with the minimum amount of proteins, which create strong hydrophobic interactions with the membrane and lead to a very cohesive multi-layer build-up on the first adsorbed mono-layer. It has already been demonstrated [61] that these interactions were not all broken during cleaning: it is well known that NaOH is not efficient enough to remove proteins from PES membranes at pH 11.5 and 50°C even after 60 min, ; even if pH 13 can lead to more efficient cleaning, the room temperature lower significantly the chemical hydrolysis in a so short time and thus the removal of fouling species. Experiments were repeated twice.
2.4.
A
DSORPTION ISOTHERMS OF BIOMOLECULESAdsorption isotherms experiments were first carried out in static conditions. Membranes were placed in Erlenmeyer sealed flasks (250 mL on a stirred table,180 rpm, 25 °C) for 24 h. Cleaned membrane pieces (7.5 x 2.5 cm) were brought in contact with 100 mL of protein solutions. The tested biomolecule concentration ranged from 0 to 18 g.L-1 for L-Glutathione and from 0 to 24 g.L-1 for BSA. The biomolecules’ concentrations in solution were determined by UV spectrophotometry at 280 nm [12].
In order to evaluate the hydrodynamic effect on protein adsorption and to prevent the direct access of the biomolecules to the mechanical support of the membrane (like in static conditions), isotherm adsorption experiments were then performed in the microfiltration system. The tested concentrations
were in the range of 0.5 and 7.5 g.L-1 and 0.5-6 g.L-1 for L-Glutathione and BSA, respectively. Protein solutions were pumped to the filtration module without any transmembrane pressure for 24h at room temperature and 0.3 m.s-1.
After filtration and adsorption in static and hydrodynamic conditions, membrane pieces were gently rinsed with milliQ water to remove non-attached proteins and then dried under vacuum at room temperature for 24h. The adsorbed protein's amount was measured by ATR-FTIR allowing the determination of biomolecules only on the active layer side of the membrane.
In order to quantify the mass of protein adsorbed on the membrane surface in the filtration set-up, 129 cm2 membranes were divided into 9 equivalent coupons according to the methodology described by Delaunay et al [48]. The total adsorbed mass was then calculated as the average value of the 9 measurements and bars represent the standard deviation on following figures.
2.5.
QUANTIFICATION OF PROTEIN AND PEPTIDE BYATR-FTIR
The mass of adsorbed biomolecules on the membrane surface was measured directly by ATR-FTIR adapting the protocol established for proteins on PES UF membrane [48] to our study. For this purpose, The ATR-FTIR spectra were registered with a spectrometer PerkinElmer (Spectrum 1000, spectrum for windows software) equipped with a ZnSe crystal with an incidence angle of 45° and 12 reflections. The background spectra were recorded in the air. The conditions of acquisition were as follows: 20 scans, 2 cm-1 resolution. The samples of the pristine and fouled membranes were carefully dried under vacuum before measurements in order to totally remove water (efficiency checked on each spectra in the absorption region 3600-3000 cm-1 where OH bands have their maximum intensity and allowing to conclude that the harmonic of the OH band located at 1660 cm-1 was totally cancelled on the obtained spectra). Because of the penetration depth of the IR beam, it was not possible to distinguish biomolecule adsorbed on the surface or into the pores. Proteins as well as peptides, inside and/or along the membrane surface, can be detected from the amide II bond due to CN + NH vibrations and located in the range of 1520-1550 cm-1. In this work, both BSA and glutathione present
an amide bond located at 1528 cm-1 in a region without any superimposition with any bond due to PES. The amide I bond due to C=O vibration located close to 1650 cm-1 is partly overlapped by a bond of the pristine membranes (probably due to polyvinylpyrrolidone PVP, even if presence of PVP is not clearly mentioned by the membrane provider [63]) and possibly of a small harmonic of water that can exist if the drying is not well controlled. Consequently, this band is less suitable for further quantifications.
In order to take into account the difference in penetration depth of the IR beam in the PES (active and intermediate layers) due to variable thickness of the fouling layer, the quantification is based on the height ratio defined as:
(1)
Where H1528 is the peak height of the bond located close to the wavelength of the protein amide II vibration and H1240 is the peak height of the band located at 1240 cm-1 due to O vibration of the C-O-C ether group of PES considered as internal standard.
The baseline was taken in the wavenumber range of 2129-2262 cm-1 for which there is no specific absorbance on the spectra. Finally, quantification was possible according to the following expression:
(2)
Where Hbaseline is the average height of the baseline in the chosen range of wavenumber, corresponding to non-specific absorbance of the membrane as commonly observed, q is the quantity of protein adsorbed on the membrane (express in microgram of protein per membrane geometric area, μg cm-2, with an accuracy close to 3% in both case) and a and b are constants specific to each couple (membrane- biomolecule) studied. Calibration curves obtained from standards prepared by adsorption of the biomolecules without any pressure applied on the membrane were determined for BSA et Gluthatione are described in Appendix A-2.
Heigth ratio
=
H
1528
3. R
ESULTS
3.1. F
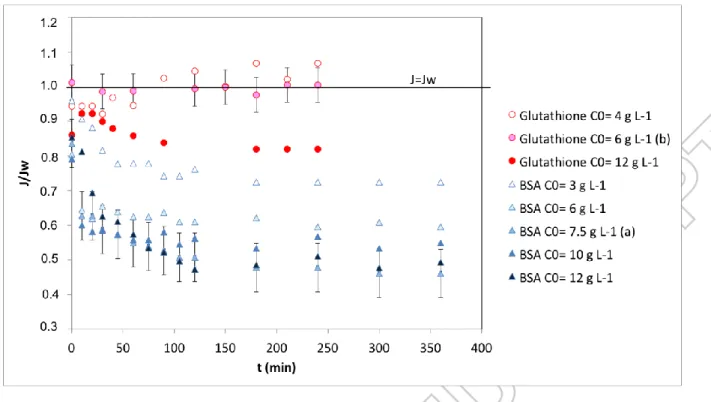
LUX DECLINE PRESENTATION AND ANALYSISThe impact of the accumulation of glutathione and BSA on the flux of permeate through the membrane is presented in figure 1. Each filtration experiment was conducted with a different piece of membrane. Before filtration, the water flux was measured and varied between 104 and 282 L h-1 m-2. To limit the impact of the initial membrane water permeability variation, the ratio between the solution flux and the water flux was presented.
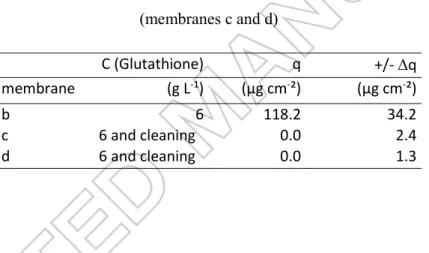
During filtration of glutathione, the flux is enhanced with the peptide at 4 g L-1 and constant at 6 g L-1. This suggests that at low concentration the biomolecule adsorbed on the hydrophobic membrane can enhance the overall hydrophilicity and thus lower the resistance toward water permeation. At higher concentration, the flux decline reaches less than 20%. We can suppose that adsorption and then pore constriction are the main fouling mechanisms that may occur during glutathione filtration. No major steric effect was noticed, which was attempted comparing the size of the molecule and the mean pore diameter of the active layer.
During filtration of BSA, the flux decline rises with increased protein concentration and can reach 50-60% of the initial value. Several mechanisms can be proposed: pore constriction, partial or total pore blocking, cake formation, all build up on a first adsorbed layer.
According to SEM and porometry measurements, the active layer has pore diameters between 20-600 nm with a mean pore diameter of 400-20-600 nm (table 3). Taking into account the estimated stokes radius of both biomolecules (0.38 nm for Glutathione and 3.5 nm for BSA, respectively). adsorption on the external or internal surface of the membrane should be the main initial mechanism (pore constriction). As already mentioned above, De La Casa et al. [33] showed that BSA can have a
behaviour similar in size exclusion mechanism to a very versatile molecule having an apparent effective radius Reff varying from 3.5 nm at its isoelectric point (pH 4.9), and 440.9 nm at pH 7. In the pH conditions of this study (pH 7 ± 0.4), BSA is therefore partly retained by the membrane. Moreover, BSA may form large aggregates that deposit on the membrane. Thus BSA could progressively build up a cake on the active layer.
To go ahead in the BSA fouling comprehension, and confirm or infirm the possible cake formation, the identification of the most likely mechanisms of membrane fouling by BSA was attempted by the graphical analysis of the equations described by Duclos-Orsello (table 2). The dead-end filtration model was chosen because of the transmembrane pressure was rather high for microfiltration and the velocity used in the filtration module lower than in the examples used in references dealing with crossflow filtration. The results are presented for BSA 12 g L-1 (figure 2). The graph can be divided into three parts: before 30 min, between 30 and 120 min and after 120 min. In each part, the most realistic mechanism was the one with the highest linear regression coefficient. During the first 30 min, the main mechanisms are complete pore blocking and pore constriction (R2>0.95 for both mechanisms). After 30 min, the cake formation becomes preponderant (R2>0.99). After 120 min, the equilibrium is reached and no major flux reduction is noticed.
Moreover, at 3 g L-1, only two parts are present, one before 30-45min with a reduction of the flux, and after 45 min with no major flux reduction (figure 1). Despite no segregation between the different fouling mechanisms could be done in this case (0-45min), we can suppose that the cake formation is limited at low concentrations.
During the graphical analysis according to Hermia’s equations for all the tested concentrations, the regression coefficient differences are very low: < ±0.02 in most of the cases. The relevance of this method to describe fouling mechanisms with soft matter can be therefore put in doubt. However we decided to calculate the equation parameters to compare them to data in the literature.
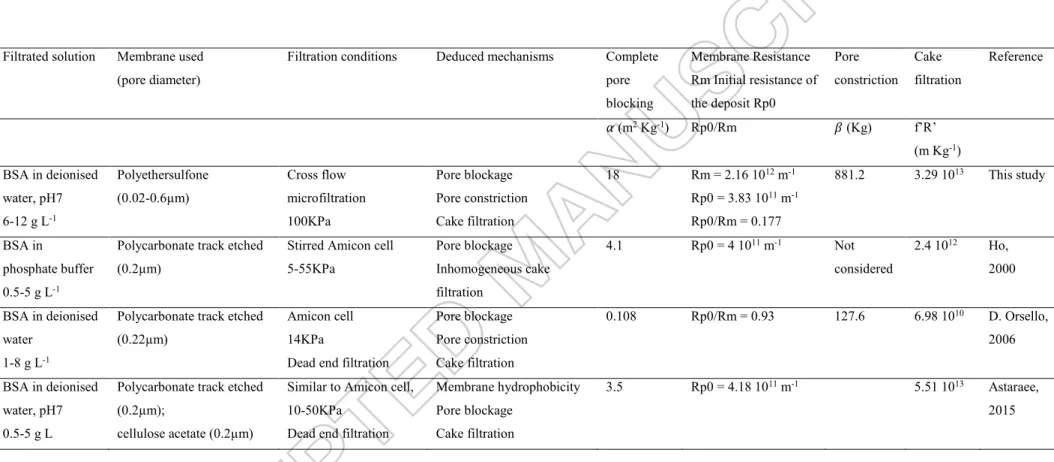
Several parameters that can be deduced from the linear regressions are described in table 4 and compared to the literature. The initial resistance of the first BSA deposit Rp0 has the same value as
those described in previous papers. Pore blocking and the pore constriction parameters (quantity of protein deposited in the porous media per unit of protein filtrated) are higher in our study. The dispersity of the pore diameter that reaches 0.6 µm can explain that a larger quantity of BSA can enter the pores and generate pore blocking or constriction. The resistance of the cake has the same order of magnitude as the ones presented in literature. It is however somehow higher in our case which is consistent with the higher pressure used in the filtration experiments. A similar graphical analysis of the experiments with glutathione 12 g L-1 was carried out. No fouling mechanism could be highlighted.
Our data suggest that the following fouling steps, pore blocking/pore constriction followed by cake filtration, are realistic. But the low differences of the regression coefficients show that the segregation between the mechanisms is not obvious and complementary analysis is needed. These results show that the classical flux modeling is not sufficient to fully describe the membrane fouling with soft matter or organic compounds that present high interactions with the porous media.
In the next paragraphs a complementary quantification of the biomolecules accumulated on the membranes is discussed and is used to confirm the previous mentioned fouling mechanisms.
Figure 1 : membrane A (KOCH) fouling with synthetic solutions of glutathione or BSA at different concentrations (filtration at 1 bar, 0.3 m s-1): relative permeate flux corrected at 20°C versus time of
filtration (min)
Figure 2: Identification of membrane fouling mechanisms during BSA (12 g L-1) filtration, by the graphical analysis of the equations described by Hermia [50] ; the y values depends on the studied
Table 4: Comparison of the parameters of the models used to describe the membrane fouling by BSA
Filtrated solution Membrane used (pore diameter)
Filtration conditions Deduced mechanisms Complete pore blocking Membrane Resistance Rm Initial resistance of the deposit Rp0 Pore constriction Cake filtration Reference 𝛼 (m2 Kg-1) Rp0/Rm 𝛽 (Kg) f’R’ (m Kg-1) BSA in deionised water, pH7 6-12 g L-1 Polyethersulfone (0.02-0.6µm) Cross flow microfiltration 100KPa Pore blockage Pore constriction Cake filtration 18 Rm = 2.16 1012 m-1 Rp0 = 3.83 1011 m-1 Rp0/Rm = 0.177 881.2 3.29 1013 This study BSA in phosphate buffer 0.5-5 g L-1
Polycarbonate track etched (0.2µm)
Stirred Amicon cell 5-55KPa Pore blockage Inhomogeneous cake filtration 4.1 Rp0 = 4 1011 m-1 Not considered 2.4 1012 Ho, 2000 BSA in deionised water 1-8 g L-1
Polycarbonate track etched (0.22µm)
Amicon cell 14KPa
Dead end filtration
Pore blockage Pore constriction Cake filtration 0.108 Rp0/Rm = 0.93 127.6 6.98 1010 D. Orsello, 2006 BSA in deionised water, pH7 0.5-5 g L
Polycarbonate track etched (0.2µm);
cellulose acetate (0.2µm)
Similar to Amicon cell, 10-50KPa
Dead end filtration
Membrane hydrophobicity Pore blockage
Cake filtration
3.5 Rp0 = 4.18 1011 m-1 5.51 1013 Astaraee,
2015
with 𝛼 the area blocked per unit mass of protein aggregates convected to the membrane surface, Rp0 the initial resistance of the deposit, i.e., the resistance associated with a
single protein aggregate, 𝑓′ the fraction of protein aggregates present in the protein solution, 𝑅′ the specific protein layer resistance, 𝛽 a constant depending on 𝛼𝑖𝑛 the volume of foulant uniformly deposited in the pore interior per unit mass of protein filtered through the membrane and 𝜋𝑟02𝛿𝑚 the initial pore volume.
3.2. Q
UANTIFICATION OF BIOMOLECULES3.2.1. ISOTHERMS OF ADSORPTION
Adsorption in static conditions in Erlenmeyer- Glutathione or BSA were adsorbed on membrane
MFK-618 (KOCH). In these experiments the entire membrane material is accessible for the biomolecules, which can adsorb on the active and intermediate layers as well as in the mechanical support. Variations of molecules concentrations in the bulk solutions, thus the amount of adsorbed compound on the membrane, were not measurable by UV spectrometry. ATR-FTIR was then used. Two areas can be used to report the amount of protein adsorbed and to calculate the sorption capacity q: the geometric area of the apparent surface (namely, length x width of the membrane piece) and the specific area of the corresponding whole porous media. First the isotherms were calculated using geometric area, and “apparent isotherms” are presented in figure 3 and figure 4.
From the results, Glutathione apparent isotherm is linear (equation 3) whereas BSA apparent isotherm has a Langmuir-type form. Although the adsorption mechanism is different from the original model, a similar equation form was chosen (equation 4).
Glutathione: 𝑞 = 𝛼𝐺𝑙𝑢𝐶 + 𝛽𝐺𝑙𝑢 (3)
BSA: 𝑞 =𝑞𝐵𝑆𝐴𝑚𝑎𝑥𝐾𝐵𝑆𝐴𝐶
1+𝐾𝐵𝑆𝐴𝐶 (4)
With q the mass of compound adsorbed per membrane apparent surface unit (µg cm-2), C the bulk concentration (g L-1), (106 L.cm-2), (µg cm-2) the linear equation constants for Glutathione, 𝑞𝐵𝑆𝐴𝑚𝑎𝑥 (µg cm-2) and 𝐾𝐵𝑆𝐴 (L g-1) the maximum apparent sorption capacity and the equilibrium
constant for BSA sorption, respectively. Equations parameters are gathered in table 5.
(mass of biomolecule per active layer geometric surface unit)
Protein
Equation
Parameters
Glutathione
𝑞 = 𝛼
𝐺𝑙𝑢𝐶 + 𝛽
𝐺𝑙𝑢𝛼
𝐺𝑙𝑢= 0.199 10
-3m
= 0.0199 cm
𝛽
𝐺𝑙𝑢= - 1.27 10
-1g m
-2= - 12.7 µg cm
-2BSA
𝑞 =
𝑞
𝐵𝑆𝐴 𝑚𝑎𝑥𝐾
𝐵𝑆𝐴𝐶
1 + 𝐾
𝐵𝑆𝐴𝐶
𝑞
𝐵𝑆𝐴𝑚𝑎𝑥= 7.5 g m
-2= 750 µg cm
-2𝐾
𝐵𝑆𝐴= 0.09 10
-3m
3g
-1= 0.09 L g
-1In the range of the bulk concentrations studied, the mass of BSA adsorbed is larger than the one of Glutathione at the same bulk concentration. However the maximum sorption capacity for BSA is lower than the one Glutathione could reach at higher bulk concentrations. Indeed, the amount of this tripeptide is still in a linear part of the isotherm at the studied bulk concentrations.
For a better in-depth analysis, the specific surface of the porous media, constituted of the active layer, intermediate layer and the mechanical support, was estimated from the geometric area of the membrane piece and parameters of membrane characterization. The methodology is the same as the one used for adsorption on active carbon [64]. The specific surface of the active layer is calculated as the apparent surface multiplied by the active layer porosity. The specific surface of the interfacial layer and mechanical support is calculated with the estimated specific area of the two layers together (see appendix, 7.6 m2 g-1)and the mean mass ofmembrane (1.7g for 129 cm2). The ratio between the specific area (cm2) of each layer (AL and IL+MS) and the geometric membrane area (cm2) are respectively 0.7 cm2AL cm-2apparent and 1003.7 cm2IL+MS cm-2apparent. The global specific surface represents 1004.4 cm2 per cm2 of apparent area.
Then specific adsorption laws were deduced from those of apparent adsorption and the calculated specific areas. The specific adsorption of Glutathione and BSA are described in table 6. Adsorption was supposed to be similar on PES and polyester mechanical support.
The maximum specific BSA adsorption 𝑞𝐵𝑆𝐴𝑚𝑎𝑥∗ = 0.75 µg.cm-2 deduced from our experimental
calculation made by Jones et al. [14], estimating that the mass of BSA per unit of specific area in a packed monolayer would be 0.6 µg.cm-2.
Table 6 : specific adsorption laws on membrane MFK-618 (KOCH) (mass of biomolecule per global specific surface unit)
Protein
Equation
parameters
Glutathione
𝑞
∗= 𝛼
𝐺𝑙𝑢∗𝐶 + 𝛽
𝐺𝑙𝑢∗𝛼
𝐺𝑙𝑢∗= 0.199 10
-6m
= 0.199 10
-4cm
𝛽
𝐺𝑙𝑢∗= -1.27 10
-6g m
-2= -1.27 10
-4µg cm
-2BSA
𝑞
∗=
𝑞
𝐵𝑆𝐴 𝑚𝑎𝑥∗𝐾
𝐵𝑆𝐴∗𝐶
1 + 𝐾
𝐵𝑆𝐴∗𝐶
𝑞
𝐵𝑆𝐴𝑚𝑎𝑥∗= 7.5 10
-3g m
-2= 0.75 µg cm
-2𝐾
𝐵𝑆𝐴∗= 0.09 10
-3m
3g
-1Figure 3 : Apparent isotherm adsorption of Glutathione (25°C) on membrane MFK-618 (KOCH) in Erlenmeyers (full circle ) and in filtration module (open circle ) and Glutathione retained on
Figure 4: Apparent isotherm adsorption of BSA (25°C) on membrane MFK-618 (KOCH) in Erlenmeyers (full triangle) and in filtration module (open triangle) and BSA retained on membrane
during filtration (black cross), compared to literature values (squares).
Adsorption in filtration conditions without any applied TMP – Adsorption isotherms in the Rayflow
filtration module with TMP equal to zero were carried out during 24h allowing, a priori, adsorption on the active layer but also some diffusion through the membrane. It should be pointed out that, under these conditions, the intermediate layer and the mechanical support were not directly in contact with the biomolecule solutions. Except TMP, the same hydrodynamic conditions as during filtration were maintained: cross-flow velocity at 0.3 m.s-1. The influence of hydrodynamics was noticed: the protein accumulation on the membrane was not homogenous. The highest amount of adsorbed protein was measured in the lower velocity zones, as described by Delaunay [48].
In the case of Glutathione, the data obtained from adsorption in dynamic conditions without TMP fit very well with the linear apparent isotherm deduced from adsorption in static conditions during immersion of the whole membrane piece in the solution (figure 3). We assume that, in both cases, Glutathione is small enough to penetrate the different layers and adsorb in the porous media in the same manner.
In the case of BSA, the mass adsorbed in dynamic conditions was only 56% of the total mass adsorbed in static conditions at the same bulk concentration. This can be due to the size of the pores limiting BSA diffusion into the porous media, and the crossflow velocity. The intermediate layer and the mechanical support were not accessible, unlike during static experiments. The overall BSA amount adsorbed in dynamic conditions probably represents the fraction of protein adsorbed on the active layer.
3.2.2. FILTRATION
Adsorption during filtration at TMP = 1 bar – Filtrations in full recycling mode were carried out,
during 4 h with Glutathione concentrations at 6 g L-1 or 6h with BSA solutions at 3, 6, 7.5, 10 and 12 g.L-1.
Glutathione adsorption during filtration of 6 g L-1 solution fits completely with data from isotherms developed in the filtration system without TMP. Therefore, no effect of TMP is noticed. The hypothesis of adsorption of the tripeptide is confirmed.
In the case of BSA, the large protein presents an adsorbed mass in the same order of magnitude in the dynamic experiments without any applied TMP and with TMP = 1 bar (figure 4). Additionally, in the range between 6 and 12 g L-1, the maximum adsorbed amount of BSA is reached. As discussed in previous paragraphs (adsorption in dynamic conditions), because of steric effect, a major fraction of BSA is retained outside of the membrane, limiting the accumulation into the intermediate layer and the mechanical support. The convection can also limit the accumulation of BSA on the active layer, balancing the increase of TMP. Results can be compared to those of the literature (table 1). It can be
noticed that our data are in the same order of magnitude as those obtained by Herrero et al [29] on 0.1 µm microfiltration membranes (figure 4). UF experiments show even less adsorption, demonstrating the role of active layer pore diameter in the accumulation of protein on a MF membrane (table 1).
Though the adsorbed quantities of biomolecules are comparable at the equilibrium with a solution at 6 g L-1 (Glutathione, 118 µg cm-2 and BSA, 106 µg cm-2), very different flux decline patterns are determined. This is certainly due to the different involved fouling mechanisms that lead to fouling layers with very different structure and cohesion properties. In order to have a more comprehensive description of the cohesion properties of these fouling layers, their ability to be removed by a gentle cleaning is studied and presented hereafter.
3.3. R
ESULTS OF THE MEMBRANE CLEANINGIn order to evaluate fouling reversibility, which directly depends on the molecule-molecule (cohesion) and the molecule-membrane (attachment strength) interactions, a gentle cleaning procedure was carried out. The objective was to progressively remove the biomolecules and measure its impact on pure water flux and to identify the reversible fouling (physically and chemically) and the irreversible fouling.
First, a short gently rinsing allowed to get rid of the eventual polarization layer. A water cross flow filtration at TMP of 1 bar (intensive water rinsing) was then applied allowing to remove the weakly attached fouling (for example a cake on the active surface, a gel or accumulated matter in the membrane structure), corresponding to the physically reversible fouling.
With UF of milk proteins (32 g L-1), we have already observed that significant gel formation can occur which is build-up on another protein fouling layer, the latter being strongly attached to the membrane. Even if the protein gel is highly cohesive, its attachment to the sublayer of fouling is rather weak and
the gel can be removed by a simple, but quite careful and long, water rinsing. In the present study, BSA was not expected to form gel for the lower filtered concentrations but nothing can be said without any ambiguity for the higher filtered concentrations. No gel formation was supposed to occur with the small glutathione peptide.
Then NaOH cleaning at room temperature allowed the elimination of molecules with stronger interactions (chemically reversible fouling). At the end of the overall cleaning procedure, the first layer of biomolecules directly adsorbed on the surface was supposed to stay on the membrane. In our work, no surfactant was used during the membrane cleaning in order to avoid the destabilization of the fouling cohesion. Each step (short gently rinsing, intensive water rinsing, NaOH cleaning) was followed by a pure water flux measurement to quantify the impact of each fouling layer on the water permeation.
Flux decline with Glutathione was negligible at 6 g L-1 even if fouling was evidenced (118 µg cm-2). Rinsing with water and cleaning with NaOH have evidently no major effect on the flux. The biomolecule quantification before and after cleaning shows that all accumulated Glutathione was removed from the membrane or at least undetectable with the ATR-FTIR technique (table 8). These results confirm that the interaction forces between the fouling layers and perhaps also with the membrane were not really strong.
With BSA at 7.5 g L-1, after 180 min of filtration, flux decline has reached 43-44%, with nearly the same mass of biomolecule adsorbed (124 µg cm-2) as for Glutathione in the previous experiment (table 7 and table 9).
After the short gently water rinsing, the water flux increase but 31-33% of flux decline remained when compared to the initial water flux. When filtrating water after the gently rinsing, the polarization of concentration of BSA in the retentate near the membrane was absent [65], and the less cohesive layer of aggregates should be eliminated. After the intensive water rinsing, supposed to remove the physically reversible fouling, another increase in the water flux was evidenced, but the flux decline was always significant (23-29%). After cleaning with NaOH, allowing the removal of the chemically
reversible attached proteins, 83-84% of the initial water flux was recovered. The coupling of rinsing and cleaning procedures leaded to the elimination of 72% of the adsorbed protein.
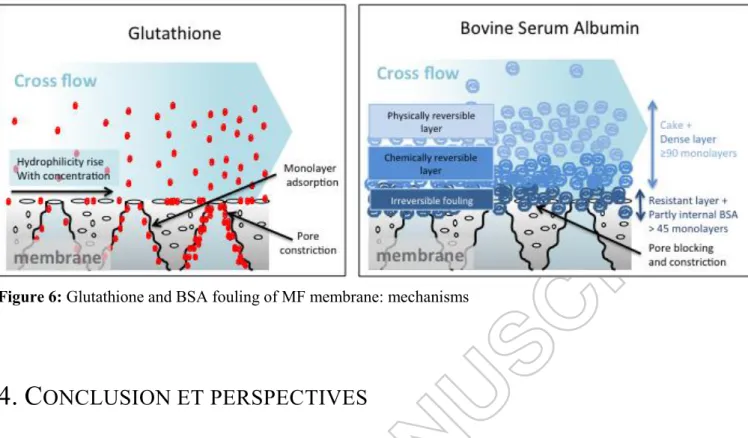
Attribution of the flux decline to concentration polarization, physically reversible fouling, chemically reversible fouling (which needs cleaning operations) and irreversible fouling is described in figure 5. In this figure it is assumed that:
(i) Concentration polarization can be deduced from the comparison between the flux with BSA and after the short gently water rinsing
(ii) Physically reversible fouling can be deduced from the comparison between short gently and intensive water rinsing, corresponding to the cake. This result is fully coherent with the flux analysis (paragraph 3.1).
(iii) Chemically reversible fouling can be drawn from the comparison between flux before and after chemical cleaning by NaOH. This part of the fouling may correspond to a more cohesive part of the cake or a dense intermediate layer between the cake and the first layer of proteins. It could correspond to a fraction of the first fouling mechanisms identified during flux analysis: the pore constriction and pore blocking.
(iv) Irreversible fouling remained at the end of the chemical cleaning and could correspond to adsorbed molecules with strong hydrophobic interactions and the remaining pore blocking.
` Table 7: Membrane fouling with synthetic solutions of BSA at different concentrations during filtration at 1bar, 0,3m s-1: clean membrane water flux (Jw), permeate flux during filtration of protein solution (J), water flux with fouled membrane (Jw-f), after 30 min of water rinsing (Jw-r) and after 30
BSA J (L h-1 m-2, 20°C) 3 g L-1 6 g L-1 7.5 g L-1 (a) 7.5 g L-1 (b) 7.5 g L-1 (c) 7.5 g L-1 (d) 10 g L-1 12 g L-1 Jw (L h-1 m-2, 20°C) 169 171.3 183.2 282.7 143.1 114.5 139.4 166.5 J (t= 0 min) 162.3 137.9 153.2 229.9 125.4 102.2 110.3 141.4 J (t= 180 min) 122.6 106.6 87.5 139.3 81.7 64.5 74.3 74.3 Jw-f with fouled membrane - - - - 98.5 76.6 - - Jw-r after rincing 30min - - - - 110.3 81.1 - - Jw-c after cleaning 30min - - - - 119.9 95.1 - -
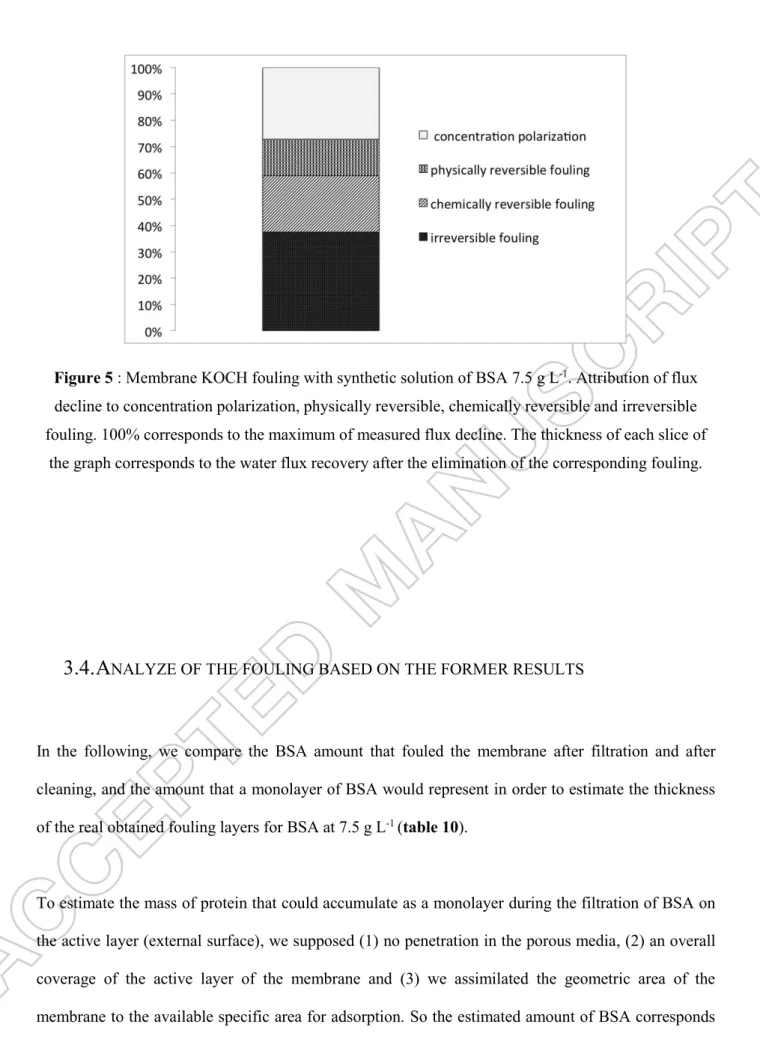
Table 8 : Membrane fouling with synthetic solutions Glutathione (6 g L-1) during filtration at 1bar, 0,3m s-1: mass of protein adsorbed on membrane after fouling (membrane b) and after cleaning
(membranes c and d) C (Glutathione) q +/- q membrane (g L-1) (µg cm-²) (µg cm-²) b 6 118.2 34.2 c 6 and cleaning 0.0 2.4 d 6 and cleaning 0.0 1.3
Table 9 : Membrane fouling with synthetic solutions BSA (7.5 g L-1) during filtration at 1bar, 0,3m s -1: mass of protein adsorbed on membrane after fouling (membrane b) and after cleaning (membranes c and d) C (BSA) q +/- q membrane (g L-1) (µg cm-²) (µg cm-²) b 7.5 123.6 14.2 c 7.5 and cleaning 54.7 8.4 d 7.5 and cleaning 13.1 3.4
Figure 5 : Membrane KOCH fouling with synthetic solution of BSA 7.5 g L-1. Attribution of flux decline to concentration polarization, physically reversible, chemically reversible and irreversible fouling. 100% corresponds to the maximum of measured flux decline. The thickness of each slice of
the graph corresponds to the water flux recovery after the elimination of the corresponding fouling.
3.4. A
NALYZE OF THE FOULING BASED ON THE FORMER RESULTSIn the following, we compare the BSA amount that fouled the membrane after filtration and after cleaning, and the amount that a monolayer of BSA would represent in order to estimate the thickness of the real obtained fouling layers for BSA at 7.5 g L-1 (table 10).
To estimate the mass of protein that could accumulate as a monolayer during the filtration of BSA on the active layer (external surface), we supposed (1) no penetration in the porous media, (2) an overall coverage of the active layer of the membrane and (3) we assimilated the geometric area of the membrane to the available specific area for adsorption. So the estimated amount of BSA corresponds to the maximum BSA adsorption 𝑞𝐵𝑆𝐴𝑚𝑎𝑥∗ = 0.75 µg.cm-2.
The amount of BSA accumulated on the membrane during filtration is 165 times more important than the hypothetic monolayer on the active surface, and 17 to 73 times higher after cleaning.
According to these results, even if the effective area was under evaluated, it is evident that the mass of BSA remaining on the membrane after cleaning is not organized as a simple monolayer. Thus, two hypotheses can be raised: 1-the proteins penetrated into a part of the porous media, 2-they organized as a very resistant thicker layer. But, as previously reported (section 3.2), the proteins did not adsorb into the whole porous media.
Most of the physically and chemically reversible fouling contains about 68 µg cm-2 of BSA. This deposit would be equivalent to 92 monolayers of 0.75 µg cm-2. If we consider that the thickness of one layer is approximately twice the radius of the protein, and considering the stokes radius (3.5 nm) or the effective radius (440.9 nm, [33]), the thickness of the deposit can be estimated between 0,64 µm and 81 µm, depending on the hydration sphere stability and the reorganisation of the protein that surely occurs [40]. To confirm this estimation, SEM analysis was carried out. But an accurate measurement could not be done due to soft matter deformation. More experiments would be therefore required (such as Atomic Force Microscopy analysis or electronic microscopy in environmental or cryogenic conditions) to verify this point.
The main results of this study are gathered in the figure 6.
Table 10: Comparison of BSA accumulation during filtration to adsorption according the local law and to a compact monolayer on the external active surface (The specific area is assimilated to the
geometric area of the membrane)
q (µg cm-2) Equivalent number of
layers
Hypothetic monolayer 0.75 1
After filtration 123.6 165
Figure 6: Glutathione and BSA fouling of MF membrane: mechanisms
4. C
ONCLUSION ET PERSPECTIVES
This paper aimed at getting a better insight into membrane fouling and, in particular, local organisation of biomolecules through the application of complementary methodologies: flux analysis and local quantification of the accumulated matter on the membrane by ATR-FTIR. Two biomolecules were filtrated: Bovine Serum Albumin and Glutathione. Adsorption isotherms were compared to filtrations.
It was shown that the classical flux modeling approach is not sufficient to fully describe membrane fouling with soft matter. It was demonstrated that the same quantity of accumulated biomolecules on the apparent membrane area can generate totally different flux declines because of different fouling by the biomolecules. On the one hand, Glutathione can adsorb in the whole porous media of the membrane, penetrating through the pores, modifying the hydrophilicity at low concentrations and generating pore constriction at high concentrations. On the other hand, BSA organize a dense irreversible fouling in the first minutes of filtration containing a quantity equivalent to more than 45 monolayers, leading to pore blocking and pore constriction. This structure is resistant to rinsing and NaOH cleaning. Then a reversible fouling, containing a quantity equivalent to more than 90 monolayers is settled. The above structure can be removed with an intensive water rinsing and corresponds to a rather porous cake leading to a low resistance to water permeation, whereas the
intermediate structure can only be removed with chemical cleaning and has a higher impact on water permeation.
The results of this work will be helpful to go further into the local description of membrane fouling during fractionation of complex mixtures containing biomolecules in water treatment, food industry but also for the valorization of new bioressources like microalgae for food, feed and health applications.
Acknowledgments: This work was supported by the Carnot Institute Centrale Supelec Science des Systèmes (C3S)
5. R
EFERENCES
[1] M. Rabiller-Baudry, Fractionnement de protéines en milieu modèle: mécanismes impliqués en ultrafiltration, in: C.F.d. Membranes (Ed.) Séminaire Fractionnement en milieu aqueux, Paris, 2013. [2] E. Matthiasson, The role of macromolecular adsorption in fouling of ultrafiltration membranes, Journal of Membrane Science, 16 (1983) 23-36.
[3] P. Aimar, S. Baklouti, V. Sanchez, Membrane- solute interactions: influence on pure solvent transfer during ultrafiltration, Journal of Membrane Science, 29 (1986) 207-224.
[4] J.L. Nilsson, Fouling of an ultrafiltration membrane by a dissolved whey protein concentrate and some whey proteins, Journal of Membrane Science, 36 (1988) 147-160.
[5] M. Nyström, Fouling of unmodified and modified polysulfone ultrafiltration membranes by ovalbumin, Journal of Membrane Science, 44 (1989) 183-196.
[6] H.D.W. Roesink, M.A.M. Beerlage, W. Potman, T. van den Boomgaard, M.H.V. Mulder, C.A. Smolders, Characterization of new membrane materials by means of fouling experiments Adsorption of bsa on polyetherimide—polyvinylpyrrolidone membranes, Colloids and Surfaces, 55 (1991) 231-243.
[7] M.K. Ko, K.D. Cole, J. Pellegrino, Determination of total protein adsorbed on solid (membrane) surface by a hydrolysis technique: single protein adsorption, Journal of Membrane Science, 93 (1994) 21-30.
[8] J. Randon, P. Blanc, R. Paterson, Modification of ceramic membrane surfaces using phosphoric acid and alkyl phosphonic acids and its effects on ultrafiltration of BSA protein, Journal of Membrane Science, 98 (1995) 119-129.
[9] S. Fukuzaki, H. Urano, K. Nagata, Adsorption of bovine serum albumin onto metal oxide surfaces, Journal of Fermentation and Bioengineering, 81 (1996) 163-167.
[10] K. Kontturi, M. Vuoristo, Adsorption of globular proteins on polymeric microfiltration membranes, Desalination, 104 (1996) 99-105.
[11] A. Nabe, E. Staude, G. Belfort, Surface modification of polysulfone ultrafiltration membranes and fouling by BSA solutions, Journal of Membrane Science, 133 (1997) 57-72.
[12] J. Jacob, P. Pradanos, J.I. Calvo, A. Hernandez, G. Jonsson, Fouling kinetics and associated dynamics of structural modifications, Colloids and Surfaces A: Physicochemical and Engineering Aspects, 138 (1998) 173-183.
[13] F. Martinez, A. Martin, P. Pradanos, J.I. Calvo, L. Palacio, A. Hernandez, Protein Adsorption and Deposition onto Microfiltration Membranes: The Role of Solute-Solid Interactions, Journal of Colloid and Interface Science, 221 (2000) 254-261.
[14] K.L. Jones, C.R. O'Melia, Protein and humic acid adsorption onto hydrophilic membrane surfaces: effects of pH and ionic strength, Journal of Membrane Science, 165 (2000) 31-46.
[15] K. Nakamura, K. Matsumoto, Adsorption behavior of BSA in microfiltration with porous glass membrane, Journal of Membrane Science, 145 (1998) 119-128.
[16] K. Nakamura, K. Matsumoto, Protein adsorption properties on a microfiltration membrane: A comparison between static and dynamic adsorption methods, Journal of Membrane Science, 285 (2006) 126-136.
[17] X. Li, Y. Zhang, X. Fu, Adsorption of glutamicum onto polysulphone membrane, Separation and Purification Technology, 37 (2004) 187-198.
[18] L. De Angelis, M.M.F. de Cortalezzi, Ceramic membrane filtration of organic compounds: Effect of concentration, pH, and mixtures interactions on fouling, Separation and Purification Technology, 118 (2013) 762-775.
[19] A.G. Fane, C.J.D. Fell, A. Suki, The effect of ph and ionic environment on the ultrafiltration of protein solutions with retentive membranes, Journal of Membrane Science, 16 (1983) 195-210.
[20] W. Senyo Opong, A.L. Zydney, Hydraulic permeability of protein layers deposited during ultrafiltration, Journal of Colloid and Interface Science, 142 (1990) 41.
[21] J.L. Nilsson, Protein fouling of uf membranes: Causes and consequences, Journal of Membrane Science, 52 (1990) 121-142.
[22] S. Mochizuki, A.L. Zydney, Theoretical analysis of pore size distribution effects on membrane transport, Journal of Membrane Science, 82 (1993) 211-227.
[23] H. Yamagishi, J.V. Crivello, G. Belfort, Evaluation of photochemically modified poly (arylsulfone) ultrafiltration membranes, Journal of Membrane Science, 105 (1995) 249-259.
[24] K.-J. Hwang, P.-Y. Sz, Membrane fouling mechanism and concentration effect in cross-flow microfiltration of BSA/dextran mixtures, Chemical Engineering Journal, 166 (2011) 669-677.
[25] M. Hashino, K. Hirami, T. Ishigami, Y. Ohmukai, T. Maruyama, N. Kubota, H. Matsuyama, Effect of kinds of membrane materials on membrane fouling with BSA, Journal of Membrane Science, 384 (2011) 157-165.
[26] R. Jamshidi Gohari, W.J. Lau, T. Matsuura, A.F. Ismail, Effect of surface pattern formation on membrane fouling and its control in phase inversion process, Journal of Membrane Science, 446 (2013) 326-331.
[27] S.P. Palecek, A.L. Zydney, Hydraulic permeability of protein deposits formed during microfiltration: effect of solution pH and ionic strength, Journal of Membrane Science, 95 (1994) 71-81.
[28] S.F. Oppenheim, C.B. Phillips, V.G.J. Rodgers, Analysis of initial protein surface coverage on fouled ultrafiltration membranes, Journal of Colloid and Interface Science, 184 (1996) 639-651. [29] C. Herrero, P. Pradanos, J.I. Calvo, F. Tejerina, A. Hernandez, Flux decline in protein microfiltration: Influence of operative parameters, Journal of Colloid and Interface Science, 187 (1997) 344-351.
[30] L. Palacio, C.C. Ho, P. Pradanos, A. Hernandez, A.L. Zydney, Fouling with protein mixtures in microfiltration: BSA–lysozyme and BSA–pepsin, Journal of Membrane Science, 222 (2003) 41-51.
[31] A. Persson, A.S. Jonsson, G. Zacchi, Transmission of BSA during cross-flow microfiltration: influence of pH and salt concentration, Journal of Membrane Science, 223 (2003) 11-21.
[32] N. Lee, G. Amy, J.P. Croue, H. Buisson, Identification and understanding of fouling in low-pressure membrane (MF/UF) filtration by natural organic matter (NOM), Water Res, 38 (2004) 4511-4523.
[33] E.J. de la Casa, A. Guadix, R. Ibáñez, F. Camacho, E.M. Guadix, A combined fouling model to describe the influence of the electrostatic environment on the cross-flow microfiltration of BSA, Journal of Membrane Science, 318 (2008) 247-254.
[34] H. Mo, K.G. Tay, H.Y. Ng, Fouling of reverse osmosis membrane by protein (BSA): Effects of pH, calcium, magnesium, ionic strength and temperature, Journal of Membrane Science, 315 (2008) 28-35.
[35] Q. Yang, Y. Liu, Y. Li, Control of protein (BSA) fouling in RO system by antiscalants, Journal of Membrane Science, 364 (2010) 372-379.
[36] S. Fakhfakh, S. Baklouti, S. Baklouti, J. Bouaziz, Preparation, characterization and application in BSA solution of silica ceramic membranes, Desalination, 262 (2010) 188-195.
[37] J. Zhang, Z. Cai, W. Cong, Z. Su, F. Ouyang, Mechanisms of protein fouling in microfiltration. II. Adsorption and deposition of proteins on microfiltration membranes, Separation and Purification Technology, 37 (2007) 3039-3051.
[38] T. Arai, W. Norde, The behavior of some model proteins at solid-liquid interfaces 1. Adsorption from single protein solutions, Colloids and Surfaces, 51 (1990) 1-15.
[39] W. Norde, A.C.I. Anusiem, Adsorption, desorption and re-adsorption of proteins on solid surfaces, Colloids and Surfaces, 66 (1992) 73-80.
[40] J. Belmejdoub, M. Rabiller-Baudry, D. Delaunay, G. Gésan-Guiziou, Structural modifications of globular proteins in an ultrafiltration loop as evidenced by intrinsic fluorescence and reverse-phase liquid chromatography, Separation and Purification Technology, 96 (2012) 274-288.
[41] L. Bégoin, Analyse de modules spirales industriels d'ultrafiltration de lait écrémé, in, University Rennes 1, France, 2004.
[42] J. Kinsella, D.M. Whitehead, Proteins in whey: chemical, physical and functional properties, Advances in food and nutrition research, 33 (1989) 343-438.