HAL Id: hal-01632397
https://hal.archives-ouvertes.fr/hal-01632397
Submitted on 20 Oct 2018
HAL is a multi-disciplinary open access
archive for the deposit and dissemination of
sci-entific research documents, whether they are
pub-lished or not. The documents may come from
teaching and research institutions in France or
abroad, or from public or private research centers.
L’archive ouverte pluridisciplinaire HAL, est
destinée au dépôt et à la diffusion de documents
scientifiques de niveau recherche, publiés ou non,
émanant des établissements d’enseignement et de
recherche français ou étrangers, des laboratoires
publics ou privés.
Thermal behavior of apatitic calcium phosphates
synthesized from calcium carbonate and orthophosphoric
acid or potassium dihydrogen orthophosphate
Doan Pham Minh, Marta Galera Martinez, Ange Nzihou, Patrick Sharrock
To cite this version:
Doan Pham Minh, Marta Galera Martinez, Ange Nzihou, Patrick Sharrock. Thermal behavior of
ap-atitic calcium phosphates synthesized from calcium carbonate and orthophosphoric acid or potassium
dihydrogen orthophosphate. Journal of Thermal Analysis and Calorimetry, Springer Verlag, 2013,
112 (3), p. 1145-1155. �10.1007/s10973-012-2695-6�. �hal-01632397�
Thermal behavior of apatitic calcium phosphates synthesized
from calcium carbonate and orthophosphoric acid or potassium
dihydrogen orthophosphate
Doan Pham Minh •Marta Galera Martı´nez•
Ange Nzihou• Patrick Sharrock
Abstract The synthesis of calcium hydroxyapatite powder (Ca-HA) from orthophosphoric acid or from potassium dihydrogen orthophosphate and calcium carbonate was carried out under moderate conditions. A better dissolution of calcium carbonate and a complete precipitation of the orthophosphate species were obtained with orthophosphoric acid, indicating that it may be of interest as a phosphate source compared with potassium dihydrogen orthophos-phate. The influence of calcination treatment on the physico-chemical properties of the solids is discussed in this paper. Different characterization techniques such as specific surface area (SBET), true density, particle size
distribution, thermo-mechanical analysis, simultaneous thermogravimetry and differential scanning calorimetry analysis, X-ray diffraction and infrared were performed to understand the phase changes during thermal treatment. Specific surface area decreased while true density and particle size increased with the rise in the calcination temperature, due to the sintering of particles and the chemical reactions occurring at high temperatures. Mix-tures of well-crystallized Ca-HA and tricalcium phosphate (TCP) or well-crystallized Ca-HA, CaO, and TCP were obtained after calcination at 800–1,000 !C of the solid products starting from orthophosphoric acid or potassium dihydrogen orthophosphate, respectively.
Keywords Apatite! Calcium hydroxyapatite ! Calcium carbonate! Thermal treatment
Introduction
Calcium orthophosphates form a large family of chemical compounds including dicalcium phosphate dihydrate (DCPD, CaHPO4!2H2O); dicalcium phosphate anhydrous (DCPA,
CaHPO4); octacalcium phosphate (Ca8(HPO4)2(PO4)4!5H2O);
b-tricalcium phosphate (b-TCP, Ca3(PO4)2); or calcium
hydroxyapatite (Ca-HA, Ca10(PO4)6(OH)2). In this family,
Ca-HA seems to be the most widely studied, because of its excellent properties, such as biocompatibility, bioactivity, and osteoconductivity [1], and its high-potential application in different fields such as catalysis, heavy metal removal, gas sensors, or chromatography [2].
Generally, low-crystallinity Ca-HA is prepared by the precipitation of calcium cations with orthophosphate anions under mild conditions [3, 4]. In the biomaterials field, low-crystallinity Ca-HA is usually converted into pure and well-crystallized Ca-HA by a calcination step at high temperature [5,6]. Ca-HA used in gas sensors is also treated by a thermal process [7]. In heterogeneous cataly-sis, the activation of Ca-HA usually takes place at high temperature. For example, methane dry reforming was successfully carried out at 600!C into a mixture of CO and H2 over nickel-loaded Ca-HA, which was pre-treated at
800!C [8]. Propane oxidative dehydrogenation into pro-pene was carried out over an iron–Ca-HA catalyst system, in which the conversion of propane and the selectivity of the catalyst strongly depended on the reaction temperature in the range of 350–550!C [9]. Thermal treatment prob-ably leads to a change in the physico-chemical properties of Ca-HA, such as specific surface area, porosity, density,
D. Pham Minh (&) ! M. Galera Martı´nez ! A. Nzihou Universite´ de Toulouse, Mines Albi, CNRS, Centre RAPSODEE, Campus Jarlard, 81013 Albi Cedex 09, France e-mail: doan.phamminh@mines-albi.fr
P. Sharrock
Universite´ de Toulouse, SIMAD, IUT Paul Sabatier, Avenue Georges Pompidou, 81104 Castres, France
particle size, crystallinity, etc. However, this is not always discussed.
In the present study, we report the thermal behavior of apatitic calcium phosphates obtained from calcium car-bonate and orthophosphoric acid or potassium dihydrogen orthophosphate. Calcium carbonate is considered as the most available calcium source. H3PO4 and KH2PO4were
chosen as the most common orthophosphate sources. Understanding the thermal behavior of the synthesized apatitic products allows to anticipate their effective use in high temperature processes such as in heterogeneous catalysis or treatment of polluted gas. Products made with these starting materials showed equivalent reactivity in the removal of lead(II) from an aqueous solution to that obtained with classical Ca-HA produced from water solu-ble precursors of calcium [10].
Experimental
Apatitic calcium phosphates were synthesized by the pre-cipitation of orthophosphate anions in an aqueous solution by adding calcium carbonate powder under ambient con-ditions (ca. 25!C and 1 bar). Calcium carbonate in fine powder form from Fisher Scientific (CaCO3, 98 %) was
used as a calcium source. Orthophosphoric acid (H3PO4,
85 wt% in water, Merck) and potassium dihydrogen orthophosphate (KH2PO4, 99 %, Fisher Scientific) were
used as orthophosphate sources.
For the preparation, 0.6 mol of H3PO4 (SYN-H) or
KH2PO4(SYN-K) and 400 ml of water were fed into 1.2 l
U-form glass reactor (id: 10 cm; length: 15 cm), which was equipped with a vertical stainless steel stirrer. Then, 1.0 mol of CaCO3were progressively added to the
ortho-phosphate solution. The homogeneity of the reaction mixture was assured by a two-blade stirrer inside the reactor vessel which ran at 400 rpm. The reaction mixture was kept for 48 h under stirring. The pH of the reaction mixture was measured using a Mettler–Toledo S20 Sev-enEasy pH-meter. Samples withdrawn at different times from the reactor were filtered on a 0.45lm filter paper to separate liquid and solid phases. The solid was dried overnight at 105!C under air atmosphere and the liquid was acidified with concentrated nitric acid to avoid further precipitation of soluble calcium and orthophosphate ions.
The calcination of the solid was performed in a Nab-ertherm P320 muffle with a heating rate of 10 !C min-1. When the muffle reached the desired temperature in the range of 400–1,000!C, the solid was kept at this temper-ature for 5 h, and then allowed to cool down to room temperature. In parallel, the thermal shrinkage of particle was also followed by thermo-mechanical analysis (TMA,
Setaram Setsys 16/18) with 5 g of constant load on the powder sample under air atmosphere.
In order to investigate the changes due to the thermal treatment, different characterizations and analysis methods were used. Crystal phases were identified using the X-ray diffraction (XRD) technique on a Phillips Panalytical X’pert Pro MPD diffractometer with a Cu Ka(1.543 A˚ ) radiation source and a nickel filter to suppress the Cu Kbray. The texture
and morphology of the particles were analyzed by scanning electron microscopy (SEM) on a Philips XL30 ESEM appa-ratus (FEI). Particle-size distribution was measured by laser scattering in a Mastersizer 2000 (Malvern Instruments Ltd., Malvern, UK) in the range of 0.020–2,000lm. Specific sur-faces areas were measured using the BET method by nitrogen adsorption on a Micrometrics Gemini Vacprep 061. The adsorption–desorption isotherms were measured with a Micrometrics ASAP 2010 using nitrogen as gas adsorbate with the data collection from relative pressure (P/P!) of 0.03–0.99. Simultaneous thermogravimetry and differential scanning calorimetry analysis (TG–DSC) were performed in a TA Instruments SDTQ600 analyzer with a heating rate of 5!C min-1 under air flux (100 mL min-1). Infrared spec-troscopy (IR) was recorded on a Shimadzu FTIR 8400S spectrometer using a sensitive pyroelectric detector with an L-alanine-doped deuterated triglycine sulfate element. True density of the solid powders was measured by helium pyc-nometry using an Accupyc 1330 (Micromeritics).
After acidification with concentrated nitric acid, the liquid fraction was analyzed by inductively coupled plasma atomic emission spectroscopy (ICP-AES) using a HORIBA Jobin–Yvon Ultima 2 for determination of soluble elemental concentration of potassium, phosphorus, and calcium.
Results and discussion
In this section, the solids obtained after 48 h of reaction from the syntheses using orthophosphoric acid and potas-sium dihydrogen orthophosphate are labeled as SYN-H solids and SYN-K solids, respectively. They were either dried at 105!C or calcined at 400–1,000 !C before all further characterizations.
Elemental analysis of the liquid phase
Much work has been done on the synthesis of Ca-HA but most reports did not study the composition of the liquid phase. In other words, the yield of the synthesis process was not calculated, although it was an important parameter to evaluate the performance of the synthesis process.
Table1 shows the quantity of soluble calcium and phosphorus in the liquid phase analyzed by the ICP-AES
technique. In both syntheses, the quantity of initial soluble phosphorus present in the reactor at time zero was 600 mmol. In SYN-H using orthophosphoric acid, soluble orthophosphate species were completely precipitated after 1 h of contact with calcium carbonate at ambient condi-tions. When potassium dihydrogen orthophosphate was used (SYN-K), the precipitation of orthophosphate species was not complete. 241 mmol (or 40 %) of the initial sol-uble phosphorus remained in liquid phase after 48 h of contact. On the other hand, the content of soluble calcium in liquid phase was nearly negligible in both syntheses. This means that most calcium existed in solid phases which could be either precipitates of calcium phosphates or non-dissolved calcium carbonate. Similar results were obtained for the elemental analysis of the solid phase.
TG–DSC analysis
Figure 1 presents the derivative thermogravimetry (DTG) and DSC curves of the solid products obtained after 48 h of reaction and dried at 105!C.
The dried SYN-H solid had different mass losses which corresponded to the following temperature at maximum DTG signals (DTGmax): 55, 112, 233, 419, 679, and 780!C.
The first mass loss at 55!C was generally due to the removal of surface moisture. The next mass losses at 112, 233, and 419!C could be attributed to the thermal decomposition of intermediates such as mono-calcium phosphate monohy-drate (MCPM, Ca(H2PO4)2!H2O), DCPD, and DCPA, which
are usually formed in the synthesis of Ca-HA from the pre-cipitation of orthophosphate anions in similar synthesis conditions [11,12]. The mass loss at 679!C corresponded to the decarbonation of the calcium carbonate remaining in the dried solid product. The final mass loss at 780!C could be attributed to the decarbonation of calcium carbonate-con-taining apatite (CAP) [13,14]. It has been shown that CAP can be formed when the crystallization of Ca-HA takes place in the presence of carbonate anions [15,16].
For the dried SYN-K solid, the removal of surface moisture happened continuously up to ca. 90!C, indicat-ing the possible presence of different types of physical
adsorption of the moisture on the surface of the solid. No mass loss was recorded in the temperature range from 100 to 610!C, except for a weak signal at about 233 !C. This suggests the absence—or the presence at very low con-tent—of intermediates such as MCPM, DCPD, and DCPA in this solid. Two mass losses at 680 and 780!C corre-sponded to the decarbonation of calcium carbonate and CAP, as observed above for SYN-H solid.
For both solids, all thermal transitions were endothermic. As regards the intensity of heat-flow signals, the dehydra-tion step was the most significant. On the other hand, the decarbonation of calcium carbonate was thermally much less significant, although it constituted the greatest mass loss in the range of temperatures investigated.
From the TG curves in the temperature range of 600–700!C, which corresponded to the thermal decompo-sition of calcium carbonate, the content of residual calcium carbonate could be calculated (Table2). Orthophosphoric
Table 1 ICP-AES analysis of calcium and phosphorus in liquid phase
Time/h SYN-H SYN-K
P/mmol Ca/mmol P/mmol Ca/mmol 0 600 1000a 600 1000a
1 0.4 1.3 283 0.6
24 0.3 0.8 257 0.4
48 0.3 0.4 241 0.2
a
Under initial solid powder form of CaCO3
0.3 0.4 0.2 DTG/a.u. Heat flow/ W g –1 DTG/a.u. 0.1 0.0 0 200 400 600 STN-H Temperature/°C 800 1000 –3.0 –2.0 –1.0 0.0 1.0 2.0 3.0 0.3 0.2 0.1 0.0 0 200 400 600 800 1000 –3.0 –2.0 –1.0 0.0 1.0 2.0 3.0 0.4 Temperature/°C Heat flow/ W g –1 Exo up Exo up SYN-K
Fig. 1 DTG and DSC curves in the thermal analysis of the solids obtained after 48 h of reaction and dried at 105!C
acid, with a higher acidity, led to a higher dissolution of calcium carbonate than did potassium dihydrogen ortho-phosphate under similar synthesis conditions.
XRD characterization
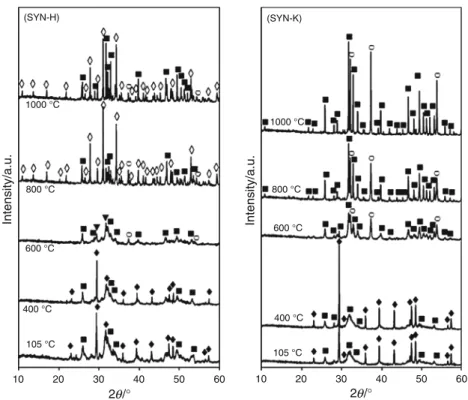
The identification of the crystalline phases using XRD characterization was carried out with the JCPDS database. The calcium carbonate used in this study was pure calcite without the presence of other calcium carbonate phases such as aragonite or vaterite. Figure2 shows the XRD patterns of the solid products dried at 105!C or calcined at different temperatures. For both solids obtained after 48 h of reaction and dried at 105!C, most of the peaks could be attributed to low-crystallinity Ca-HA and crystalline calcite remained after the synthesis. The calcination at 400 !C for 5 h had no influence on the crystalline phase of these solids. When the calcination temperature was increased to 600!C, all residual calcium carbonate decomposed into calcium oxide, and calcium pyrophosphate (Ca2P2O7)
appeared as a new crystalline phase. The formation of calcium pyrophosphate by the condensation of DCPD or DCPA has previously been observed [12, 17]. Calcium oxide was at higher intensity in the solid produced from SYN-K than in the solid coming from SYN-H, which was in accord with TG analysis. At this calcination temperature, Ca-HA seemed still to be of low crystallinity.
At higher temperatures, the behavior of the two solid products notably changed. For SYN-H solid calcined at 800!C, well-crystallized tricalcium phosphate (TCP, Ca/P molar ratio of 1.5) appeared, and Ca-HA became more crystalline. At 1,000!C, the TCP was virtually unchanged in comparison with the solid calcined at 800!C, but well-crystallized Ca-HA was formed. Some trace of calcium oxide remained at both 800 and 1,000!C. These results were in coherence with the elemental analysis. In fact, the solid from the reaction of orthophosphoric acid with cal-cium carbonate had the Ca/P molar ratio of 1.67. The calcination process used in this study did not allow a per-fect homogeneity in the whole solid to totally convert calcium oxide and TCP into a Ca-HA structure.
For SYN-K using KH2PO4 as orthophosphate source,
40 % of initial orthophosphate species remained in the liquid phase (Table1). Therefore, a higher Ca/P molar ratio in the resulting solid product was obtained, which was of 2.78. Thus, well-crystallized Ca-HA was formed at 800 and 1,000!C as the only crystalline calcium phosphate. Calcium oxide remained at high content in this solid because of its high Ca/P molar ratio.
Table 2 Content of calcium carbonate remaining in the solids dried at 105!C
Solid DTGmax/!C Residual CaCO3/wt% SYN-H, dried at 105!C 679 11
SYN-K, dried at 105!C 680 35 DTGmax, temperature at maximum of DTG signals
10 105 °C 105 °C 400 °C 400 °C 600 °C 600 °C 800 °C 800 °C 1000 °C 1000 °C (SYN-H) (SYN-K) 20 30 2 Intensity/a.u. θ/°40 50 60 10 20 302θ/°40 50 60 Intensity/a.u.
Fig. 2 XRD patterns of the solid powders treated at different temperatures; diffraction of: TCP Ca3(PO4)2 (open diamonds); Ca-HA (filled squares); calcium carbonate (filled diamonds); calcium oxide CaO (open circles); calcium pyrophosphate Ca2P2O7(filled down-pointing triangles)
IR analysis
Figure 3 presents the IR spectrum of the initial calcium carbonate used in this study. As expected, five net peaks appeared, at 711, 872, 1389, 1794, and 2512 cm-1, which are the characteristic peaks of calcite [18–20].
Figure4 illustrates the spectra of the solid products dried or calcined at different temperatures, and Table3
summarizes the absorption bands present in Fig.4with the corresponding assignments [12,15,21–23].
In both SYN-H and SYN-K solids, the absorptions at 3,570 and 632 cm-1 of hydroxyl groups in
well-crystallized Ca-HA appeared only at high calcination temperatures in the range of 600–1,000!C, which were in coherence with XRD results.
The residual calcite completely decomposed in the cal-cination temperature range of 600–1,000!C. As expected, the absorption at 711 cm-1, which is one of the principal peaks of calcite (Fig.3), appeared only in the solid dried at 105!C or calcined at 400 !C. Exceptionally, low signals of calcite could also be observed in SYN-K solids after cal-cination at 800 and 1,000!C, which can be explained by the presence of high amounts of CaO in these solids (Fig.2). In contact with free air, trace amounts of calcite were probably formed.
The carbonate group in the CAP structure was charac-terized by the bi-modal peak at 1,454/1,405 cm-1 [15], which was not observed in SYN-H solids. On the other hand, a signal clearly appeared in SYN-K solid dried at 105!C, and its intensity progressively decreased with the increase of the calcination temperature. In fact, after 48 h of reaction, the final pH of the reaction mixture was of 8.4 and 6.8 for SYN-K and SYN-H syntheses, respectively. The concentration of (bi)carbonate anions must be higher in SYN-K than that in SYN-H. Thus, the formation of CAP was more favorable in SYN-K.
The absorption bands of the P2O74- group at 1,218 and
727 cm-1[21] were found only for SYN-H solid calcined at 600!C. The absorption bands of the PO43-group were
found mostly in the ranges 1,100–930 and 570–601 cm-1.
100 95 90 85 80 75 70 4000 3500 3000 2500 2512 (2v2 + v4) 2000 Wavenumber/cm–1 Transmittance/% 1500 1000 500 1794 (v1 + v4) 711 (v4) 872 (v2) 1389 Initial CaCO3 (v3)
Fig. 3 IR spectrum of the initial calcium carbonate used in this study
3600 1500 (SYN-H) 1000 Wavenumber/cm–1 Transmittance/a.u. 550 3600 1500 1000 550 Wavenumber/cm–1 Transmittance/a.u. (SYN-K) 105 °C 105 °C 400 °C 400 °C 600 °C 600 °C 800 °C 800 °C 1000 °C 1000 °C
Fig. 4 IR spectra of the solid products treated at different temperatures
The PO4
3-group present in the Ca-HA structure was char-acterized by the absorptions at 1087, 1032, 962, 601, and 571 cm-1[12], which were found for both H and SYN-K solids. For SYN-SYN-K solids calcined at 600–1,000!C, no other peak of phosphate-based compounds was observed. This again confirmed the results of XRD characterization (Fig.2) that Ca-HA was the only calcium phosphate present in these solids. For SYN-H solids, in addition to the absorption bands mentioned above for the PO43-group in the
Ca-HA structure, there was a peak at 938 cm-1when the calcination temperature was between 800 and 1,000!C, which was attributed to TCP [22].
Specific surface area and true density
The initial calcium carbonate used in this study had a neg-ligible specific surface area (SBET, smaller than 2 m2g-1),
and a true density of 2.68 g cm-3. Figure5 presents the evolution of SBET(continuous lines) and true density (dotted
lines) as functions of the calcination temperature. Despite the lower dissolution of calcium carbonate, the solid product coming from SYN-K using potassium dihydrogen
orthophosphate had an initial SBETof 103 m2g-1, which was
twice as much as that of the solid resulting from SYN-H using orthophosphoric acid (42 m2g-1). Both solids con-tinuously lost their SBET as the calcination temperature
increased. At 1,000!C, their SBETwere very small, as found
in dense non-porous solids.
Both solid products dried at 105!C had a similar true density of 2.84 g cm-3, which was higher than that of the initial CaCO3. In parallel with the reduction of SBET, the
true density of both solids continuously increased. At 400!C, the true density of both SYN-H and SYN-K solids was of 2.93 g cm-3. In the range 600–1,000 !C, SYN-K solids were more compact than SYN-H solids calcined at the same temperature.
The changes in SBET and true density during the
calci-nation step were generally due to the sintering phenome-non, which has already been observed for the apatitic solid synthesized from water soluble calcium salt [24]. Chemical transformation may also contribute to these changes. In order to better understand the thermal effect on the prop-erties of the solids, SEM observation, particle size distri-bution, and TMA were performed.
SEM, particle size distribution, and TMA
Figure6 presents SEM images of SYN-K solids dried or calcined at 105–600!C. The solid dried at 105 !C showed a large range of particle sizes (100lm scale). At higher magnification (5lm scale), the porous structure of the particles was clearly observed, which could provide an explanation for the high SBET of this solid. Some slight
changes could be observed on the surface of the particles after the calcination at 400!C. The surface of particles seemed to be more compact and less porous. At 600!C, the appearance of particles considerably changed. They became much more rounded in comparison with the particles of the solid dried at 105!C. The surface of particles completely changed too, which was probably due to the chemical
trans-Table 3 IR peaks and assigned compounds for the spectra shown in Fig.4 Wavenumber/cm-1 Assignment 3570 OH stretch 632 OH libration 1389, 872, 711 CO32-(calcite) 1454, 1405 CO32-(CAP),m3mode
1218 P2O74-(pyrophosphate), P=O stretch 727 P2O74-(pyrophosphate), P–O–P stretch 1087, 1032 PO43-,m3mode 962 PO43-,m1mode 939 PO43-,m1mode, TCP 601, 571 PO43-,m4mode 100 80 60 40 20 0 0 200 400 600 Temperature/°C SBET /m 2 g –1 True density/g cm –3 800 1000 BET (SYN-H) BET (SYN-K) True density 2.8 2.9 3.0 3.1 3.2 (SYN-H) True density (SYN-K)
Fig. 5 Influence of the calcination temperature on the specific surface area and true density
formations in the mass of the solid, such as the decompo-sition of calcite.
In Fig. 7, the surface of SYN-H solid dried at 105!C seems to be compact, with a high occurrence of particles of sheet-like structure. The latter could be due to the higher content of DCPD and DCPA present in this solid, as found in TG analysis [25–27]. At 400!C, particles of sheet-like structure remained because DCPA decomposed at a higher temperature (about 430!C) [28, 29]. At 600!C, a trans-formation on the surface of particles was also observed, which was related to the chemical reactions, with the dis-appearance of DCPD, DCPA, and calcite, and the forma-tion of calcium pyrophosphate and calcium oxide as new intermediates (Fig.2).
Figure8 presents SEM images of the solids from both SYN-H and SYN-K syntheses, which were calcined at 800 and 1,000!C. The sintering phenomenon was clearly observed, where growing necks merged. At these temper-atures, particles became more rounded and their surface was smoother in comparison with the particles of the solids treated at lower temperatures. The sintering seemed to be more important with SYN-H solid than with SYN-K solid.
This result was probably related to the thermal decompo-sition of CaCO3where released carbon dioxide could form
a layer of gas in the porous structure or in the interparticle pores of the solids, resulting in a decrease in the sintering rate. In addition to the effect of released CO2 gas, the
formation of CaO as solid product of this decarbonation might also slow down the sintering rate, as previously observed for the sintering of silicon carbide [30]. Accord-ingly, the dried SYN-H solid, with lower content of residual calcium carbonate (Table2), sintered more than the dried SYN-K.
For both solids, an increase in particle size was observed when the calcination temperature changed from 800 to 1,000!C. Static laser light scattering was then carried out to better understand the change of the particle size under thermal effect (Fig.9).
The initial calcium carbonate used in this study had the median diameter (d50) of 13.2 and 23.3lm for particle
number and volume size distributions, respectively. For the volume distributions of the SYN-H solids, a wide particle-size distribution was observed in the range of 0.3–500lm. For the solids treated at 105–800!C, three populations of
Fig. 6 SEM images of SYN-K solids treated at 105–600!C
sizes (trimodal peaks) could be clearly observed, which were of approximately 0.3–1, 1–30, and 30–500 lm. The calcination at 1,000 !C mostly eliminated particles smaller than 2.5 lm and a monomodal-like peak appeared in the range of 2.5–300 lm.
Similar results were obtained for the volume distribution of the SYN-K solids. However, the particle-size distribu-tion was found in a narrower range of 0.3–300lm, which was in accord with SEM results. Three populations of sizes of approximately 0.3–1, 1–6, and 6–300 lm were observed. The calcination at 1,000!C also led to the elimination of particles smaller than 1.8lm and a bimodal peak appeared. In all cases, the highest volume fractions were found for the populations of the largest particles (30–500lm for SYN-H and 6–300 lm for SYN-K solids). In contrast with the volume distributions, the number distributions changed completely. At 105–800 !C, mono-modal peaks appeared and more than 95 % of particles
were found in the population of sizes from 0.3 to 1lm. The number of particles larger than 3lm was practically negligible. At 1,000!C, the effect of thermal treatment was distinct with the displacement of the monomodal peaks to the ranges of 2–30lm for SYN-H solid and 1.6–30 lm for SYN-K solid.
The analysis of particle size distribution also showed that, despite a great number of fine particles, their volumes
Fig. 7 SEM images of the solid issue from SYN-H treated at 105–600!C
Fig. 8 SEM images of both solids SYN-H and SYN-K calcined at 800–1,000!C
were modest. Table 4 shows the number and volume accumulations of the solids calcined at 1,000 !C. There were less than 8 % of particles of sizes larger than 10 lm but their volume was higher than 88 %.
In order to quantify the shrinkage/dilatation of the solids under thermal treatment, TMA of both dried SYN-H and SYN-K solids was carried out.
Thermal shrinkage is defined as (L - Lo)/Loor DL/Lo,
where Lois the initial length of sample, and L is the length
of sample measured at temperature T or time t. Figure 10a1, a2 show the non-isothermal TMA curves in the temperature
range of 30–1,000!C, where the solids were heated at the rate of 10!C min-1. For the dried SYN-H solid, some small deformations were observed at the temperatures lower than 800!C. Then, a strong shrinkage started at about 800 !C which must be due to the sintering of the solid, and was in coherence with SEM observation (Fig.8). A shrinkage level of -4.2 % took place from 800 to 1,000!C. In the similar heating conditions, the dried SYN-K solid started to sinter at lower temperature, which was about 640!C, and a much higher shrinkage level of -30.2 % was observed in the temperature range of 640–1,000!C.
Heating of a loose mass generally leads to consolidation or sintering to a denser mass when the temperature reaches a limit. Bailliez and Nzihou [24] graphically illustrated three steps of the sintering process, including the formation and growth of contact areas between adjacent particles; the merging of growing necks and the densification of the solid by destruction of interparticle porosity formed during the second step. In this study, the dried SYN-H solid had the specific surface area (SBET) and the porous volume (Vp),
obtained from adsorption–desorption isotherms, of 42 m2
6 5 105 °C (SYN-H) 400 °C 600 °C 800 °C 1000 °C 4 3 2 1 0 0.1 10 Particle size/ Volume distribution/% m 100 1000 1 µ 6 5 105 °C (SYN-K) 400 °C 600 °C 800 °C 1000 °C 4 3 2 1 0 0.1 10 Particle size/ Volume distribution/% m 100 1000 1 µ 25 20 105 °C (SYN-H) 400 °C 600 °C 800 °C 1000 °C 15 10 5 0 0.1 10 Particle size/ Number distribution/% m 100 1 µ 25 20 (SYN-K) 105 °C 400 °C 600 °C 800 °C 1000 °C 15 10 5 0 0.1 10 Particle size/ Number distribution/% m 100 1 µ
Fig. 9 Influence of the calcination temperatures on the particle-size distributions; x axis value is in logarithm to base 10 scale
Table 4 Comparison of number and volume accumulation of parti-cles for solids calcined at 1,000!C
Solid SYN-H SYN-K
B10lm [10 lm B10 lm [10 lm Number accumulation/% 92.0 8.0 92.8 7.2 Volume accumulation/% 5.3 94.7 11.1 88.9
g-1 and 0.24 cm3 g-1, respectively. Those of the dried SYN-K solid were of 103 m2 g-1 and 0.68 cm3 g-1, respectively. As a function of the calcination temperature, SBET of both solids decreased. After the treatment at
1,000!C, their SBETwere deeply reduced to 2–3 m2g-1,
which are values characteristic for non-porous solid pow-ders. Thus, it can be assumed that the dried SYN-K solid, with higher porosity, had a more important shrinkage under thermal effect, than the dried SYN-H solid. The higher mass loss by decarbonation of residual calcium carbonate present in the dried SYN-K solid also explained its higher shrinkage (Fig.1).
Figure 10b1, b2 present the isothermal TMA curves of SYN-H and SYN-K solids at different temperatures. The initial value at time zero of each curve corresponded to the shrinkage of the sample during the heating step to the desired temperature. The isothermal shrinkage was negli-gible at 400 and 600!C and was much higher at 800 and 1,000!C. After a long isothermal time of 300 min, the shrinkage slightly continued even at 1,000!C. In fact, as observed in Fig.8, both solids were still at the stage of necks merging, meaning that the sintering had not reach the densification step yet.
Conclusions
Calcium carbonate could directly be used as an uncon-ventional source of calcium for the synthesis of apatitic calcium phosphates. Under ambient conditions, the use of orthophosphoric acid showed more advantages than potassium dihydrogen orthophosphate, thanks to a higher dissolution of calcium carbonate and a better precipitation of orthophosphate species. The use of orthophosphoric acid further prevented formation of waste by-products in the final suspension of the synthesis.
For the first time, the thermal behavior of apatitic cal-cium phosphates starting from calcal-cium carbonate was investigated. Thermal treatment strongly influenced the physico-chemical properties of the solids including the reduction of specific surface area and the increase of true density and particle size. This was related to the sintering phenomenon of particles and the chemical transformations in the mass of the solids. At 800–1,000!C, mixtures of well-crystallized Ca-HA and a small amount of TCP (from SYN-H, using orthophosphoric acid) or well-crystallized Ca-HA, CaO, and TCP (from SYN-K, using potassium dihydrogen orthophosphate) were formed.
0 –7 SYN-H (A1) –14 –21 –28 –35 0 200 600 Temperature/°C Shrinkage/% 800 1000 400 0 –7 SYN-K (A2) –14 –21 –28 –35 0 200 600 Temperature/°C Shrinkage/% 800 1000 400 0 –10 SYN-H (B1) –20 –30 –40 0 50 150 Time/min Shrinkage/% 200 250 300 100 400 °C 600 °C 800 °C 1000 °C 0 –10 SYN-K (B2) –20 –30 –40 0 50 150 Time/min Shrinkage/% 200 250 300 100 400 °C 600 °C 800 °C 1000 °C Fig. 10 TMA of the solid
products; a1 and a2: non-isothermal shrinkage (heating rate: 10!C min-1) of the solids dried at 105!C; b1 and b2: isothermal shrinkage (300 min) of the solids dried at 105!C
These results will be considered for our future works on the use of the obtained solid products in high temperature processes including heterogeneous catalysis and treatment of polluted gas.
Acknowledgements The authors gratefully acknowledge the sup-port from Dr. Nathalie Lyczko, Mr. Philippe Accart, Mr. Denis Marty, and Ms. Christine Rolland at the centre RAPSODEE for different measurements.
References
1. Habraken WJEM, Wolke JGC, Jansen JA. Ceramic composites as matrices and scaffolds for drug delivery in tissue engineering. Adv Drug Deliv Rev. 2007;59:234–48.
2. Saha SK, Banerjee A, Banerjee S, Bose S. Synthesis of nano-crystalline hydroxyapatite using surfactant template systems: role of templates in controlling morphology. Mater Sci Eng C. 2009;29:2294–301.
3. Baillez S, Nzihou A, Bernache-Assolant D, Champion E, Shar-rock P. Removal of aqueous lead ions by hydroxyapatites: equilibria and kinetic processes. J Hazard Mater. 2007;A139: 443–6.
4. Bianco A, Cacciotti I, Lombardi M, Montanaro L, Gusmano G. Thermal stability and sintering behaviour of hydroxyapatite nanopowders. J Therm Anal Calorim. 2007;88:237–43. 5. De Campos M, Muller FA, Bressiani AHA, Bressiani JC, Greil P.
Sonochemical synthesis of calcium phosphate powders. J Mater Sci Mater Med. 2007;18:669–75.
6. Zyman ZZ, Tkachenko MV, Polevodin DV. Preparation and characterization of biphasic calcium phosphate ceramics of desired composition. J Mater Sci Mater Med. 2008;19:2819–25. 7. Saeki T. A new type of CO2 gas sensor comprising porous
hydroxyapatite ceramics. Sens Actuators. 1998;15:145–51. 8. Boukha Z, Kacimi M, Pereira MFR, Faria JL, Figueiredo JL,
Ziyad M. Methane dry reforming on Ni loaded hydroxyapatite and fluoroapatite. Appl Catal A. 2007;317:299–309.
9. Khachani M, Kacimi M, Ensuque A, Piquemal JY, Connan C, Bozon-Verduraz F, Ziyad M. Iron–calcium–hydroxyapatite cat-alysts: iron speciation and comparative performances in butan-2-ol conversion and propane oxidative dehydrogenation. Appl Catal A. 2010;388:113–23.
10. Pham Minh D, Sebei H, Nzihou A, Sharrock P. Apatitic calcium phosphates: synthesis, characterization and reactivity in the removal of lead(II) from aqueous solution. Chem Eng J. 2012;198–199:180–90.
11. Kim DW, Cho IS, Kim JY, Jang HL, Han GS, Ryu HS, Shin H, Jung HS, Kim H, Hong KS. Simple large-scale synthesis of hydroxyapatite nanoparticles: in situ observation of crystalliza-tion process. Langmuir. 2010;26:384–8.
12. Elliott JC. Structure and chemistry of the apatites and other calcium orthophosphates. In: Studies in inorganic chemistry, vol 18. Amsterdam: Elsevier; 1994.
13. El Feki H, Khattech I, Jemal M, Rey C. De´composition thermi-que d’hydroxyapatites carbonate´es sode´es. Thermochim Acta. 1994;237:99–110.
14. Toˆnsuaadu K, Peld M, Leskela T, Mannonen R, Niinisto L, Veiderma M. A thermoanalytical study of synthetic carbonate-containing apatites. Thermochim Acta. 1995;256:55–65. 15. Wilson RM, Elliott JC, Dowker SEP, Smith RI. Rietveld structure
refinement of precipitated carbonate apatite using neutron dif-fraction data. Biomaterials. 2004;25:2205–13.
16. Yao F, LeGeros JP, LeGeros RZ. Simultaneous incorporation of carbonate and fluoride in synthetic apatites: effect on crystallo-graphic and physico-chemical properties. Acta Biomater. 2009;5: 2169–77.
17. Landin M, Rowe RC, York P. Particle size effects on the dehy-dration of dicalcium phosphate dihydrate powders. Int J Pharm. 1994;104:271–5.
18. Yog˘urtcuog˘lu E, Uc¸urum M. Surface modification of calcite by wet-stirred ball milling and its properties. Powder Technol. 2011;214:47–53.
19. Vagenas NV, Gatsouli A, Kontoyannis CG. Quantitative analysis of synthetic calcium carbonate polymorphs using FT-IR spec-troscopy. Talanta. 2003;59:831–6.
20. Gunasekaran S, Anbalagan G. Spectroscopic study of phase transitions in natural calcite mineral. Spectrochim Acta. 2008; A69:1246–51.
21. Karlinsey RL, Mackey AC, Walker ER, Frederick KE. Prepara-tion, characterization and in vitro efficacy of an acid-modified b-TCP material for dental hard-tissue remineralization. Acta Biomater. 2010;6:969–78.
22. Coelho PG, Coimbra ME, Ribeiro C, Fancio E, Higa O, Suzuki M, Marincola M. Physico/chemical characterization and preliminary human histology assessment of ab-TCP particulate material for bone augmentation. Mater Sci Eng C. 2009;29:2085–91. 23. Koumoulidis GC, Trapalis CC, Vaimakis TC. Sintering of
hydroxyapatite lath-like powders. J Therm Anal Calorim. 2006; 84:165–74.
24. Bailliez S, Nzihou A. The kinetics of surface area reduction during isothermal sintering of hydroxyapatite adsorbent. Chem Eng J. 2004;98:141–52.
25. Arifuzzaman SM, Rohani S. Experimental study of brushite precipitation. J Cryst Growth. 2004;267:624–34.
26. Stulajterova R, Medvecky L. Effect of calcium ions on trans-formation brushite to hydroxyapatite in aqueous solutions. Col-loids Surf A. 2008;316:104–9.
27. Jinawath S, Sujaridworakun P. Fabrication of porous calcium phosphates. Mater Sci Eng C. 2002;22:41–6.
28. Frost RL, Palmer SJ. Thermal stability of the ‘cave’ mineral brushite CaHPO4!2H2O—mechanism of formation and decom-position. Thermochim Acta. 2011;521:14–7.
29. Mitsionis AI, Vaimakis TC. A calorimetric study of the tem-perature effect on calcium phosphate precipitation. J Therm Anal Calorim. 2010;99:785–9.
30. Zawrah MF, Shaw L. Liquid-phase sintering of SiC in presence of CaO. Ceram Int. 2004;30:721–5.