HAL Id: tel-03098756
https://tel.archives-ouvertes.fr/tel-03098756
Submitted on 5 Jan 2021
HAL is a multi-disciplinary open access
archive for the deposit and dissemination of
sci-entific research documents, whether they are
pub-lished or not. The documents may come from
teaching and research institutions in France or
abroad, or from public or private research centers.
L’archive ouverte pluridisciplinaire HAL, est
destinée au dépôt et à la diffusion de documents
scientifiques de niveau recherche, publiés ou non,
émanant des établissements d’enseignement et de
recherche français ou étrangers, des laboratoires
publics ou privés.
théorie et pratique
Robin Vogel
To cite this version:
Robin Vogel. Ordonnancement par similarité pour la biométrie : théorie et pratique. Machine Learning
[stat.ML]. Institut Polytechnique de Paris, 2020. English. �NNT : 2020IPPAT031�. �tel-03098756�
574
NNT
:2020IPP
A
T031
Similarity Ranking for Biometrics:
Theory and Practice
Th`ese de doctorat de l’Institut Polytechnique de Paris pr´epar´ee `a T´el´ecom Paris ´Ecole doctorale n◦574 math´ematiques Hadamard (EDMH)
Sp´ecialit´e de doctorat : Math´ematiques appliqu´ees Th`ese pr´esent´ee et soutenue `a Palaiseau, le 9 octobre 2020, par
R
OBIN
V
OGEL
Composition du Jury :
Florence d’Alch´e-Buc
Professeure, T´el´ecom Paris Pr´esidente
Marc Sebban
Professeur, Universit´e Jean Monnet Rapporteur
Robert C. Williamson
Professor, Australian National University Rapporteur
Odalric-Ambrym Maillard
Charg´e de recherche, Inria Examinateur
Isabel Valera
Research scientist, Max-Planck Institute Examinatrice
Stephan Cl´emenc¸on
Professeur, T´el´ecom Paris Directeur de th`ese
Aur´elien Bellet
Charg´e de recherche, Inria Co-directeur de th`ese
St´ephane Gentric
Research unit manager, IDEMIA Invit´e
Vincent Despiegel
Contents
1 Summary 15
1.1 Context . . . 15
1.2 Introduction . . . 15
1.3 Recent Challenges in Biometrics . . . 18
1.3.1 Introduction to Biometrics . . . 18
1.3.2 Deep Metric Learning for Biometrics . . . 19
1.3.3 Reliability of Biometrics . . . 20
1.3.4 Thesis outline . . . 22
1.4 Similarity Ranking . . . 23
1.4.1 Similarity Ranking Theory . . . 23
1.4.2 Distributed U -Statistics . . . 25
1.4.3 Practical Similarity Ranking . . . 27
1.5 Reliable Machine Learning . . . 29
1.5.1 Ranking the Most Likely Labels . . . 29
1.5.2 Selection Bias Correction . . . 31
1.5.3 Learning Fair Scoring Functions . . . 32
1.6 Perspectives . . . 34
I
Preliminaries
37
2 Statistical Learning Theory 39 2.1 Introduction . . . 392.2 A Probabilistic Setting for Binary Classification . . . 40
2.3 Uniform Learning Bounds . . . 42
2.3.1 Basic Concentration Inequalities . . . 43
2.3.2 Complexity of Classes of Functions . . . 45
2.3.3 Uniform Generalization Bounds . . . 47
2.4 Faster Learning Bounds . . . 48
2.4.1 Sharper Concentration Inequalities . . . 49
2.4.2 Noise Conditions . . . 49
2.4.3 Distribution-dependent Generalization Bounds . . . 50
2.5 Connections to Present Work . . . 51
3 Selected Ranking Problems 55 3.1 Introduction . . . 55
3.2 Bipartite Ranking . . . 56
3.2.1 Introduction . . . 56
3.2.2 Pointwise ROC Optimization (pROC) . . . 59
3.2.3 Generalization Guarantees for pROC . . . 61
3.2.4 TreeRank . . . 63
3.3 Ranking aggregation . . . 69
3.3.1 Introduction . . . 69
3.3.2 Probabilistic Rankings Models . . . 70
3.4 Connections to Present Work . . . 71 3
4 U-statistics 73
4.1 Introduction . . . 73
4.2 Preliminaries . . . 74
4.3 Properties of Simple U -Statistics . . . 75
4.4 Properties of Incomplete U -Statistics . . . 77
4.5 Connections to Present Work . . . 78
II
Similarity Ranking
79
5 Similarity Ranking Theory 81 5.1 Introduction . . . 815.2 Similarity Ranking . . . 82
5.2.1 Similarity Learning as Pairwise Ranking . . . 82
5.2.2 Connection to Metric Learning . . . 83
5.3 Statistical Guarantees for Generalization . . . 84
5.3.1 Uniform Rates for Pointwise ROC Optimization . . . 85
5.3.2 Fast Rates for Pointwise ROC Optimization . . . 86
5.3.3 Illustration of the Fast Rates . . . 91
5.3.4 Solving Pointwise ROC Optimization . . . 93
5.4 The TreeRank Algorithm for Learning Similarities . . . 93
5.4.1 TreeRank on a Product Space . . . 95
5.4.2 Learning a Symmetric Function . . . 97
5.4.3 Generalization Ability - Rate Bound Analysis . . . 98
5.5 Conclusion . . . 99
6 Distributed U -Statistics 101 6.1 Introduction . . . 101
6.2 Background . . . 102
6.2.1 U -Statistics: Definition and Applications . . . 103
6.2.2 Large-Scale Tuplewise Inference with Incomplete U -statistics . . . 104
6.2.3 Practices in Distributed Data Processing . . . 105
6.3 Distributed Tuplewise Statistical Estimation . . . 105
6.3.1 Naive Strategies . . . 105
6.3.2 Proposed Approach . . . 106
6.3.3 Analysis . . . 107
6.3.4 Extension to Sampling With Replacement . . . 110
6.3.5 Extension to Simple SWOR . . . 113
6.4 Extensions to Stochastic Gradient Descent for ERM . . . 114
6.4.1 Gradient-based Empirical Minimization of U -statistics . . . 114
6.4.2 Repartitioning for Stochastic Gradient Descent . . . 115
6.5 Numerical Results . . . 115
6.6 Conclusion . . . 117
7 Practical Similarity Ranking 119 7.1 Introduction . . . 119
7.2 Practical Algorithms for Pointwise ROC Optimization . . . 121
7.2.1 Exact Resolution for Bilinear Similarities . . . 121
7.2.2 A Gradient-descent Approach for General Similarities . . . 122
7.3 Empirical Evaluation of TreeRank . . . 124
7.3.1 Symmetric Proposal Regions . . . 124
7.3.2 Approaching Continuous Scores with Ranking Forests . . . 125
5 Contents
III
Reliable Machine Learning
129
8 Ranking the Most Likely Labels 131
8.1 Introduction . . . 131
8.2 Preliminaries . . . 133
8.2.1 From Binary to Multiclass Classification . . . 133
8.2.2 Ranking Median Regression . . . 134
8.3 Label Ranking . . . 135
8.3.1 Label Ranking as RMR . . . 135
8.3.2 The OVO Approach to Label Ranking . . . 136
8.3.3 Statistical Guarantees for Label Ranking . . . 137
8.4 Experimental Results . . . 143
8.4.1 Synthetic Data Experiments . . . 143
8.4.2 Real Data Experiments . . . 144
8.5 Conclusion . . . 144
9 Selection Bias Correction 147 9.1 Introduction . . . 147
9.2 Importance Sampling - Risk Minimization with Biased Data . . . 149
9.3 Weighted Empirical Risk Minimization - Generalization Guarantees . . . 152
9.3.1 Statistical Learning from Biased Data in a Stratified Population . . . 152
9.3.2 Positive-Unlabeled Learning . . . 154
9.3.3 Alternative Approach for Positive-Unlabeled Learning . . . 156
9.3.4 Learning from Censored Data . . . 157
9.4 Extension to Iterative WERM . . . 158
9.5 Numerical Experiments . . . 159
9.5.1 Importance of Reweighting for Simple Distributions . . . 159
9.5.2 Generalities on Real Data Experiments . . . 160
9.5.3 Classes Bias Experiment for MNIST . . . 162
9.5.4 Strata Reweighting Experiments for ImageNet . . . 163
9.6 Conclusion . . . 165
10 Learning Fair Scoring Functions 169 10.1 Introduction . . . 169
10.2 Background and Related Work . . . 170
10.2.1 Bipartite Ranking . . . 171
10.2.2 Fairness in Binary Classification . . . 171
10.2.3 Fairness in Ranking . . . 172
10.3 Fair Scoring via AUC Constraints . . . 173
10.3.1 A Family of AUC-based Fairness Definitions . . . 173
10.3.2 Learning Problem and Statistical Guarantees . . . 176
10.3.3 Training Algorithm . . . 179
10.4 Richer ROC-based Fairness Constraints . . . 180
10.4.1 Limitations of AUC-based Constraints . . . 181
10.4.2 Learning with Pointwise ROC-based Fairness Constraints . . . 184
10.4.3 Statistical Guarantees and Training Algorithm . . . 184
10.4.4 Training Algorithm . . . 187
10.5 Experiments . . . 188
10.5.1 Experimental Details . . . 189
10.5.2 Synthetic Data Experiments . . . 189
10.5.3 Real Data Experiments . . . 190
10.6 Conclusion . . . 194
12 R´esum´e (Summary in French) 203
12.1 Contexte . . . 203
12.2 Introduction . . . 203
12.3 D´efis r´ecents en biom´etrie . . . 205
12.3.1 Introduction `a la biom´etrie . . . 207
12.3.2 Apprentissage profond de m´etriques pour la biom´etrie . . . 208
12.3.3 Fiabilit´e en biom´etrie . . . 209
12.3.4 Plan de la th`ese . . . 211
12.4 Ordonnancement par similarit´e . . . 212
12.4.1 Th´eorie de l’ordonnancement par similarit´e . . . 213
12.4.2 U -statistiques distribu´ees . . . 215
12.4.3 Ordonnancement par similarit´e en pratique . . . 217
12.5 Fiabilit´e en apprentissage automatique . . . 219
12.5.1 Ordonner les labels par probabilit´e . . . 219
12.5.2 Correction des biais de s´election . . . 222
12.5.3 ´Equit´e dans l’apprentissage de fonctions de scoring . . . 223
List of Figures
1.1 NIST FRVT benchmark evaluation of racial bias . . . 21
1.2 Empirical comparison of proposed fair scoring methods . . . 35
2.1 Example distribution for binary classification . . . 41
2.2 Comparison of uniform learning bounds with empirical learning speeds . . . 48
2.3 Comparison of fast learning bounds with empirical learning speeds . . . 52
3.1 ROC curves for different levels of noise . . . 57
3.2 Iterations of the LeafRank algorithm: ROCs and splits . . . 66
3.3 Interpolation of the optimal ROC by a piecewise constant ROC . . . 67
3.4 Description of the TreeRank algorithm . . . 68
5.1 Constraints on the distributions that illustrate fast generalization speeds . . . 92
5.2 Mammen-Tsybakov distributions for different values of the noise parameter . . . 92
5.3 Proposal regions for the illustration of the fast rates . . . 92
5.4 Example distributions for two values of the noise parameter . . . 92
5.5 Boxplot of empirical regrets for different the sample size and noise parameters . . 94
5.6 Empirical generalization speeds for diferent values of the noise parameter . . . . 94
5.7 Oriented binary subtree associated with the output of TreeRank . . . 95
5.8 Recursive combination of simple symmetric splits . . . 98
6.1 Summary of our estimators for distributed U -statistics . . . 107
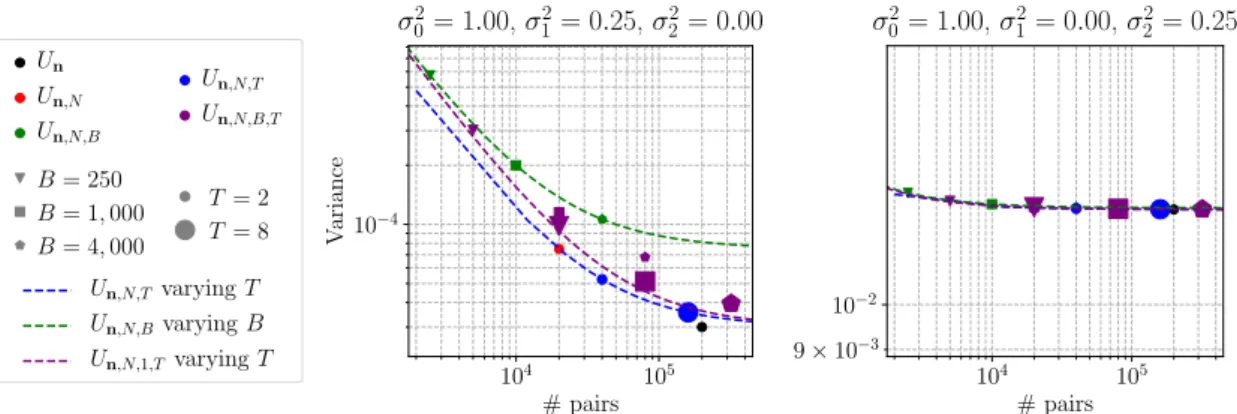
6.2 Variance as a function of the number of pairs for prop-SWOR . . . 110
6.3 Variance as a function of the number of pairs for prop-SWR . . . 113
6.4 Estimated variances as a function of the number of pairs for SWOR . . . 114
6.5 Relative variance of proposed estimators for a simple example . . . 116
6.6 Learning dynamics of SGD for different repartition frequencies . . . 116
7.1 Pointwise ROC optimization for a toy dataset and bilinear similarity . . . 122
7.2 Quarter-circle example sample . . . 123
7.3 Optimal ROCs quarter circle example . . . 123
7.4 Solution of a gradient-based pointwise ROC optimization procedure . . . 124
7.5 Similarity function obtained with TreeRank on a one-dimensional space . . . . 125
7.6 Score value of a ranking forest for a toy example . . . 126
7.7 Optimality of a ranking forests for a toy example . . . 126
8.1 Pseudo-code for One-versus-One label ranking . . . 137
8.2 Representation of the proportion of the classes . . . 144
8.3 Proportion of cycles for increasing sample sizes and different noise parameters . . 145
8.4 Probability of error for increasing sample sizes and different noise parameters . . 145
8.5 Average Kendall’s tau for increasing sample sizes and different noise parameters 145 9.1 Excess risk of optimal solutions for different proportions of positive instances . . 160
9.2 Generated class probabilities for MNIST between train and test . . . 163
9.3 Learning dynamics in class reweighting for the MNIST dataset . . . 163
9.4 Distribution of the ImageNet train dataset over chosen strata . . . 165
9.5 Chosen probabilities of strata between train and test for the ImageNet experiment 165 9.6 Learning dynamics for the linear model and the ImageNet experiment . . . 167
9.7 Learning dynamics for the MLP and the ImageNet experiment . . . 167 10.1 Simple example of the trade-off between ranking accuracy and fairness . . . 190 10.2 Loss with and without AUC-based fairness penalization on a toy dataset . . . 195 10.3 Output score with and without AUC-based penalization on a toy dataset . . . . 195 10.4 ROC curves with and without AUC-based fairness penalization on a toy dataset 195 10.5 Loss with and without ROC-based constraint on a toy dataset . . . 196 10.6 Output score with and without ROC-based fairness penalization on a toy dataset 196 10.7 ROC curves with and without ROC-based fairness penalization on a toy dataset 196 10.8 ROC curves for learning scores with fairness constraints . . . 197
List of Tables
1.1 Summary of notations. . . 17
8.1 Top-k performance for OVO and other approach . . . 146
9.1 Optimal solutions of a split for toy distribution . . . 160
9.2 Number of parameters for the MNIST and ImageNet model . . . 161
9.3 Selected parameters for MNIST and ImageNet experiments . . . 162
9.4 Categories used as strata in the ImageNet experiment . . . 164
9.6 Table of results for the ImageNet experiment . . . 165
9.5 Definitions of the strata of the ImageNet experiment . . . 166
10.1 Proportion of each elementary constraint for usual AUC-based constraints . . . . 176
10.2 Summary of the results for synthetic data experiments . . . 191
10.3 Number of observations and covariates for all datasets . . . 191
10.4 Parameters selected for the real data experiments . . . 192
10.5 Summary of the results for real data experiments . . . 193
List of Publications
• Learning Fair Scoring Functions:
Fairness Definitions, Algorithms and Generalization Bounds for Bipartite Ranking. Authors: Robin Vogel, Aur´elien Bellet, Stephan Cl´emen¸con.
(preprint)
• A Multiclass Classification Approach to Label Ranking. Authors: Stephan Cl´emen¸con, Robin Vogel.
(AISTATS 2020)
• Weighted Empirical Risk Minimization:
Sample Selection Bias Correction based on Importance Sampling.
Authors: Robin Vogel, Mastane Achab, Stephan Cl´emen¸con, Charles Tiller. (ESANN 2020)
• Weighted Empirical Risk Minimization:
Transfer Learning based on Importance Sampling.
Authors: Robin Vogel, Mastane Achab, Stephan Cl´emen¸con, Charles Tiller. (ICMA 2020)
• Trade-offs in Large-Scale Distributed Tuplewise Estimation and Learning. Robin Vogel, Aur´elien Bellet, Stephan Cl´emen¸con, Ons Jelassi, Guillaume Papa. (ECML PKDD 2019)
• On Tree-based Methods for Similarity Learning. Authors: Stephan Cl´emen¸con and Robin Vogel. (LOD 2019)
• A Probabilistic Theory of Supervised Similarity Learning for Pointwise ROC Curve Opti-mization.
Authors: Robin Vogel, Aur´elien Bellet and Stephan Cl´emen¸con. (ICML 2018)
Remerciements
Je tiens ici `a remercier tous ceux qui ont contribu´e au succ`es de ce projet doctoral.
Mes premiers remerciements vont `a mon maˆıtre de th`ese, Stephan, qui m’a guid´e dans mes premiers pas dans le monde de la recherche. Les comp´etences que j’ai acquises pendant ces quatre ann´ees `a T´el´ecom Paris, ainsi que la qualit´e du travail de recherche effectu´e, sont en grande partie le fruit de son enseignement, son soutien et sa direction. Je te remercie particuli`erement pour ta disponibilit´e au quotidien, ainsi que pour ta pr´esence `a des moments inoubliables de ma th`ese. Je remercie aussi tout particuli`erement Aur´elien, qui malgr´e la distance qui nous s´epare a suivi de tr`es pr`es ce projet doctoral, et a ´et´e une force motrice essentielle de ce projet. Je ne peux qu’admirer ta capacit´e et ta d´etermination `a toujours r´e´evaluer avec justesse le travail accompli, et j’esp`ere emporter cette aptitude avec moi pour mes projets futurs. Je n’ai aucun doute qu’elle sera promesse de succ`es, et j’esp`ere l’appliquer d`es que possible sous ton œil averti.
Je remercie St´ephane (avec un e), qui a assur´e la continuit´e du suivi industriel du projet. Par son dynamisme, il a port´e la dimension industrielle de ma th`ese, et m’a enseign´e des comp´etences professionnelles qui ne s’apprennent pas dans les livres, qui me seront sˆurement tr`es utiles `a l’avenir. Je dois aussi saluer ta curiosit´e et ta constance, qui ont ´et´e le moteur de nombreuses r´eunions de suivi.
Finalement, je tiens `a remercier formellement mes sup´erieurs imm´ediats en entreprise, dans l’ordre chronologique: Julien Bohn´e, Anouar Mellakh et Vincent ici pr´esent. Merci Julien pour ton enthousiasme, et pour m’avoir mis le pied `a l’´etrier dans ma premi`ere exp´erience en apprentissage profond dans l’industrie. Merci Anouar pour ta pr´esence rassurante et tes conseils. Vincent, je te remercie pour ta bienveillance et ta curiosit´e, qui je le crois contribuent `a cr´eer un environnement propice au bon d´eroulement d’une th`ese CIFRE. Je vous souhaite `a tous les trois une tr`es bonne continuation dans vos projets professionnels futurs.
Je tiens aussi `a remercier Anne Sabourin, pour m’avoir enseign´e une certaine rigueur scientifique, que ce soit en r´eunion de suivi de th`ese, ou en donnant de ton temps aux tableaux blancs de Rue Barrault. Je ne peux pas nier ta contribution `a ma th`ese, et `a ma formation.
I want to thank Marc Sebban and Robert Williamson, for having reviewed the thesis. Their advice contributed to the quality of the final version of the manuscript, and to the permanent improvement of my writing skills. I also thank Florence d’Alch´e Buc, for teaching me machine learning in the classroom five years ago, as well as for accepting to be the president of my thesis jury today. Last, but not least, I want to thank Oldaric-Ambrym Maillard and Isabel Valera for accepting to join my jury.
Merci aux anciens doctorants (Anna, Albert, Igor, Guillaume P., Nicolas, . . . ) du labo, qui m’auront beaucoup aid´e directement en d´ebut de th`ese, et qui ont ensuite souvent incarn´e un exemple `a suivre.
Merci aux doctorants de “ma promotion” (Hamid, Pierre L., . . . ) pour ces d´ebats anim´es sur des sujets vari´es tels que le sport, les sujets de soci´et´e, la mode, en passant par les math´ematiques. Je remercie particuli`erement Mastane, sans qui l’´ecole d’´et´e `a Buenos Aires n’aurait pas aussi ´et´e ce road-trip l´egendaire. Je retiens ton invitation dans cette ville hispanophone un peu plus
anim´ee que Neuquen.
Merci aux nouveaux doctorants (Pierre C., ´Emile (not on mute), Kimia, Amaury, Guillaume, Anas, Myrto, . . . ) du labo, sans qui ma fin de th`ese n’aurait pas ´et´e la mˆeme. Malgr´e la distance qui nous s´epare du point z´ero, je suis convaincu qu’entre ces murs nous sommes au bon endroit. Merci `a mes coll`egues en entreprise, que ce soit les nouveaux (Baptiste, Arnaud, Damien, Dora, . . . ) et les moins nouveaux (Emine, Jonathan, ´Eric, . . . ). Je serais toujours partant pour un petit afterwork `a la D´efense. Je n’oublie bien sˆur pas Richard, mon “camarade de CIFRE”, auquel je souhaite bon courage pour la derni`ere ligne droite.
Merci `a mes amis pass´es par la th`ese (Yannick, Guillaume C., . . . ), ainsi qu’aux doctorants des quatre coins du monde rencontr´es en ´ecole d’´et´e. Leur authenticit´e m’a permis de mettre ma pro-pre exp´erience en perspective dans les moments difficiles. Leur enthousiasme a ´et´e communicatif. Je tiens `a remercier ma famille et l’ensemble de mes proches, pour leur soutien durant ma th`ese, et plus g´en´eralement durant l’ensemble de mon aventure francilienne.
Chapter 1
Summary
1.1
Context
The thesis originates from a collaboration between the french grande ´ecole T´el´ecom Paris and the multinational company IDEMIA. Precisely, the project relies on a CIFRE contract (Industrial Agreements for Training through Research), a type of contract introduced in 1981 by the french government to strengthen the ties between research institutions and private companies. The research work is thus supervised by both parties, which is made possible in our case by frequent interactions.
T´el´ecom Paris is one of the top French public institutions of higher education and research in engineering in France, and is a member of the Institut Mines-T´el´ecom (IMT) and the Institut Polytechnique de Paris (IP Paris). The IP Paris is a public higher education and research institution, that brings together five prestigious French engineering schools: ´Ecole Polytechnique, ENSTA Paris, ENSAE Paris, T´el´ecom Paris and T´el´ecom SudParis. Under the auspices of the Institute, they share their expertise to develop training programs of excellence and cutting-edge research. The research involved in this thesis was done within the Signal, Statistics and Learning (S2A) team of the Information Processing and Communication Laboratory (LTCI). The academical supervision team consisted of Stephan Cl´emen¸con and Anne Sabourin, both members of the S2A team, as well as Aur´elien Bellet, researcher at INRIA (National Institute for Research in Digital Science and Technology).
IDEMIA is the leading company in biometric identification and security, as well as secure payments. The company is a merger of the companies Morpho and Oberthur Technologies, which was achieved in 2017. Oberthur technologies was a dominant player in digital security solutions for the mobile world, while Morpho was considered the worldwide leader of biometric recognition. IDEMIA has the aim of converging technologies developed for the public sector (by the former Morpho) and those for the private sector (by Oberthur Technologies). In the private sector, the major customers of the company come from banking, telecom and connected objects. The thesis started in 2017 with Safran Identity and Security (formerly Morpho) before the merger, back when Morpho was a subsidiary of the large aeronautics and defense company Safran. Throughout the thesis, St´ephane Gentric assumed the continued industrial supervision of this project. The managers of the Advanced Machine Learning team: sequentially Julien Bohn´e, Anouar Mellakh and Vincent Despiegel, contributed significantly to that supervision.
1.2
Introduction
Biometrics is the discipline of distinguishing individuals based on physical or behavioral attributes such as fingerprints, face, irises and voice. In the modern world, biometrics has many essential applications, such as border crossing, electronic commerce and welfare disbursement. While its mainstream usage is recent, the discipline is not new. Indeed, in the late 19th century, the French law enforcement officer Alphonse Bertillon proposed a personal identification system based on the measurement of specific bony parts of the body (Jain et al., 2011).
Today, the most widespread biometric measurement is fingerprint recognition, followed by face and iris recognition. All of them rely on the acquisition of images of specific parts the body. Hence, while biometrics is seen by many authors as a distinct field of science, its history and development is tightly related with that of computer vision, the interdisciplinary scientific field that seeks to enable computers to gain high-level understanding of digital images.
In the early 2010s, the performance of computer vision systems started to dramatically improve (Goodfellow et al., 2016), due to the development of general-purpose computing on graphical processing units (GPGPU). It enabled the widespread adoption of neural networks — statistical models composed of layers that summarize information — as their training strongly benefits from very fast matrix multiplication. Training neural networks consists in finding the parameters of the network that minimize a loss function with gradient descent algorithms. Those modify iteratively the network parameters, by adding a small quantity that is negatively proportional to the gradient at each step. The growing interest for neural networks has fueled a huge corpus of literature. Most papers propose a better architecture for the model, suggest an improvement of the optimization method or introduce a better loss function for a particular use case.
Recent literature has proposed many loss functions for biometrics, built on the intuition that a more stringent separation of identities in an embedding space leads to improvements in performance (Wang and Deng, 2018). The flagship problem of biometrics is 1:1 verification, which seeks to verify the identity of an individual by comparing a live measurement with reference data using a similarity measure. For example, the entry of an individual to a restricted area can require the conformity of the measurement with a personal identification card. Performance in 1:1 verification is evaluated using the ROC curve, a functional criterion that summarizes the quality of a similarity measure. For a set of tests, the ROC curve gives all false acceptance and false rejection rates attainable by thresholding the similarity. It is the golden standard for evaluating score functions. In the thesis, we argue for using the bipartite ranking literature to design loss functions for 1:1 verification, which is seen as scoring on pairs of observations. While both scoring and pairwise learning are addressed in the literature, their simultaneous examination is new and raises distinct challenges.
The recent dramatic improvements in accuracy of many machine learning applications foreshadow the emergence of new markets, issued from the maturation of formerly very experimental technologies. One such market is facial recognition, which has recorded, and is expected to maintain, exponential growth. Its development brought media coverage about the potential misuses and systemic biases of the technology, on top of the usual privacy concerns. In that context, practitioners and governmental agencies have recorded differences in accuracy between ethnicities in face recognition (Grother and Ngan, 2019). One common explanation is that available face databases for training face recognition systems fail to represent the general population. The performance discrepancy raises the broader issue of fairness, a common concern with automated decisions that has received increasing attention in the recent machine learning literature (Barocas et al., 2019). Some observers commented that predictive algorithms run the risk of being merely “opinions embedded in mathematics”. In their view, practitioners should not focus on predictive performance alone, but also enforce the conformity of their system with a set of moral values. Biometrics is also concerned with fairness. Indeed, even when the representativeness of the training database in terms of gender is accounted for, women still account for more false positives than men, possibly due to societal norms regarding appearance. This may lead to systemic discrimination, notably when considering systems that flag people of interest. In the thesis, we first propose to correct biases using importance weights, which adjusts the distribution of the training data. The correction covers several cases where train and test data do not match, and assumes the availability of auxiliary information about their relationship. The level of generality that we propose is new, and covers many important applications in biometrics. Then, we propose to modify loss functions to incorporate explicitly fairness considerations when learning a score for bipartite ranking. While fairness in classification has received a lot of attention, fair bipartite ranking has not. Considering our scoring perspective on 1:1 verification, this work is an intermediary step to explicitly incorporate fairness constraints in this biometric problem. In general, many issues from the machine learning literature arise simultaneously in the design of biometric systems. The objective of this thesis is to identify and address several of those from the perspective of statistical machine learning, in the hope of providing security guarantees under probabilistic assumptions, and proposing sensible solutions to biometric systems manufacturers.
17 1.2. Introduction Notation Description w.r.t. With respect to s.t. Subject to r.h.s. Right-hand side l.h.s. Left-hand side a.s. Almost-surely r.v. Random variable
i.i.d. Independent and identically distributed c.d.f. Cumulative distribution function p.d.f. Probability density function
:“ Definition of a variable
@ Universal quantifier
X Ñ Y Map ofX to Y
AJ Transpose of the matrix A
H Empty set `n k ˘ Binomial coefficient Sn Permutation of t1, . . . , nu
A Y B (resp. A X B) Set union (resp. intersection) between the sets A and B A∆B Symmetric difference between the sets A and B
#A Cardinal of the set A
Ac Complementary of a set A
PpAq Set of all parts of a set A
Ă Set inclusion
It¨u Indicator function
Impf q Image of the function f
sgnp¨q Sign function, sgnpxq “ 2Itx ě 0u ´ 1 logp¨q Natural logarithm function
Op¨q “Big O“: Asymptotic order of a quantity
Pr¨s Probability of event
Er¨s Expectation of a random variable supppµq Support of the distribution µ
X „ µ The r.v. X follows the distribution µ µ b ν Product measure of µ and ν
δx Dirac mass at point x
s
F Survival function for c.d.f. F , sF “ 1 ´ F F´1 Generalized inverse of a c`adl`ag function N (resp. R) Natural (resp. real) numbers
N˚ “ Nt0u, R`“ tx P R | x ě 0u, R˚`“ R`zt0u Table 1.1: Summary of notations.
In that regard, the usual statistical machine learning literature deals with simple problems, such as classification or regression (Boucheron et al., 2005). However, the problems tackled in biometrics involve both pairwise learning and a functional criterion, and thus require a specific analysis.
Chapter outline. The current chapter summarizes the contributions of the main parts II and III of the thesis, and skips the remaining part (Part I). Part I is in the thesis for clarity reasons and only contains technical preliminaries to the theoretical results of the other parts. The current chapter is organized as follows: firstly, Section 1.3 extends on the ideas presented in the short introduction above and provides a detailed outline for the thesis. Secondly, Section 1.4 focuses on Part II and discusses similarity ranking. Thirdly, Section 1.5 summarizes the contributions of Part III on the broad topic of reliable machine learning. Finally, Section 1.6 details the perspectives of the thesis.
Section 1.3 is a developed introduction that focuses on important aspects of biometrics that are addressed in the machine learning literature. More precisely, it first presents the relationship between biometrics and metric learning, as well as the impact of deep learning on both fields.
It then delves into the nature of bias in facial recognition, and details potential dangers of bias through the lens of algorithmic fairness.
Section 1.4 is a short summary of Part II. It focuses on the idea of considering similarity learning as scoring on a product space. We name this view similarity ranking. In that regard, it begins with theoretical guarantees for that problem. Then, it proposes strategies with guaranteed statistical accuracy to reduce the computational complexity of similarity ranking, and ends with several practical, gradient-based, approaches.
Section 1.5 is a short summary of Part III, which deals with reliability in machine learning. As such, it first proposes a strategy to predict an ordered list of probable classes from multiclass classification data, instead of focusing on classification precision alone. Then, it gives strategies to deal with the lack of representativeness of databases. It ends with a proposal to enforce fairness for the scoring problem.
Section 1.6 presents the perspectives of the thesis. Specifically, it stresses the importance of practical illustrations of this work for biometric practitioners, and discusses several possible extensions of our analyses.
The notations adopted throughout the thesis are summarized in Table 12.1.
1.3
Recent Challenges in Biometrics
The recent advances in deep learning have brought rapid changes to the state-of-the-art in biometrics. In that regard, the new subfield of deep learning metric has proposed many derivable losses, but none of them relate to the ranking-based evaluation of biometrics systems. At the same time, the advances have stirred public debate about biometric technologies, and in particular on face recognition. While most issues concern the usage of facial recognition algorithms, one is its recently-measured racial bias. The machine learning research community can propose technical solutions for that problem.
1.3.1
Introduction to Biometrics
Societal value. Biometrics responds to the need to establish the identity of a person with high confidence. It has become crucial in the modern world, since one interact with an always increasing number of people. However, its roots can be traced as early as the late 19th century, with the first recorded uses of fingerprints for identification (Jain et al., 2011, Section 1.8). Today, biometrics are widely used in forensics and other governmental applications, as well as by various industries, such as the banking sector. One example of large-scale biometrics application is the Aadhaar project, managed by the Unique IDentification Authority of India (UIDAI), which has assigned national identification numbers and recorded the biometrics (irises, faces and fingerprints) of over one billion people (Jain et al., 2011, Section 1.6).
Formal objectives. The objective of biometric systems is to compare two measurements px, x1q in an input space X , e.g. two fingerprints or two faces, and to decide whether both of them originate from the same individual. It is generally done by means of a pairwise similarity function s :X ˆ X Ñ R`, that quantifies the likelihood that x and x1 originate from the same person. The decision is taken by thresholding the similarity value, i.e. the pair px, x1
q is a match if spx, x1q ą t, where t is a threshold in R`. Two flagship problems can be identified in biometrics: verification and identification (Jain et al., 2011, Section 1.3). The verification problem is also referred to as 1:1 matching or 1:1 authentication. It is illustrated by the use case of border crossing, where an official compares a document x1 with a live measurement x. As such, it consists in making a decision on a pair px, x1q. On the other hand, identification is illustrated by the use case of automatic surveillance, where a live measurement x is compared to a database. Precisely, it consists in finding the existence of a match to x in a database of N P N observationsDN “ txiuNi“1 ĂX . If a match exists, it needs to return the relevant elements inDN. Identification is also referred to as 1:N matching or 1:N authentication. The number of enlisted people N can be large, for example in the millions.
19 1.3. Recent Challenges in Biometrics capacity to match quickly low-memory representations of elements inX . It requires the derivation of efficient intermediary representations of the input data. Biometric systems can usually be split in three distinct processes: 1) the acquisition of the input data, called enrollment, 2) the feature extraction, sometimes referred to as the encoding of the data, 3) and the matching of the encodings. See Jain et al. (2011) (Section 1.2) for more details. In the context of fingerprint recognition, the enrollment phase covers the acquisition of the raw input, post-processing steps, as well as quality verifications on the final image. Feature extraction consists in applying usual computer vision techniques, followed by domain-specific techniques to extract specific points in the fingerprint image. For example, Gabor filters (Szeliski, 2011, Section 3.4.1) are used to derive ridge orientation maps (Jain et al., 2011, Chapter 2) from raw fingerprint images. Characteristic points called minutiae are then extracted from that intermediate representation. Finally, matching relies on the evaluation of a distance between the point clouds of two images. We refer to Section 2 of Jain et al. (2011) for more details.
Feature extraction. The module that has received the most attention in biometrics research is the feature extraction module. For example, research in automatic fingerprint recognition has dedicated many man-hours to finding as much discriminative information as possible in the images. In the context of facial recognition, the feature extraction part was first based on EigenFaces (Turk and Pentland, 1991), an application of the principal component analysis (PCA) to natural images of faces. Then, it combined common computer vision descriptors — such as Local Binary Patterns (LBP) and Scale-Invariant Feature Transform (SIFT) image descriptors — with dimensionality reduction techniques. Finally, it now relies on end-to-end — models that perform a task using raw input — deep convolutional neural networks, a type of neural network well suited for images (Wang and Deng, 2018).
Metric learning algorithms serve to train the feature extraction module. Recently, the advent of deep learning algorithms has completely shifted the focus of biometric researchers from a combination of domain-specific feature extraction and linear metric learning, to end-to-end deep metric learning. Researchers in biometrics thus have to follow closely recent developments in machine learning — and especially deep learning — to stay competitive.
1.3.2
Deep Metric Learning for Biometrics
Metric learning or similarity learning is the machine learning problem that that seeks to learns how similar two objects are. We refer to Bellet et al. (2015a) for a survey. In biometrics, the supervision for those algorithms originates from a database of n images txiuni“1 ĂX , with each image xi having an associated identity yiP t1, . . . , Ku with K ď n and pn, Kq P N2.
Linear metric learning. The first metric learning algorithms and a large part of the literature focus on linear metric learning. It refers to distances or similarity functions s :X ˆ X Ñ R` that are linear functions of their inputs. Those mainly rely on the use of a Mahalanobis distance — a distance function Rd
ˆ RdÑ R` for d P N parameterized by a positive semidefinite matrix M P Rdˆd— with a few other linear metric learning methods using other combinations of M and the input x, x1. The Mahalanobis distance d
M between the points x and x1 satisfies: dMpx, x1q “
b
px ´ x1qJM px ´ x1q.
The Cholesky decomposition (Petersen and Pedersen, 2008, Section 5.5.1) implies that one can write M “ LLJ, where L is a lower triangular matrix. This result justifies seeing Mahalanobis distances as computing a simple Euclidean distance over a transformation of the inputs, since dMpx, x1q “kLx ´ Lx1k2, wherek¨k2 is the standard Euclidean distance. Notable approaches for learning Mahalanobis distances include the Mahalanobis Metric for Clustering (MMC) algorithm in 2002 (Xing et al., 2002), the Neighborhood Component Analysis (NCA) algorithm in 2004 (Goldberger et al., 2004), and the Large Margin Nearest Neighbor (LMNN) algorithm in 2009 (Weinberger and Saul, 2009). Several authors have considered the extension of linear metric learning algorithms. For instance, they proposed the kernelization of linear metric learning methods, as well as the use of local linear metrics (Bellet et al., 2015a, Section 5). These extensions turned out to be useful for facial recognition practitioners. For exemple, Bohn´e et al. (2014) considered applying the algorithm MM-LMNN (Weinberger and Saul, 2009), which learns
Deep metric learning (DML). Due to the development of general-purpose computing on graphical processing units (GPGPU), the training and use of very deep neural networks became practical. It has had the effect of dramatically improving the performance of computer vision, notably for the task of large-scale classification on the challenge ILSVRC (ImageNet Large Scale Visual Recognition Challenge). The most salient breakthrough for that challenge happened in 2012 and is presented in Krizhevsky et al. (2012). Results with deep networks led to important advances in face recognition as early as 2014 (Taigman et al., 2014). Deep facial recognition encodes raw data x to a vector epxq, where e :X Ñ Rd is a non-linear function and corresponds to the output of a neural network. Then, a simple distance is computed between epxq and epx1q to decide whether x and x1 match. The encoding e is optimized by gradient descent to minimize a loss function. On the contrary to other popular biometries such as fingerprints and irises, finding manually the important distinctive features of a face is difficult. Therefore, an end-to-end gradient-based approach is very well-suited to face recognition. Still, authors have already proposed deep metric learning approaches for other biometries (Minaee et al., 2019). Loss functions for DML. Deep metric learning has replaced the sequence of hand-crafted features and dimensionality reduction by end-to-end models, as illustrated in the very influential paper of Schroff et al. (2015). Therefore, a lot of research focuses on better network architectures. Simultaneously, the advent of gradient-based learning has paved the way for extensive research in the design of loss functions. Early facial recognition systems used the usual softmax cross-entropy loss, an usual classification loss in deep learning that seeks to separates identities (Goodfellow et al., 2016, Section 3.13). Since then, many other loss functions have been proposed, such as ArcFace (Deng et al., 2019). We refer to Figure 5 of Wang and Deng (2018) for an overview of losses for facial recognition. Their objective is either to: increase the margin between the identities to increase inter-group variance, group all observations of each identity together to decrease intra-group variance, or combine both approaches as does the triplet loss (Schroff et al., 2015). Practicioners have reported that summing different losses, while adjusting the proportion of each loss was necessary to optimize for performance (Parkhi et al., 2015).
Ranking-based evaluation. The performance of facial recognition systems is measured on the ROC curve, as shown in the evaluations of commercial face recognition systems by Grother and Ngan (2019). Those were conducted by the National Institute of Standards and Technology (NIST), an agency of the United States Department of Commerce. The ROC curve is a standard for evaluating scores functions for bipartite ranking, a problem that seeks to assign higher scores to elements associated with a label `1 than to elements with label ´1. We refer to Menon and Williamson (2016) for a survey of bipartite ranking. In that context, similarity functions can be seen as score functions on the product space. That observation suggests that exploring the vast corpus of research on bipartite ranking is a justified approach to find better loss functions for facial recognition, which is what we undertake in both Part II and in Chapter 8 of Part III. Facial recognition has observed rapid improvements in accuracy and does not require the individual to be cooperative. Therefore, the technology has recently gathered attention in the media and in public opinion. On top of the usual privacy concerns, commentators have expressed growing concerns over the possible unreliability or unfairness of facial recognition.
1.3.3
Reliability of Biometrics
The recent advances in facial recognition have confirmed the maturation of the technology, which foreshadows its deployment and has provoked widespread debate about it. Gates (2011) warned about the tendency of the public to extrapolate about the ubiquity of such systems, which creates an illusion of surveillance that changes behavior. However, the technical hurdles enunciated by Gates (2011) seem much weaker today. Precisely, papers such as Schroff et al. (2015) show the ability of facial recognition systems to handle very loosely controlled acquisition conditions. Also, observers have forecasted a compound annual growth rate (CAGR) — i.e. an average geometric progression — of 14.5 % per year between 2020 and 2027 for the global facial recognition market. In that context, the issues regarding the deployment of facial recognition and other machine learning technologies belong to the domain of the legislator, but the decisions of the model are of the responsibility of the machine learning practicioner.
21 1.3. Recent Challenges in Biometrics
Figure 1.1: This graph shows that fixing a threshold for a fixed false positive rate (called False Matching Rate (FMR) in facial recognition) of α “ 10´5on the general population can give higher false positive rate when used on another type of population. Specifically, it gives α “ 10´2.8for the population that originates from Polynesia.
quantified important negative differentials in recognition performance for people of color, with Caucasians as the reference class. Figure 1.1 illustrates that and is extracted from Grother and Ngan (2019). The observation was echoed by many news outlets and referred to as “racial bias” in 2019. The main justification was that the face databases used for the training of such systems are generally composed of European and northern American personalities, which are mostly Caucasians and do not represent the general population. Authors interpreted the observation as an “other-race effect” for automatic face recognition, an idea introduced in Furl et al. (2002) and Phillips et al. (2011), that states that humans generally struggle to recognize ethnicities different from their own. Some authors have presented strategies to correct this specific issue explicitly (Wang et al., 2019). More generally, a broad literature on bias in machine learning can be invoked to tackle that issue (Bolukbasi et al., 2016; Zhao et al., 2017; Hendricks et al., 2018; Liu et al., 2016; Huang et al., 2006). Chapter 9 of Part III contributes to that effort, by providing a general reweighting scheme that addresses usual representativeness problems in biometrics. Limitations of dataset representativeness. While having a database that represents the target population is important, it cannot be expected to correct for inherent biases in the training data. Precisely, even if a social group identified by protected attributes such as race or religion is significantly poorer on average than another social group, it can be deemed as immoral to refuse a loan on the basis that an applicant belongs to the former group. In that context, observers have bluntly qualified predictive algorithms of “opinions embedded in math” (O’Neil, 2016). Algorithmic fairness. A large body of research (Agarwal et al., 2018; Woodworth et al., 2017; Zafar et al., 2017a,b, 2019; Menon and Williamson, 2018; Bechavod and Ligett, 2017) has emerged on the topic of fairness in machine learning — also called algorithmic fairness — which is a new field of study. It seeks to add explicit constraints to the training phase of machine learning models, so that blunt optimizations for accuracy do not lead to a reproduction of systemic societal biases. Early influential works date all the way back to 2012 (Dwork et al., 2012). More recently,
authors have worked on a textbook dedicated to the subject (Barocas et al., 2019).
Fairness in facial recognition. In facial recognition, including fairness constraints when learning models can correct for social groups being harder to identify than others. It is a necessity in many practical cases. For example, if a system designed to flag persons of interest has a higher rate of false acceptance for a specific ethnicity, it may interpreted as automatic racial profiling. Fairness literature. The literature in fairness for classification is broad, but there is little work in specific settings, such as ranking or similarity learning. Notable exceptions include Beutel et al. (2019) for ranking, which only modifies a score function with a post-processing step to satisfy a criterion of fairness. This suggests an opportunity for new approaches to fairness that are specifically tailored for those important problems, which we address in Chapter 10 of Part III. As a whole, the thesis participates in the dialogue between the machine learning community and the biometrics community. It proposes a stylized and theory-oriented view of challenges of biometrics, which leverages recent literature to study the specific — i.e. pairwise and functional — criteria used in biometrics. We hope that our perspective on biometric problems will have valuable impacts on practice, and underline that the derivation of statistical guarantees for biometric systems constitutes an important tool to ensure their security.
1.3.4
Thesis outline
The thesis is divided in three parts. Part I of the thesis contains technical preliminaries, which provide all of the intermediary results necessary to derive the theoretical contributions of the thesis. It is featured in the thesis for clarity reasons. Part II and Part III focus on our contributions. Part II delves into the idea of viewing similarity learning as a scoring problem on a product space. Part III engages with the broad idea of reliable machine learning.
Part I is divided in three chapters. The first chapter (Chapter 2) is a quick introduction to statistical learning theory. It presents the necessary results to derive generalization guarantees in the easy setting of binary classification. Precisely, it details the derivation of finite-sample bounds on the excess error of the empirical minimizer. Most of our theoretical contributions can be interpreted as extensions of those results, but our contributions concern more complicated problems. The second chapter (Chapter 3) deals with all of the necessary results that relate to the idea of ranking in machine learning. Our contributions build on two topics related to rankings: bipartite ranking and ranking aggregation. Indeed, our work extends existing bipartite ranking guarantees to the similarity ranking setting presented in Part II, ranking aggregation is used for bagging ranking trees, and the guarantees of the first chapter of Part III are built on a parametric model for rankings, which can be considered as a tool for ranking aggregation. Finally, the third and last chapter (Chapter 4) features a short introduction to important results in U -statistics, an essential component of all pairwise learning problems. As such, Chapter 4 is a prerequisite to our similarity ranking guarantees, and is involved in the estimation of risk functionals in standard bipartite ranking.
Part II explores the idea of considering the biometrics verification problem as ranking pairs of instances. It is divided in three chapters. The first chapter (Chapter 5) presents formally the idea of seeing similarity learning through the lens of ROC optimization. It proposes novel guarantees for the problem of pointwise ROC optimization, which seeks to optimize for true positive rates under an upper bound on the false positive rate. This analysis paves the way for an extension of the guarantees of the TreeRank algorithm to similarity learning, that we deliver. Using numerical simulations, we provide the first empirical illustration of fast learning rates, tailored here to the specific case of pointwise ROC optimization for similarity ranking. Due to the prohibitive number of pairs involved in the computations, the propositions of the first chapter are not practical for any large-scale application. To correct this, statisticians proposed sampling approximations for U -statistics, which is an useful approach in similarity ranking. The second chapter (Chapter 6) extends that proposition to settings where the dataset is distributed. Finally, the third chapter (Chapter 7) is rather prospective and proposes simple numerical toy experiments on similarity ranking, that address the optimization aspect of the problem. The extension of those experiments will be the subject of future work.
23 1.4. Similarity Ranking is also divided in three chapters. The first chapter (Chapter 8) derives learning guarantees for predicting an ordering over possible classes with only multiclass classification data, which relies on the use of a One-Versus-One (OVO) strategy. That problem often arises in noisy problems, i.e. those for which the top-1 ranked class has a good chance to be a false positive. One is then interested in the most likely classes, as is often the case in forensics. The second chapter (Chapter 9) proposes techniques to correct bias between the train and test sample, with auxiliary information on the difference between the two. It relies on an application of the well-known principle of importance sampling in statistics. Finally, the third chapter (Chapter 10) proposes an unification of a class of fairness constraints, as well as a new and more restrictive fairness constraint, that is more suited to practical situations. It also features theoretical guarantees and gradient-based approaches for learning under both types of constraints.
The last chapter of the thesis (Chapter 11) contains a summary of the contributions of Part II and Part III, as well as a detailed account of the most promising directions for future work. It ends with a general conclusion on the thesis.
The next two sections of this chapter — Section 1.4 and Section 1.5 — summarize the contributions of the thesis. Each section focuses respectively on the first and second part of the thesis, and is divided in subsections which summarize each chapter of the part. Finally, Section 1.6 sums up the perspectives of the thesis.
1.4
Similarity Ranking
Similarity learning plays a key role in many machine learning problems such as clustering, classification or dimensionality reduction. It is especially important when one considers open-world problems, — e.g. situations when a model encounters classes after deployment that were not available during training (Chen et al., 2018) — which is the case for any biometric application. In this section, we consider metric learning from the perspective of scoring pairs of instances, which is coherent with the evaluation of many systems based on metric learning techniques.
1.4.1
Similarity Ranking Theory
Bipartite ranking/scoring considers a set of elements associated to a binary label, and seeks to rank those with label `1 higher than those with label ´1. To derive an order on an input spaceX , bipartite ranking is generally tackled by learning a score function s : X Ñ R (Menon and Williamson, 2016). On the other hand, the field of metric/similarity learning (Bellet et al., 2015a) is the task of learning a similarity — or equivalently, a distance — s :X ˆ X Ñ R on the product spaceX ˆ X . While metric learning algorithms were originally evaluated w.r.t. their relevance for a clustering task (Xing et al., 2002), today practitioners use performance indicators derived from the ROC curve, the golden standard for evaluating scoring functions in bipartite ranking. Therefore, our work introduces as similarity ranking the idea of learning similarities for a ranking objective.
A functional criterion: the ROC curve. In the multi-class classification setting, introduce a random pair pX, Y q PX ˆt1, . . . , Ku, with K P N the number of classes, as well as an independent copy pX1, Y1
q of pX, Y q. Then, one can define a random variable Z “ 2 ¨ ItY “ Y1u ´ 1 that is equal to 1 if both pairs belong to the same class and ´1 otherwise. The ROC curve of a similarity function is then equal to the PP-plot t P R ÞÑ p sHsptq, sGsptqq, where, for all t P R:
s
Hsptq :“ PtspX, X1q ą t | Z “ ´1u and Gssptq :“ PtspX, X1q ą t | Z “ `1u. s
Hsptq and sGsptq are respectively the false positive and true positive rate associated to the similarity s. Under continuity assumptions, the ROC curve writes as the graph of the function α P p0, 1q ÞÑ ROCspαq “ sGsptq ˝ sHs´1pαq. Previous approaches for similarity learning optimize an empirical evaluation of the Area Under the ROC Curve (AUC) of the similarity function s (McFee and Lanckriet, 2010; Huo et al., 2018).
Pointwise ROC optimization (pROC). The AUC is a global summary of the ROC curve which penalizes ranking errors regardless of their position in the list (Cl´emen¸con et al., 2008,
Proposition B.2). Other criteria focus on the top of the list (Cl´emen¸con and Vayatis, 2007; Huo et al., 2018), and their study is the subject of the Ranking the Best literature (Menon and Williamson, 2016, Section 9). In our work, we consider optimizing the true positive rate attained by a similarity under an upper bound α P p0, 1q on its false positive rate. This setting is relevant in biometric applications, as security guarantees are specified with a limit on the false positive rate of the system. We refer to this problem as pointwise ROC optimization (pROC). Considering the risks:
R´
psq :“ ErspX, X1q | Z “ ´1s and R`
psq :“ ErspX, X1q | Z “ `1s, with S a proposed family of similarities, the pROC problem writes:
max sPS R
`psq subject to R´psq ď α. (1.1)
We denote a solution of Eq. (1.1) as s˚. Cl´emen¸con and Vayatis (2010) studied the equivalent of Eq. (1.1) in bipartite ranking. This problem is analogous to Neyman-Pearson classification (Scott and Nowak, 2005), and bears close resemblance to the minimum-volume set problem (Scott and Nowak, 2006). WhenS is the class of all measurable functions, a solution of Eq. (1.1) writes as a super-level set of the posterior probability η : x, x1
ÞÑ PtpX, X1q “ px, x1q | Y “ Y1u, which is a consequence of the Neyman-Pearson fundamental lemma (Lehmann and Romano, 2005, Theorem 3.2.1).
Pairwise estimators. The analysis of Cl´emen¸con and Vayatis (2010) relies on the fact that natural estimators of R´psq and R`psq are standard empirical means in the case of bipartite ranking, However, it is not true in similarity ranking. Consider a sampleDn “ tpXi, Yiquni“1 composed of n i.i.d. copies of the pair pX, Y q, then the natural estimators of R´
psq and R`psq based onDn write: R´ npsq :“ 1 n´ ÿ iăj ItYi‰ Yju ¨ spXi, Xjq, (1.2) R` npsq :“ 1 n` ÿ iăj ItYi“ Yju ¨ spXi, Xjq, (1.3) where n` :“ ř
iăjItYi “ Yju and n´ :“ npn ´ 1q{2 ´ n`. The quantities in Eq. (1.2) and Eq. (1.3) are not sums of independent random variables, hence the analysis of Cl´emen¸con and Vayatis (2010) breaks down. However, they are ratios of the well-known U -statistics (Lee, 1990; de la Pena and Gin´e, 1999).
Generalization guarantees for pROC. The empirical counterpart of pROC (Eq. (1.1)) writes: max
sPS R `
npsq subject to R´npsq ď α ` φ, (1.4) where φ ě 0 is a term, which tolerates the variations of R´
npsq around its expectation R´psq. We denote by sn a solution of Eq. (1.4). The generalization of standard concentration inequalities to U -statistics enables us to extend the uniform guarantees of Cl´emen¸con and Vayatis (2010). Precisely, we simultaneously ensure with high probability: that R`ps˚q´R`ps
nq is upper-bounded by a quantity of order n´1{2 and that R´ps
nq ď α ` φn with φn “ Opn´1{2q. In summary, we show that both excesss risk are bounded with the standard learning speed in n´1{2 without assumptions on the distribution of the data.
Fast generalization speeds for pROC. In the case of binary classification, Mammen and Tsybakov (1995) have shown that, under a noise assumption parameterized by a P p0, 1q on the data distribution, fast convergence speeds in Opn´1{p2´aqq hold. The fast speed is a consequence of an upper-bound on the variance of the excess risk, that is derived from the noise assumption. The analysis of Cl´emen¸con and Vayatis (2010) built on those ideas to propose an upper bound on R`ps˚q ´ R`ps
nq in Opn´p2`aq{4q with similar guarantees in Opn´1{2q for R´, for pROC in bipartite ranking. Compared to the binary classification setting, pROC has lower learning speeds, which comes from the bilateral nature of pROC. Our work extend the fast speeds of Cl´emen¸con and Vayatis (2010) from bipartite ranking to the case of similarity ranking. Incidentally, the result is true under a much weaker assumption. Precisely, it relies on the second Hoeffding’s decomposition for U -statistics (Hoeffding, 1948), which implies that the deviation of the excess
25 1.4. Similarity Ranking risk consists mainly in that of its H´ajek projection. Since the H´ajek projection is a variance-reducing transformation of a U -statistic (van der Vaart, 2000, Section 11), weaker assumptions imply the upper-bound on the variance required for fast learning speeds. Cl´emen¸con et al. (2008) featured that usage of the properties of U -statistics to derive fast convergence speeds, but never applied it to problems that feature a random constraint.
Empirical illustration of fast speeds. Our work also contains the first experimental illustra-tion of fast speeds of convergence, on our specific similarity ranking problem. The illustraillustra-tion relies on the generation of data that satisfies the noise assumption for different noise parameters a P p0, 1q, followed by a comparison of their empirical learning rates. We chose the data distri-bution and the proposed familyS so that the optimal similarity s˚ is known and the empirical minimizer sn can be found exactly. For that matter, we setS as the decision stumps on a fixed transformation of the data.
Limitations of pROC. While the pROC problem echoes practical considerations in biometrics, where systems are deployed to work at a fixed rate of false positives α, its empirical resolution is hard in practice. Few exceptions rely on fixed partitioning of the input space (Scott and Nowak, 2006). In many situations, the false positive rate α for a system is unknown in advance, thus optimizing for the wrong α may not yield satisfying outcomes at deployment.
TreeRank for bipartite ranking. The TreeRank algorithm for bipartite ranking was introduced in Cl´emen¸con and Vayatis (2009). TreeRank learns a piecewise constant score function sDn, built to provide an adaptive piecewise linear estimation of the optimal ROC curve.
As implied by optimal solutions of Eq. (1.1), the optimal ROC curve ROC˚is that of the posterior probability η. TreeRank recursively splits the input spaceX and optimizes greedily the AUC at each split, thus forming a binary tree of depth Dn of nested partitions of the input space X . Under specific assumptions, Cl´emen¸con and Vayatis (2009) have proven uniform bounds in supremum norm between the optimal ROC curve and that of sDnwhen Dn„alogpnq, i.e. that
with large probability: sup αPr0,1s ROCsDnpαq ´ ROC ˚ pαq ď expp´λ a logpnqq, (1.5)
where λ is a constant specified by the user.
TreeRank for similarity ranking. Our work proposes an extension of the TreeRank algorithm for learning similarities, by considering recursive splits of the product spaceX ˆ X . To ensure that the similarity s is symmetric, we consider only symmetric splits with respect to the two arguments in the input spaceX Ă Rd, by splitting on the following simple reparametrization ofX ˆ X : f :px, x1 q Þш|x ´ x 1 | x ` x1 ˙ .
Using the same extensions of classic concentrations inequalities to U -statistics as before, we extended the proof of Eq. (1.5) to similarity ranking. Our analysis provides a theoretically-supported approach to learning similarities that approach the optimal ROC curve in supremum norm.
While we have proven theoretical guarantees for approaches to similarity ranking, the estimators involved in the computation of the risk functionals require performing sums of very large numbers of terms. The induced computational cost makes the practical application of such approaches prohibitive. For example, calculating of R´
npsq require summing n´ terms, which is quadratic in n when K is constant. In typical biometric applications, the number of samples per class is fixed. Hence, the proportion of negative pairs n´ over all pairs n2 is even higher than the case K constant. The next section exploits recent analyses in the approximation of U -statistics to alleviate that problem.
1.4.2
Distributed
U -Statistics
Most biometric applications learn on large-scale datasets. For facial recognition, the largest dataset released to the public contains 8.2 million images (Guo et al., 2016) and private datasets are much larger. The scale of facial recognition datasets justifies the computational concerns
described in Section 1.4.1, as the number of negative pairs is higher than 50 trillions (1012) for Guo et al. (2016). Besides this restriction on the number of operations, these datasets often cannot be contained in the random-access memory (RAM) of a single machine. In our work, we proposed an approach to tackle the estimation of U -statistics in a distributed environment, which deals with those two limitations simultaneously.
Incomplete U -statistics. The idea of alleviating the computational complexity of U -statistics is not new, as Blom (1976) proposed summing over a small finite number of B pairs selected by sampling with replacement to in the set of all pairs to form incomplete U -statistics in 1976. Cl´emen¸con et al. (2016) derived an upper bound on the deviation between an incomplete U -statistic UB and the complete U -statistic Un that holds with high probability. In the case of one sample U -statistics of degree two — averages of all possible pairs formed with a sample —, the bound implies that using the estimator UB with only B “ n pairs suffices to recover a usual learning rate of order n´1{2, instead of summing all npn ´ 1q{2 pairs as for U
n. This result implies that one can extend the proofs for similarity ranking presented above so that they work with incomplete U -statistics, which makes the setting practical in large-scale learning applications. Distributed environments. In cases where the data does not fit on a single machine, the recent technological progresses regarding distributed databases and parallel computation made the deployment of distributed machine learning accessible, largely due to the development of frameworks for cluster computing, such as Apache Spark (Zaharia et al., 2010) or Petuum (Xing et al., 2015). These frameworks abstracted away the network and communication aspects of distributed algorithms. As such, they eased the deployment of distributed algorithms, but have restricted the types of operations that can be efficiently achieved, generally in order to guarantee algorithmic properties. At the same time, Jordan (2013) urged statisticians to guide practitioners of large-scale machine learning, by studying the implications of distribution on estimation, particularly to put in perspective the gains in computational time with the potential losses in statistical accuracy. Our work addresses this issue, by proposing several estimators for U -statistics in a distributed setting and comparing their variances. In that context, we propose time versus variance tradeoffs.
Probabilistic framework. Introduce two independent i.i.d. samplesDn“ tX1, . . . , Xnu ĂX andQm“ tZ1, . . . , Zmu ĂZ of respectively n P N and m P N elements, such that Dn andQm can have different distributions. The complete two-sample U -statistic of kernel h :X ˆ Z Ñ R associated with those samples writes as:
Unphq :“ 1 nm n ÿ k“1 m ÿ l“1 hpXk, Zlq, (1.6)
with n “ pn, mq. On the other hand, the incomplete counterpart of Unphq based on B pairs writes as: UBphq :“ 1 B ÿ pk,lqPDB hpXk, Zlq, (1.7)
where DB is a set of B elements selected at random in the set of all pairs tpk, lq | pk, lq P t1, . . . , nu ˆ t1, . . . , muu. For large-scale data, the full datasets Dn and Qm can not fit on a single machine, which makes the direct computation of Eq. (1.6) and Eq. (1.7) impossible. In that context, the standard approach is to distribute the data on N P N workers. For a standard mean, the simple computation of the average of the local means for each worker yields the same estimator as in the centralized setting. The computation is not that simple for U -statistics, since each worker can only form pairs with the local sample without network communication. Distributed estimators for U -statistics. We first introduced two simple estimators in the distributed setting that do not require network communication: the average Un,N of N complete U -statistics on each local sample, and the average Un,N,B of N incomplete U -statistics formed with B randomly selected pairs on each local sample. Using the second Hoeffding decomposition, we derive an analytical formulation for the variances of those estimators, following the steps of Hoeffding (1948) for Un. Their expression shows that the estimators Un,N and Un,N,B have a limited accuracy, i.e. a minimum variance, that can be significantly higher than that of Unfor a specific h and specific distributions of X1 and Z1.