10th International Conference on System Simulation in Buildings, Liege, December 10-12, 2018
Positive Energy Houses, envelope and systems integrated
optimization by means of dynamic simulations
P. Abrahams, C. Scheuren, P. André
BEMSUniversité de Liège, Arlon Campus Environnement, Belgique
1. ABSTRACT
In the framework of the Interreg IV-A Greater Region project called « VallEnergie » four projects of residential houses with “positive energy performance” were analysed. The main purpose of the study was to define the optimal choices in terms of envelope and energy system in the building in order to reach the high performance level of a “Positive Energy House” (PEH in this paper). The first step was to determine what was meant by the term “Positive Energy House” and to define criteria used to characterize energy and comfort performance of such house.
The concept of « Positive Energy house » defined in the project had to be in adequacy with European definition, therefore a complete state of the art of NZEB concept in Europe was carried out. The collected information was used to establish the specifications document of “PEH” in concertation with the project consortium. By means of TRNSYS17 software different sets of variants were assessed by thermal dynamic simulations and compared in order to define the optimal choice of insulation strategy and heating, DHW and Renewable Energy production systems configuration to reach the PEH performance as defined in the specification document of “VallEnergie” project. The paper will present the selected hypotheses of the simulation models, describe the applications that were developed in TRNSYS and discuss the results of the different variants.
Keywords: Positive Energy Houses, NZEBs, System simulation, Dynamic simulation,
TRNSYS.
2. INTRODUCTION
The 20-20-20 EU’s strategy aims at a triple reduction objective in terms of annual primary energy consumption and greenhouse gases (GHG) and also to reach a 20% share in renewables in the European energy consumption. In this context new standards of construction have been developed because buildings represent a high potential for a significant reduction of GHG emissions and energy use. Indeed, buildings (residential and commercial) represent around 40% of the global final energy consumption and are responsible about 36% of the total CO2 emissions in EU (European Parliament, 2012). These standards are aimed at ambitious requirements for energy performance in the building sector and were introduced in the Energy Performance of Buildings Directive (EPBD, 2010/31/EC) that imposes Members States to define a national definition for “nearly Zero Energy Buildings” (nZEB). As mentioned in article 2 of EBPD the term “nZEBs” means buildings with a very high energy performance and the low amount of residual energy should be covered by renewable sources and as possible produced on-site or nearby (EU, 2010).
Because all buildings have to be nZEB by 31 December 2020 the standard has gradually been implemented across EU in the last few years. But already some Members States went further in the requirements with the “Net Zero Energy Buildings” (NZEB) which are buildings with a net annual energy balance equal to 0. In other words, these buildings have a net energy
10th International Conference on System Simulation in Buildings, Liege, December 10-12, 2018
consumption calculated on an annual basis which is roughly equal to the renewable energy produced on-site or nearby.
In Belgium the Brussels-Capital Region defined its own definition for NZEB or so called “Positive Energy Building”. A “zero energy” building has to show a very high energy performance and cover its demand by means of renewables sources. Furthermore only its primary energy needs for heating, cooling, domestic hot water (DHW), lighting and auxiliary electricity (ventilation, circulating pump, etc…) in normalized situation are taken into account as mentioned in the Vademecum of PHPP of Brussels-Capital Region (Vandenberghe & VanLoon, 2013). If the owner of this building also decides to compensate the residual needs for domestic consumptions (household appliances, electric vehicle, etc…) by means of renewables produced on-site or nearby thus this building will become a “positive energy” one. Fig. 1 illustrates the difference between each term.
Figure 1: Differences between a positive energy house, nZEB, passive house and traditional house
The Interreg IV-A Greater Region project VallEnergie was developed with a the objective of developing solutions to achieve energy autonomy in the Attert valley in Belgium near the Luxembourg border. This project focused on new renewable energy concepts and more specifically for the residential sector with the study of four PEH projects (2 Belgian houses and 2 Luxemburgish houses). Therefore, specifications were drawn up in order to determine the definition of the positive energy house concept including the constructive and technical criteria expected for this type of construction. Based upon these specifications, simulation variants on the envelope and system choices were conducted using TRNSYS software. As a result of the simulations, it was possible, in consultation with the architects of the project, to define the optimal solution in terms of constructive and technical criteria (envelope and energy systems) for building PEH meeting the specifications pre-established. This paper presents the hypotheses, methodology for simulations and the main results of the study.
10th International Conference on System Simulation in Buildings, Liege, December 10-12, 2018
3. METHODOLOGY AND SIMULATIONS
3.1 Common hypotheses and simulation variants
3.1.1 Four houses project
The Belgian side of the VallEnergie project concerned two semi-terraced houses with each other. The energy performance of the houses was first evaluated in the PEB software (Energy Performance Building standard in Belgium). This evaluation helped to design in TRNSYS the houses models with more accuracy thanks to tremendous information from the PEB report and architect’s inputs. In the Luxemburgish side there was also two projects of semi-terraced PEH but in different location. The first house was a case of demolition of an old annex and reconstruction of three passive houses in its place. For the study only one of these houses was selected for simulations. The energy performance of the second house didn’t be primarily assessed only the architect’s plans were available. There were no information concerning the wall composition thus the information was taken from the first Luxemburgish house. The four houses are respectively called A, B for Belgian houses and C, D for Luxemburgish houses. An important quantity of results were generated but only the results for one of the 4 models will be presented in this article, namely the Belgian house model A.
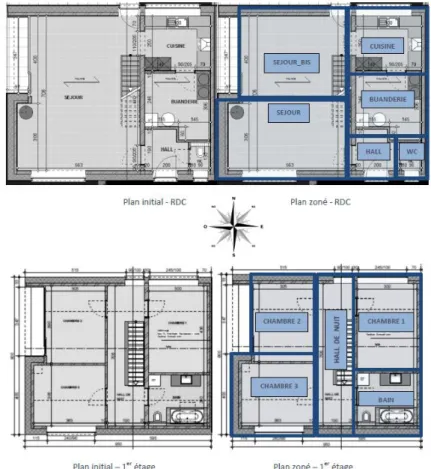
Fig. 2 shows the floor plan (ground floor and first floor (right) as well as the zoning strategy (left) defined in the TRNSYS simulations).
Fig 2: Floor plans and zoning strategy of the simulated house The main characteristic of the four houses are shown in Table 1.
10th International Conference on System Simulation in Buildings, Liege, December 10-12, 2018
A B C D
Location Belgium Luxembourg
Type New construction Demolition and New
construction New construction
Construction Type Massive / heavy
Light
Construction material Brick Wood
Insulation material Graphite enriched
EPS Cellulose
Glazing Triple
Ventilation type Dual flow CMV
Infiltration rate (vol/h) 0.6
Occupancy (pers.) 4
Temperature setpoint
(°Cnight/°Cday) 16/20
Living surface (m²) 120 127 142 140
3.1.2 General hypotheses
Some hypotheses in the study were common for the four house models in TRNSYS. It notably concerned: occupancy profiles, temperature set points, heating period, internal gains, infiltration rate and ventilation system, (Abrahams, Rogiest, & André, 2015). Impact of certain parameters on the energy performance of the models was evaluated. Thus the influence of the set temperature or the internal gains on the annual consumption for heating was analyzed for one of the 4 houses of the project - here the Belgian house A. Results are shown in
Table 2. The reference model used to compare results had an unlimited power heating system capable to cover instantly needs of heat in the building model.
Table 2: Influence of temperature setpoint and internal gains on the annual heating consumption for Belgian house model A.
Setpoint temperature influence on annual heating consumption (final energy)
Setpoint 16°C/19°C Setpoint 16°C/20°C Setpoint 16°C/21°C Annual heating consumption (kWh/yr) 1414 1696 2001
Relative variation -17 % - +18 %
Artificial lighting influence on annual heating consumption (final energy)
With artificial ligthing gain Without artificial lighting gain Annual heating consumption (kWh/yr) 1696 1858
Relative variation - +9.5%
Domestic appliances influence on annual heating consumption (final energy)
With domestic appliances gain Without domestic appliances gain Annual heating consumption (kWh/yr) 1696 1842
Relative variation - +8.6%
Internal gains influence on annual heating consumption (final energy)
With internal gains Without internal gains Annual heating consumption (kWh/yr) 1696 3077
10th International Conference on System Simulation in Buildings, Liege, December 10-12, 2018
Relative variation - +81%
As shown in Table 2 in either case, a 1°C change in the set point temperature in a house with high energy performance such as model A can be considered to increase or reduce the annual energy consumption for heating by about 17 to 18%. The artificial lighting also seems to have a significant impact on such a kind of building: a total absence of artificial lighting will cause an increase by around 9.5% of the annual heating consumption in house A. The value is almost similar for domestic appliances gains impact on annual energy consumption. In general, a model without any internal gains (occupancy, lighting, domestic appliances) will consume around 81% more energy than model with internal gains. These simulations demonstrate the importance of the choice of starting assumptions and their influence on the results.
3.1.3 Simulation tool
TRNSYS (version 17) was used to perform the dynamic simulations reported in this paper. The building was simulated using Type 56 allowing a multizone approach. The model was the object of a deep validation work performed in the IEA Annex 58 project. In this project, the model was compared to detailed measurements performed in the test houses located in Holzkirchen. The results obtained in this validation exercise were very good (Strachan et al, 2016).
3.1.4 Envelop variants
In order to determine the optimal solution in terms of envelope which will make possible to respect the criteria imposed by the specifications of the project, a series of simulations were carried out. The parameters selected for envelop simulation concerned: the choice of wall composition and in particular insulation type and thickness, orientation of the building, type of solar protection and their control, value of the glazing g value.
Some other variants on the architectural configurations of house models were also simulated thanks to the 3D plugin of TRNSYS. For example, the window recess (see Figure 3) impact on building performance was analyzed. Most of the time this architectural detail is not taken into account in simulation. Therefore, shading element around window was designed in order to reproduce the window offset in the wall. Thus a model with and without window recess was simulated in order to know its impact on energy performance and summer thermal comfort. Results are shown in 4.1.1.
10th International Conference on System Simulation in Buildings, Liege, December 10-12, 2018 3.1.5 System variants
Once the envelope configurations for the house models have been fixed, the work has then started to study the system variants for the production of heating, domestic hot water and renewables. Different combinations between systems were simulated to obtain an optimal energy solution for the houses, see Table 3. These combinations had to fulfil the PEH energy performance requirements and also to answer some financial constraints due to the target public of the construction project.
Table 3: Simulation variants for systems combinations
System variant Heating production DHW production RE production
Variant n°1 – V1
V1a Electrical heating Electric tank PV panels
V1b Electrical heating Solar tank PV + thermal solar panels
V1c Electrical heating Solar tank + HP PV + thermal solar panels
Variant n°2 – V2
V2a Wood pellet stove Electric tank PV panels
V2b Wood pellet stove Solar tank PV + thermal solar panels
V2c Wood pellet stove Solar tank + HP PV + thermal solar panels
V2d Wood pellet stove + electric
heating
Solar tank + HP PV + thermal solar panels
Variant n°3 – V3
V3 Hot pulsed air - -
Variant n°4 – V4
V4a HP + radiators Solar tank + HP PV + thermal solar panels
V4b HP + radiators Solar tank + HP PV panels
As shown in Table 3 there were four heating systems analysed by dynamic simulations in TRNSYS. For the electrical heating the TRNBuild interface of TRNSYS software was used with the classic heating type manager. The wood pellet stove was emulated thanks to a PID controller (Type23 in TRNSYS) with parameters set from (Georges, Skreiberg, & Novakovic, 2014). The model of this wood pellet stove is a simplified one and the simulations were run in order to define the power emitted by convection by the wood stove. This power is transformed into an internal gain to be applied in the room where the stove is placed. The radiative part is distributed between the walls of the room according to view factors. Nevertheless, simulations demonstrated that this radiative power could be neglected compared to the convective one because it represented less than 1% of the global emitted power from the stove. The third system - a heating by hot air distribution in house - required a preliminary work that consisted in evaluated first the demand of the houses thanks to a heating system able to instantly supply energy to the house (for a temperature set point set at 20°C by day and 16°C by night). The second step was to compute the supply temperature in order to reach 20°C in house (1), (2). Indeed, the power is related to the supply temperature by the formula:
𝑃 = 𝐶𝑝 × 𝜌𝑎𝑖𝑟 × 𝑄 × (𝑇𝑏𝑙𝑜𝑤 − 𝑇𝑎𝑚𝑏𝑖𝑎𝑛𝑡) (1) 𝑇𝑏𝑙𝑜𝑤 = 𝑇𝑎𝑚𝑏𝑖𝑎𝑛𝑡 + 𝑃
𝐶𝑝×𝑄×𝜌𝑎𝑖𝑟 (2)
The last heating system was a heat pump. The COP of the HP was computed thanks to simulations and the thermal power was determined thanks to the computed COP of HP. A
10th International Conference on System Simulation in Buildings, Liege, December 10-12, 2018
system of equations was used in order to introduce Carnot equations for the COP computation. Once again the simulation of the HP was based on emulation and not on real simulation of the system itself.
For the DHW production three configurations were simulated: a classical tank with electrical resistance, a solar tank linked to the solar thermal panels with an auxiliary electric resistance and the same solar tank but the electric resistance was replaced by the HP. At least the PV electricity production was also estimated for each houses and simulated thanks to the Type 94a in Simulation Studio (TRNSYS environment). Four kinds of PV panels were tested by changing the parameters of this type.
4. RESULTS ANALYSIS AND DISCUSSION
4.1.1 Envelop simulations results
All the four house models of the project presented a very high envelop performance with a U-value for external wall between 0.101 and 0.113 W/m²K. For each model the minimal insulation thickness needed to achieve passive requirements was determined by means of TRNSYS simulations, see Figure and Table 4. To obtain the minimal value of thickness insulation the maximal amount of annual energy demand of each building allowed by the passive standard was computed. This value is shown by the dot line on Figure as an example given for one of the four house models – house A. The insulation layer was increase by 5 cm on each simulation run. All results are given in Table 4.
Figure 4: House model A – insulation thickness – graphite enriched EPS [cm]
Table 4: Determination of minimal insulation thickness for each house models
Model A Model B Model C Model D Annual heating
demand – passive limit (kWh/yr)
2164 2346 3165 2673
Insulation material Graphite enriched EPS Cellulose
Minimal insulation thickness (cm)
18 19 8 9
The difference between Belgium and Luxembourg is mainly explained by the heating consumption requirement for passive standard in each country. Indeed for Belgium the annual heating specific consumption has to be lower or equal than 15kWh/m².yr whereas Luxembourg criteria is lower or equal than 22kWh/m².an (Chambre des métiers Luxembourg, 2014). Another aspect shown in Figure is the limited impact of the additional cm after a certain insulation level
0 2000 4000 6000 8000 10000 0 5 10 15 20 25 30 35 40 45 50 He ati n g d em an d (k W h /y r) Insulation thickness (cm)
Annual heating demand [kWh/yr] Passive criteria limit [kWh/yr]
10th International Conference on System Simulation in Buildings, Liege, December 10-12, 2018
on the annual heating consumption. The real gain is on the very first insulation centimeters. For house model A it seems that after 20cm of graphite enriched EPS the impact on energy needs is lowered. For the window recess simulations, the depth of window offset has an impact on the operative temperature as shown in Figure . Results are given for a simulation period between the 15th of July and the 15th of August (summer).
Figure 5: Internal air temperature in one thermal zone in house model A, with or without window recess simulation
In black the model without window recess show a higher temperature during summer than the model with 5cm (dot line) and 12 cm (light grey) of window offset in the wall. As calculated in 6a the overheating is reduced by 3% to 5% thanks to the window recess. While the offset of window in the wall has a positive impact on thermal comfort in summer it is also responsible of an increase of energy consumption in winter. Indeed, as shown in Figure 6b the offset of window in the wall has an impact on the yearly energy demand of building.
a)
b)
Figure 6: a) Overheating reduction by window recess; b) Yearly energy consumption increase due to window recess
23 24 25 26 27 28 29 4 6 8 0 4 7 0 0 4 7 2 0 4 7 4 0 4 7 6 0 4 7 8 0 4 8 0 0 4 8 2 0 4 8 4 0 4 8 6 0 4 8 8 0 4 9 0 0 4 9 2 0 4 9 4 0 4 9 6 0 4 9 8 0 5 0 0 0 5 0 2 0 5 0 4 0 5 0 6 0 5 0 8 0 5 1 0 0 5 1 2 0 5 1 4 0 5 1 6 0 5 1 8 0 5 2 0 0 5 2 2 0 5 2 4 0 5 2 6 0 5 2 8 0 5 3 0 0 5 3 2 0 5 3 4 0 5 3 6 0 5 3 8 0 5 4 0 0 5 4 2 0 Op er ativ e tem p er atu re (° C) Simulation time (h)
Reference 5 cm recess 12 cm recess
17% 14% 12% -3% -5% 0% 5% 10% 15% 20% without WR 5 cm WR 12 cm WR (k W h /y r)
Overheating (%) Difference from reference without WR
2846 2896 2962 +2% +4% 2700 2800 2900 3000 3100 without WR 5 cm WR 12 cm WR (k W h /y r)
10th International Conference on System Simulation in Buildings, Liege, December 10-12, 2018
Due to the high level of performance to be achieved by the houses, the impact of construction details such as window embrasure on the results must be taken into account. Indeed, before considering the energy systems to be integrated into the houses of the project, it was first necessary to look at the good design and implementation of the envelope of the buildings themselves. This envelope must therefore be designed in such a way that heat losses are reduced to the minimum so that the building's demand is as low as possible. The simulations showed the importance of taking into account constructive details such as the window recess depth. Indeed, if it increases the annual consumption of the house will be impacted. In the case of a classic embrasure of about 12 cm, the impact on annual consumption is 4%. This value is not negligible for high energy standards. Simulations in TRNSYS were useful to highlight such a parameter to be taken into account in building simulation.
4.1.2 Systems simulations results
As there were a tremendous number of results for the complete study of the four houses and each variants of system combinations, only results for Belgian house model A will be presented in this section. A synthesis was done to define by each system combination which kind of energy performance level the house model is able to reach (
Table 5).
Table 5: Energy performance level reached by house model A in TRNSYS in function of energy systems combinations.
System variant
Heating / DWH production RE production
Energy performance level
V1a Electrical heating / Electric tank PV panels PASSIVE
V1b Electrical heating / Solar tank PV + thermal solar panels PASSIVE
V1c Electrical heating / Solar tank + HP PV + thermal solar panels PASSIVE
V2a Wood pellet stove / Electric tank PV panels PASSIVE
V2b Wood pellet stove / Solar tank PV + thermal solar panels PASSIVE
V2c Wood pellet stove / Solar tank + HP PV + thermal solar panels PEH
V2d Wood pellet stove + electric heating / Solar tank + HP
PV + thermal solar panels PEH
V3 Hot pulsed air - N.A
V4a HP + radiators / Solar tank + HP PV + thermal solar panels PEH
V4b HP + radiators / Solar tank + HP PV panels PEH
The electrical solution in house A (electric convectors and boiler) is one of the systems combinations that did not allow the house to fulfil the PEH requirements as set in the project. Indeed, the global annual energy balance of the house is not compensated by the local renewable energy production as required in the specifications of the project.
For the variant with the wood pellet stove the only combination that permits to the house to become a PEH is the solution that combined the stove and auxiliary electric heating for the heating system and the solar tank and heat pump for DHW production. In this case the global annual energy balance of the house is negative which means the house is able on one year to produce more energy that it consumes. But the results are mitigated for the wood stove simulations because of discomfort issues in the living room as shown in Figure 7. If the control
10th International Conference on System Simulation in Buildings, Liege, December 10-12, 2018
of temperature is set on the air temperature of the living room the stove is unable to heat the other rooms (room 2 called “Chambre 2” on the graph) that are on the 1st floor. To counter this comfort issue it was decided to control the stove on the air room temperature of room 2. This control had a positive impact on the mean air temperature on the 1st floor where the setpoint is better maintained but the air temperature in the living room, where the stove is placed, is too high and sometimes exceeds the temperature of 30°C in winter. The results are to be taken with caution because the wood stove model used for simulations was a simplified one. Moreover, the control of the setpoint in the room at the 1st floor was not reflecting the real control of a stove.
a) Wood pellet stove simulation: control of temperature set on the living room temperature
b) Wood pellet stove simulation: control of temperature set on the night room 2 temperature
Figure 7: Simulations results for wood stove system - Air room temperature analysis for comfort evaluation
10th International Conference on System Simulation in Buildings, Liege, December 10-12, 2018
The third system which was the distribution in the house of warm air by the ventilation system was immediately rejected because of too high supply temperature (more than 80°C in the coldest winter days). At least the best solution that was adopted for the project was the combination between a heat pump with distribution by radiators and a solar tank with auxiliary heating provided by a heat pump. The local RE production was ensured by PV panels. Thanks to this systems combinations the house A was able to completely fulfil the project requirements in terms of energy performance, comfort and construction costs.
5. CONCLUSIONS
To achieve the energy and cost specifications of the project each house had to show a very high performance. Therefore, the first point of attention was the reduction of thermal losses by the building envelop. Therefore, the first step of the house models study was to optimize the envelop and analyse conception choice by means of dynamic simulations. The minimal insulation thickness was defined thanks to TRNSYS simulations and a cost evaluation shown that the additional thickness is expensive compared to the gain on thermal loss diminution. Another aspect highlighted by simulations was the importance of architectural details consideration. Some details in envelop design as the window recess have an impact on results. Most of the time this detail is not simulated in TRNSYS although the 3D plugin integrated to the software allows such a simulation.
The second part of the study consisted in comparing several energy systems combinations in order to select the optimal solution to achieve the PEH standards as specified in the specifications document of the VallEnergie project. Due to large number of simulations most of the models used for energy systems were simplified or emulated in TRNSYS. The variant system selected for the house was confirmed by architects and the Belgian houses are now under construction.
6. REFERENCES
Abrahams, P., Rogiest, C., & André, P. (2015). Rapport d’étude Simulations dynamiques de
maisons à énergie positive (E+) avec le logiciel TRNSYS 17. Arlon, Belgium.
Chambre des métiers Luxembourg. (2014). Performance énergétique des bâtiments. Les avis
de la chambre des métiers. Retrieved from
http://www.veolia.com/veolia/ressources/documents/1/1391,batiments_energetique.pdf EU. (2010). Directive 2010/31/EU of the European Parliament and of the Council of 19 May
2010 on the energy performance of buildings (recast). Official Journal of the European
Union, 13–35. https://doi.org/doi:10.3000/17252555.L_2010.153.eng
European Parliament. (2012). Directive 2012/27/EU of the European Parliament and of the Council of 25 October 2012 on energy efficiency. Official Journal of the European Union
Directive, (October), 1–56. https://doi.org/10.3000/19770677.L_2012.315.eng
Georges, L., Skreiberg, Y., & Novakovic, V. (2014). On the proper integration of wood stoves in passive houses under cold climates. Energy and Buildings, 72, 87–95. https://doi.org/10.1016/j.enbuild.2013.12.023
Strachan, P.; Svehla, K.; Kersken, M.; Heusler, I. (2016). Empirical validation of common building energy simulation models based on in situ dynamic data. IEA Annex 58 Subtask 4a final report.
10th International Conference on System Simulation in Buildings, Liege, December 10-12, 2018 http://www.maisonpassive.be/IMG/pdf/vade-mecum-pdf_hd.pdf
Wallonie Energie SPW. (2018). Méthode de détermination du niveau de consommation
d’énergie primaire des unités résidentielles. Retrieved from
https://energie.wallonie.be/servlet/Repository/annexe-a1---per-modif.-ecodesign-2018---coordination-(fr).pdf?ID=49412&saveFile=true
7. ACKNOWLEDGEMENTS
This work has been performed in the framework of the VallEnergie project which was funded by the support of the European Union and the Walloon Region through the FEDER and the Interreg IV-A Greater Region program.
8. NOMENCLATURE
DHW: Domestic Hot Water
EPBD: Energy Performance of Buildings Directive EU: European Union
GHG: Greenhouse Gases HP: Heat Pump
N.A: Not Applicable
nZEB: nearly Zero Energy Building NZEB: Net Zero Energy Building PEH: Positive Energy House PV: Photovoltaic
RE: Renewable Energy


![Figure 4: House model A – insulation thickness – graphite enriched EPS [cm]](https://thumb-eu.123doks.com/thumbv2/123doknet/6805204.189205/7.892.120.772.573.799/figure-house-model-insulation-thickness-graphite-enriched-eps.webp)


