Photoionization mass spectrometry of kinetic energy-selected ions. An ion
retarding potential difference method applied to NO
+and O
+from N
2O
R. Locht
Département de Chimie Générale et de Chimie Physique, Institut de Chimie, Bât. B6, Université de Liège, Sart-Tilman par B-4000 Liège 1, Belgium
G. Hagenow, K. Hottmann and H. Baumgârtel
Institut für Physikalische und Theoretische Chemie, Freie Universität Berlin, Takustrasse 3, W-1000 Berlin 33, Germany
Abstract
A new method is described to obtain photoionization efficiency curves of kinetic energy-selected fragment ions. The method is tested and discussed in the case of the dissociative photoionization yields of NO+ and O+ from N2O. The attention is focussed on the dissociative autoionization processes in the threshold region, in the
Franck-Condon region of the N2O (Ã 2
Σ+) state and in the Franck-Condon gap between the à 2 Σ + and 2Π states.
1. Introduction
Within the framework of the problems related to chemical reactivity in excited states, the unimolecular decomposition reaction has received a great deal of attention. A large variety of experimental techniques have been used to investigate these reactions in simple as well as in rather complex molecular systems.
In addition to the energy of the dissociating vibronic state of a molecular ion, the important components in the energy balance of a dissociative ionization reaction are the translational and the internal energies of the fragmentation partners. If the former two quantities are directly accessible to the experiments, the latter has mostly to be inferred from experimental data.
Most of the experimental data on the translational energy involved in dissociative ionization processes, as well as the ion yield of kinetic energy-selected ions, are available from electroionization mass spectrometry [1-3]. The fragment ions translational energy against the molecular ions excitation energy has been investigated for fragmentation processes in several diatomic and polyatomic molecules. However, the use of dissociative electroionization mass spectrometry is limited by the electron energy resolution. Furthermore, the electron impact ionization threshold law makes it difficult to investigate the autoionization and direct dissociative ionization phenomena simultaneously.
Using photoionization mass spectrometry, translational energy spectroscopic data are scarce [4-8] and almost limited to a few photon energies. To our knowledge photoion yield curves of kinetic energy-selected fragment ions have not been measured. On the other hand, the photoion-photoelectron coincidence technique is acknowledged as one of the most reliable ways to investigate dissociative photoionization reactions [9,10]. Nevertheless, the results obtained by this method, mostly performed with the use of an intense single-line excitation source [e.g., the He(I) resonance line at 58.4 nm], are in principle restricted to the investigation of direct dissociative ionization processes. The availability of intense continuously-tunable light sources [e.g., synchrotron radiation sources] enables one to study dissociative ionization reactions occurring through both direct and autoionization processes, for example, by TPEPICO [9,10].
Taking advantage of the high resolution obtained by photoionization and the high intensity of the synchrotron radiation source, a first attempt has been made to apply the same technique as used in elec-troionization [1] to photoionization mass spectrometry. For the CH3
+
ion formation from CH3F, trans-lational
energy spectra and ionization efficiency curves were recorded at different wavelengths and different ion energies, respectively, [11]. The diagrams of kinetic energy against excitation energy thus obtained by both methods were found to be in very good agreement. The importance of dissociative autoionization processes was demonstrated.
[12] and electron impact [13]. A review of the abundant literature devoted to N2O+ and its dissociation is beyond
the scope of this paper (e.g., see references in refs. [10,13]). The aim of this work is to examine the capabilities and the possible extensions of the above-mentioned method to investigate the influence of autoionization processes on the fragmentation of N2O+. The NO+ and O+ production from the N2O molecule has been chosen
for its abundant autoionization structure.
2. Experimental
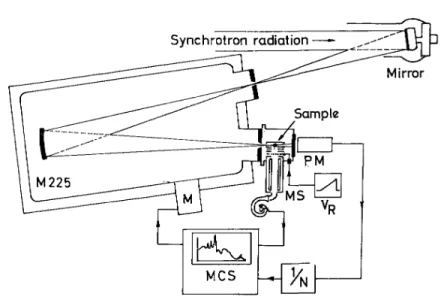
The experimental set-up used in this work is sketched in fig. 1. It is almost the same as the one used in the electroionization and fixed-wavelength photoionization experiments. These are described in detail elsewhere [1,6]. The advantage of the present experiment is the use of the synchrotron radiation of the Berlin electron storage ring BESSY as a light source. This radiation is dispersed in a 1 m normal-incidence monochromator (McPherson 225) by a 1200 lines/mm holographic grating. The 150 µm entrance slit and fixed 200 µm exit slit provided 0.2 nm resolution. During the experiment, the pressure in the monochromator is maintained at 10-7 mbar.
After photoionization the ions are extracted by a weak drawout field (about 200 mV) and focussed on the exit hole of the ion source. The emerging ions are energy analyzed in a retarding lens and accelerated into a quadrupole filter for mass analysis (BALZERS QMA 130). The ion current, collected on a channel-tron multiplier, is continuously scanned as a function of the photon wavelength λ at a fixed retarding potential VR (ion
yield curves) or of the retarding potential VR at fixed wavelength λ (retarding potential curves).
Fig. 1. Schematic diagram of the experimental set-up.
The photon count rate is monitored by a sodium salicylate-sensitized photomultiplier. This reference count rate is used to normalize the photoionization efficiency curves. The channel width of the recorded photoion yield curves being 0.06 nm, added to a calibration error of about 0.05 nm, the estimated total error of the wavelength is ± 0.1 nm.
The maximum of the N2O+ ion translational energy distribution is used as the zero-energy calibration
point of the kinetic energy scale of the NO+ and O+ ions. The same reference is used during the recording of the photoionization efficiency curves of both ions at different retarding potential settings.
In addition the high-resolution zero-kinetic-energy photoelectron spectrum of N2O has been recorded by
means of a tandem electron spectrometer described elsewhere [14].
The nitrous oxide gas, commercially available from Messer Griesheim (99% purity), was used without further purification. The sample is introduced in the ion chamber at a pressure of 10-5 mbar.
3. Data handling
3.1. Photoionization efficiency curves
The photoionization efficiency curves of the fragment ions are recorded at different retarding potential settings scanned by 50 or 100 mV steps. All ion yield curves are normalized with respect to an ion retarding potential curve recorded at a fixed wavelength.
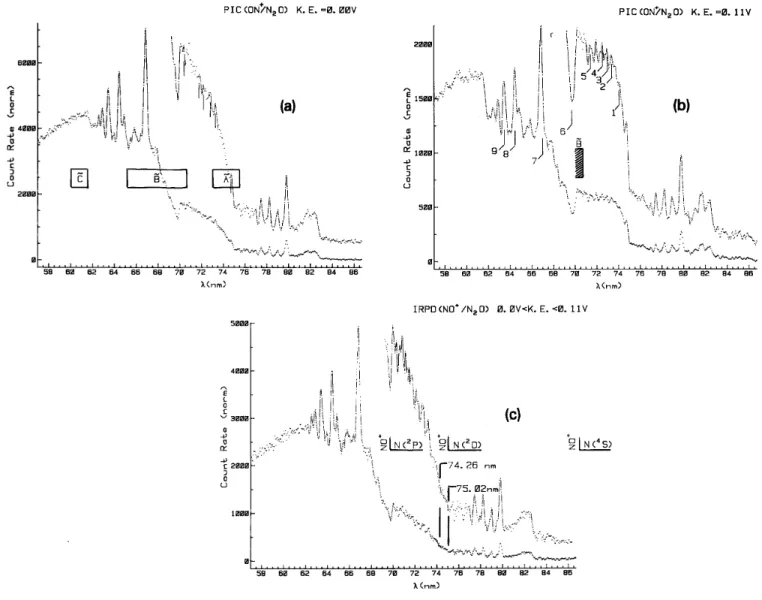
The normalized ionization efficiency curves obtained at two successive retarding potential settings are numerically subtracted in the way shown in fig. 2 for two successive normalized ionization efficiency curves of NO+/N2O observed at retarding potentials of 0.0 V (fig. 2a) and 0.11 V (fig. 2b) respectively. The result of this
operation is illustrated in fig. 2c where the ion retarding potential difference i+ (VR)λ - i +
(VR+∆VR)λis displayed
in the wavelength region of 57-86.7 nm. By this way the "ion retarding potential difference" (IRPD) ionization efficiency curve is obtained.
Fig. 2. Photoionization efficiency curves of NO+/N2O; (a) at FR=0.0V (rectangles indicate the direct ionization
Franck-Condon regions for the Ã, and states), (b) at VR=0.11V (numbers indicate wavelengths where NO+
kinetic energy distributions are measured). Curve (c) represents the IRPD curve resulting from the subtraction (a)-(b).
3.2. Ion retarding potentials curves
The ion retarding potential curves are recorded at different wavelengths between 50-75 nm (24.8-16.5 eV). The ion translational energy distribution curve is obtained by numerical differentiation of these retarding potential curves. Owing to the low signal-to-noise ratio, the noise present in these curves is apodized and filtered by fast Fourier transform.
4. Experimental results and discussion
4.1. The NO+/N2O ions
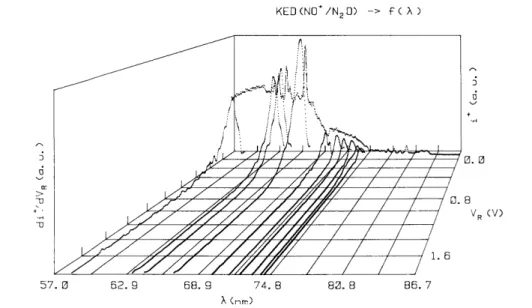
The photoionization efficiency curves of NO + / N
2O have been recorded between 57-86.7 nm
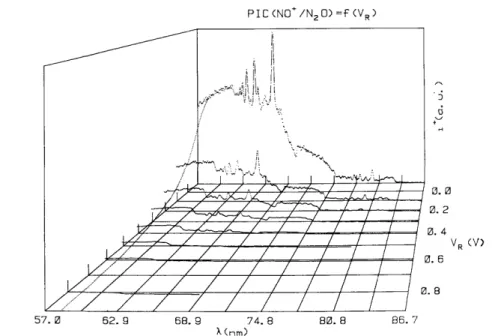
(21.7-14.3 eV) for different retarding potential settings between - 0.1 and 1.0 V by 100 mV steps. The result is shown in fig. 3 for -0.1 ≤ VR≤0.9 V. The retarding potential curve of NO
+
, used to normalize all ion yield curves, has been recorded at 58.4 nm (21.22 eV) and is inserted in fig. 3. Between retarding potentials of -0.1 and 0.9 V the normalized intensity of NO+ decreases by a factor of 200. For clarity at low retarding potentials, only the NO+ ion yield curve at VR= - 0.1 V is displayed.
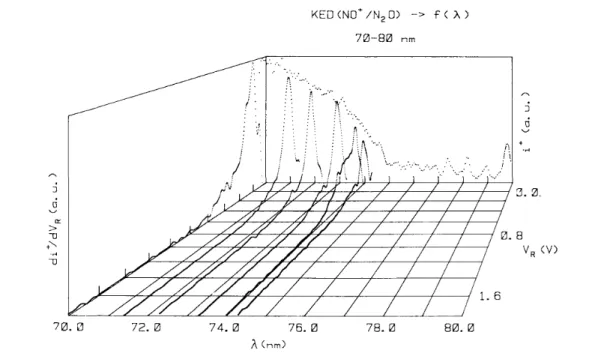
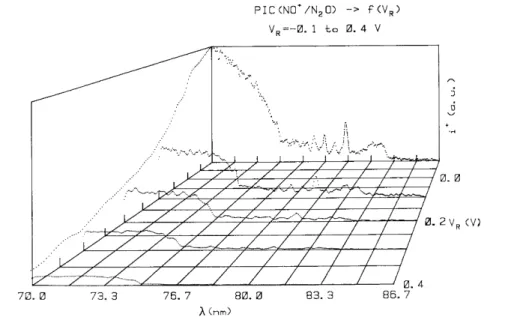
In addition to the drastic intensity decrease of the ionization efficiency, noticeable changes of shape and relative intensity of several structures have to be mentioned. This is illustrated in fig. 2 and fig. 4. In the latter the ionization efficiency curves of NO+ are shown in more detail in the 70-86.7 nm (17.7-14.3 eV) wavelength region and - 0.1 V≤VR≤0.4 V. On the other hand, the rapid intensity decrease of the autoionization structure in
the 63-70 nm (19.7-17.7 eV) region (see fig. 3 ) makes it possible to isolate the step-like feature at 61.68 nm (20.11 eV).
Comparing the ion yield curves of NO+ obtained at VR=0.0 V and VR=0.11 V, the most important
difference is observed in the 70-75 nm (17.7-16.5 eV) region. With 0.2 nm resolution, only a few autoionization structures are observed for the VR=0.0 V (see fig. 2a) curve whereas fairly well resolved peaks, superimposed on
a square-shaped continuum, are observed at VR=0.11 V (see fig. 2b). The positions of these structures, obtained
in both conditions, are listed in table 1.
Fig. 3. Set of photoionization efficiency curves of NO+/N2O recorded at -0.1 ≤ VR≤0.9 V settings.
The few resonant structures emerging from the continuum observed at VR=0.0 V can be ascribed to a
part of the "vibrational progression" of a Rydberg state belonging to a series converging to the N2O +
ionic state. This assignment was made possible owing to the fairly good agreement between the wavelength positions found in the present work and those published by Berkowitz and Eland [12] who only observed the corresponding progression in the O+/N2O photoion yield curve.
Fig. 4. Detail of the photoionization efficiency curve of NO+ in the 70-83 nm wavelength region and - 0.1 ≤ VR ≤
0.4 V.
In the photoionization efficiency curve recorded at VR=0.11V the extended "vibrational" progression of
the above-mentioned Rydberg state is observed, as compared to that measured for O+/N2O in this work and in
ref. [12]. Furthermore, besides this progression (denoted by "B" in table 1), characterized by spacings of 110 meV, several additional structures have to be mentioned. These are not observed in the O+/N2O ion yield curve
[12,15].
Table 1. Progression observed in the 70-74 nm wavelength region for NO+/N2O at VR=0.0 V and VR= 0.11 V.
The last three columns display the progression observed for O+/N2O as measured in this work, in ref. [12] and
the assignment [12], respectively. Estimated error of the wavelengths is about ± 0.1 nm
NO+/N2O O+/N2O Assignment [12] VR=0.0V VR=0.11V VR=0.0V Ref. [12] - 74.32 74.26 74.293 B - 74.09 - - - 73.74 73.75 73.754 B 73.28 73.33 73.24 73.279 B - 72.93 - - 72.81 72.81 72.80 72.810 B - 72.52 - - - 72.35 72.31 72.32 B 71.82 71.94 71.82 71.83 B - 71.53 - - - 71.36 71.34 71.376 B - 71.01 - Blurred - 70.83 70.85 Broad region 70.66 70.60 - 70.665 B - 70.43 70.41 - - 70.20 - - - - 70.07 70.016 B
The photoelectron spectrum of the N2O( 2Π) state shows a complex structure [15], which has been
ascribed to a vibronic coupling of two ionic states within the energy range of the 2Π state [16].
Using the ionization energies deduced from the photoelectron spectrum [15] and the Rydberg formula, all structures observed between 70.0-74.3 nm (17.7-16.7 eV) can be fitted by a single effective quantum number. This would suggest that the supplementary features observed in NO+ pertain to the same Rydberg state. Their absence in the O+ ion yield curve [12] suggests that there exists selective dissociative autoionization of this state into the NO+ channel.
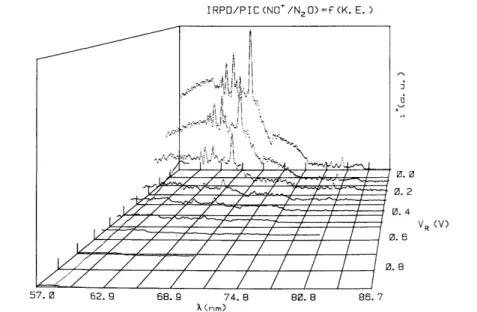
The ion retarding potential difference (IRPD) ionization efficiency curves of NO+, obtained in the way described in section 3.1, are displayed in fig. 5 between VR=0.0-0.9 V. For comparison the ion yield curve of
NO+ observed at VR= - 0.1 V is inserted in this figure.
Fig. 2c shows an example of one IRPD curve for NO+ ions carrying translational energies 0.0 ≤KE≤ 0.11 eV. This curve looks quite similar to the ionization efficiency curve measured at VR = - 0.1 V. However,
there are mainly two wavelength regions showing quite large differences: (i) the step-like increase at 61.68 nm (20.11 eV) is absent in the IRPD curve and (ii) in the wavelength region 70-75 nm (17.7-16.5 eV).
In the latter range two step-like features are observed, followed by autoionization structures. The onsets are measured at 75.02 nm (16.53 ±0.05 eV) and at 74.26 nm (16.70±0.05 eV) and correspond to the ionization energy of N2O in its Ã
2
Σ+ v= 1, 0, 0 and v=0, 0, 1 states [12,15]. On the other hand, the direct dissociative ionization process
occurring through vibronic predissociation of the N2O +
(Ã2Σ+) state, has a thermodynamical onset at 16.57 eV, in good agreement with the onset measured at 16.53 eV. No translational energy has to be involved in this process. At the next threshold at 16.70 eV the NO+ has to carry 14/44 x 160 meV= 50 meV kinetic energy, included in the kinetic energy range 0.0 ≤ K.E. ≤ 0.11 eV ( see fig. 2c ).
To the authors' knowledge this process has never been unambiguously observed by dissociative pho- toionization [12] nor by electroionization [13] mass spectrometry. However, this process has been observed earlier by Orth and Dunbar [ 17 ] by photodissociation of a N2O
+
ion beam.
In the 76-83 nm (16.3-14.9 eV) region, dissociative autoionization is assigned [12,13] to
where the generated electron is known to carry 0.0 eV kinetic energy as shown in detail in fig. 6. The close correlation between the absorption spectrum and the threshold photoelectron spectrum clearly shows that highly excited vibrational levels of the N2O+ ( 2Π) state are populated through autoionization of N2O* Rydberg states
converging to N2O+(Ã 2Σ+). Using these data, a complete energy balance according to
can be established for each individual Rydberg state. The results are listed in table 2. The present results can be compared to those obtained in the earlier published electron impact work [13]. For this purpose the NO+ kinetic energy against electron impact energy diagram is reproduced in fig. 7.
The electroionization onset at 15.29 ± 0.1 eV is unusually higher than the photoionization threshold at 14.93 ± 0.05 eV (83.02 nm). This discrepancy has obviously to be ascribed to the convolution of the weak autoionization structure by the spread in the electron beam energy. The total kinetic energy carried by NO+ at
15.3 eV is 0.63 eV, which has to be compared to an average translational energy of about 0.85 ± 0.1 eV in the photoionization threshold region (see table 2). The meaning of the vertical line (1) in fig. 7 becomes obvious considering the resonant character of the autoionization processes giving rise to NO+ fragments with about the same translational energy. The threshold will not show the linear dependence on the kinetic energy.
Fig. 5. IRPD curves of NO+/N2O for VR=0.055-1.01 V. The photoionization efficiency curve of NO+ observed at
VR=-0.1 V is shown for comparison.
Fig. 6. Photoabsorption spectrum and zero-kinetic energy photoelectron spectrum of N2O.
Greater accuracy is also gained in the final vibrational energy content of the diatomic fragment ion. In the threshold region the lowest vibrational levels of NO+ (X 1Σ+) are v=0 to 4, whereas they were found to be v= 1 to 3 by electron impact [13] (see table 2).
thermal component. This can only fit in the energy balance when the remaining excess energy is entirely converted in vibrational and/or rotational energy of the NO+ fragment. The limits of the NO+ vibrational energy distribution, as expressed by the vibrational quantum number v, are listed in table 2 for each autoionization level.
Table 2. Results of the investigation of the kinetic energy distributions of NO+/N2O arising from dissociative
autoionization in the 83-76 nm wavelength region λ (nm) N2ORydberg[12] KETot max (±0.1 eV) NO+ (X 1Σ+, v) vlowest vdistr. 83.02 onset 0.80 0 2-0 82.32 3dπ/3dσ 0.85 0 3-0 81.72/81.61 4pσ/4pπ (0,0,0) 0.97 0 3-0 81.12 - 0.8 1 3-1 80.42 3dσ 0.5 3 4-3 79.93 4dπ (0,0,0) 1.44 0 4-0 79.17 4dπ (1,0,0) 1.44 0 5-0 78.37 5dπ 1.72 0 5-0 77.50 6dπ 1.1 2 6-2 76.98 7dσ 0.8 4 6-4
Fig. 7. The kinetic energy against electron energy diagram of NO+/N2O obtained by electron impact [13].
For comparison with the electron impact results [13] (see fig. 7) two energy regions have to be considered: (i) the threshold region and (ii) the 15.3-16.5 eV electron energy range. In the former energy range NO+ was found to be distributed between v= 3 and v= 1, whereas in the latter NO+ had to be produced in v= 2. Obviously, the resolution obtained in the present work allows a more detailed description of these dissociative autoionization processes (see table 2). However, both by electron impact [13] and by photoionization the total kinetic energy involved is 1.7eV.
Though one is dealing with dissociative autoionization between 15.3-16.5 eV, the onset energies show a linear dependence on the kinetic energy [see line (2) in fig. 7]. The convolution by the electron beam energy distribution together with the ion kinetic energy spread 0.8-1.7 eV give rise to the observed linear relationship.
Owing to the larger ion signal at shorter wavelength the kinetic energy distribution of NO+ has been
been focussed on autoionization.
Compared to the thermal energy peak present at any wavelength, the relative intensity of the energetic NO+ ions shows drastic changes even within a narrow energy band. This is illustrated in fig. 9.
The drastic changes in the kinetic energy distribution of NO+, induced by autoionization, have been investigated earlier using the Ne(I) resonance line [6]. A close correlation was established between the modification of the kinetic energy distribution of NO+ and the photoelectron spectrum recorded at the same energy. The latter shows strong changes of the relative intensities of the different N2O
+
(Ã 2Σ+) vibrational levels including those that are predissociated by the 4Σ- state. The use of synchrotron radiation would allow a systematic investigation of this effect.
The vertical lines (3) and (4) in fig. 7 at 16.9 eV and 17.6 eV are related to autoionization phenomena [13] observed between 70-75 nm (17.7-16.5 eV), whereas the straight line (4') spreads over the 17.6-19.5 eV energy range. As shown in fig. 3, the NO+ ion signal between 70-75 nm (17.7-16.5 eV) disappears at VR=0.6 eV.
This is in good agreement with the electron impact results (see fig. 7).
As mentioned earlier in this section, this energy region is dominated by autoionization phenomena. On the other hand, no zero-kinetic-energy electrons are detected in the Franck-Condon gap between the à 2Σ+ and the 2Π states of N2O
+
(see fig. 6 ). In the present work only the NO+ ion translational energy has been measured.
In this energy range the electroionization results were interpreted by the predissociation of the 2Π state leading to NO+(X 1Σ+, v) + N(4S). The NO+ ion would be distributed between v = 6-9 [13]. Berkowitz and Eland [ 12 ] proposed the dissociation into NO+ (X 1Σ+) + N(2D), which is nearly isoenergetic with the process NO+(X 1Σ+, v = 9) + N(4S). This point cannot be clarified with the present data.
Fig. 8. Kinetic energy distributions of NO+/N2O measured at different wavelengths between 57-75 nm.
The short-wavelength region extending from 57-71 nm (21.7-17.5 eV) covers the 2Π and the 2Σ+ states of N2O
+
. Between VR=0.61-1.01 V, only the step-like feature at 62 nm (20 eV) is still observed as well as a
small fraction of the underlying continuum extending from 62-70 nm (20-17.7 eV). The NO+ ion yield curves could not be recorded above VR = 1.0 V within reasonable measuring time. However, these rough data are in
good agreement with the electron impact results [13].
4.2. The O+/N2O ions
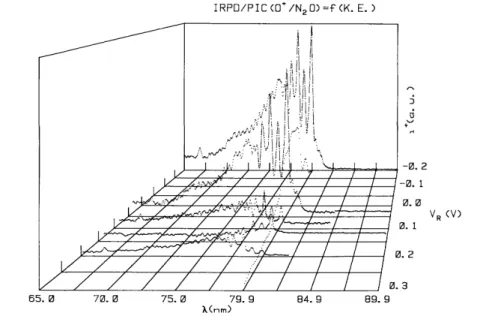
This ion is chosen to show the limitations of the present method. The ionization efficiency curves of O+/N2O, measured between 65-90 nm (19.1-13.8 eV) and -0.2≤VR≤0.2 V, are represented in fig. 10. The ion
retarding potential curve recorded at 79.9 nm ( 15.52 eV) is used for normalization.
Fig. 9. Detail of the kinetic energy distributions of NO+/N2O in the wavelength region 70-75 nm.
Whereas NO+ is observed over a fairly broad translational energy range, O+ shows a sharp thermal or nearly thermal energy distribution and a weak tail. Fig. 10 obviously shows that the O+ ion yield curve decreases sharply at higher VR settings. This leads to very long measuring times not available under the present conditions.
For comparison, the same ion has been investigated over the range 0.0≤VR≤2.3 V by electron impact.
Fig. 10. Photoionization efficiency curves set of 0+/N20 recorded at — 0.2 ≤ FR<0.2 V.
The IRPD curves of O+/N2O obtained by the method described in section 3.1 are shown in fig. 11.
Part of the autoionization structure observed between 66-74 nm (18.8-16.7 eV) in the O+ ionization efficiency curve measured at VR=0.0 V is listed in table 1. The lowest onset is measured at about 81.7 nm (15.17
eV) instead of 81.3 nm (15.25 eV) measured earlier [12] by photoionization. On the other hand, the autoionization peaks between 77-80 nm (16.1-15.5 eV) observed for O+ and NO+ show about the same intensity distribution. Berkowitz and Eland [12] noticed "some differences in intensity ratio". In this respect the ionization efficiency curve recorded at VR=0.097 V is very similar to the curve published in ref. [12] where the peak at 78
nm ( 15.9 eV) dominates. Furthermore, at VR=0.097 V the lowest threshold is measured at 81.0 nm ( 15.30 eV ).
The difference in threshold energy of 0.13 eV is compatible with the measured total kinetic energy of 0.15 eV. Therefore, the differences of the onset and relative intensities could be ascribed to discrimination of thermal or nearly thermal ions. This has already been mentioned [11,18].
Fig. 11. IRPD curves of O+/N2O for FR=0.066—0.216 V. The ionization efficiency curve of O+ recorded at
VR=0.2 V are inserted for comparison.
The lowest onset measured for O+ observed between 0.0≤VR≤0.097 V has to be ascribed [10,11 ] to
where the electron is known to carry zero kinetic energy (see fig. 6). As deduced from the IRPD curves, the autoionization features at about 79.8 nm (15.54 eV), 78.8 nm (15.73 eV) and 78.2 nm (15.86 eV) show a sharp thermal peak and a weak tail extending from 100 meV to above 216 meV. The important thermal part indicates the formation of the N2(X
l
Σg +
, v=l) level whereas the weak tail has to be assigned to the decay into the N2(X l
Σg+, v=0) state involving an increasing amount of translational energy.
5. Conclusions
When properly handled, the ionization efficiency curves of a fragment ion recorded at different retarding potential settings VR enable one to obtain the yield curves of this ion for a preset translational energy
interval, that is the ion retarding potential difference curves. The complete set of these curves allows us to deduce the translational energy distribution of the ion at any desired wavelength.
The data derived from this method have been illustrated in the dissociative photoionization of N2O,
yielding NO+ and O+. The present results are compared to those obtained by photoionization [12]and electroionization [13]. The higher resolution of a photoionization experiment enables one to gain more detail in the molecular ion dissociation. Several details were evinced in the N2O+ decay into the NO+ dissociation channel.
The method described here is shown to be well suited to analyze dissociative autoionization processes. It is also shown that for practical reasons the extent of the ion translational energy range that can be analyzed is essentially restricted by the intensity of the ion signal corresponding to energetic fragment ions.
Acknowledgments
We wish to thank the Belgian Fonds National de la Recherche Scientifique (FNRS) and the Bundesministerium für Forschung und Technologie, FRG, for financial support. We are indebted to H.-W. Jo-chims for his assistance. One of us (R.L. ) is indebted to the European Community for the contract GE1-0018-D(B) within the framework of its LSI-program.
References
[1] R. Locht and J. Schopman, Intern. J. Mass Spectrom. Ion Phys. 15 (1974) 361. [2 ] K. Köllmann, Intern. J. Mass Spectrom. Ion Phys. 17 (1975) 261.
[3] K. Köllmann, J. Phys. B; At. Mol. Phys. 11 (1978) 339.
[4] P.H. Doolittle, R.I. Schoen, K.E. Schubert, J. Chem. Phys. 49 (1968) 5108. [5] W.A. Chupka and J. Berkowitz, J. Chem. Phys. 54 (1971) 5126.
[6] R. Locht, G. Caprace and J. Momigny, Chem. Phys. Letters 111 (1984) 560. [7] J.A.R. Samson, G.C. Angel, O.P. Rustgi, Chem. Phys. Letters 119 (1985) 443.
[8] J.A.R. Samson, T. Masuoka, P.N. Pareek and G.C. Angel, J. Chem. Phys. 86 (1987) 6128. [9] T. Baer, Gas Phase Ion Chemistry, Vol. 1 (Academic Press, New York, 1979) pp. 153. [10] J. Dannacher, Org. Mass Spectrom. 19 (1984) 253.
[11] R. Locht, J. Momigny, E. Rühl, H. Baumgärtel, Chem. Phys. 117 (1987) 305. [12] J. Berkowitz and J.H.D. Eland, J. Chem. Phys. 67 (1977) 2740.
[13] J.L. Olivier, R. Locht and J. Momigny, Chem. Phys. 68 (1982) 201; 84 (1984) 295. [14] G. Hagenow, K. Hottmann and H. Baumgärtel, Chem. Phys. Letters 164 (1989) 395. [15] P.M. Dehmer, J.L. Dehmer and W.A. Chupka, J. Chem. Phys. 73 (1980) 126. [16] H. Köppel, L.S. Cederbaum and W. Domcke, Chem. Phys. 69 (1982) 175. [17] R.G. Orth and R.C. Dunbar, J. Chem. Phys. 66 (1977) 1616.
![Fig. 7. The kinetic energy against electron energy diagram of NO + /N 2 O obtained by electron impact [13]](https://thumb-eu.123doks.com/thumbv2/123doknet/6861364.192043/8.918.221.696.520.826/kinetic-energy-electron-energy-diagram-obtained-electron-impact.webp)