Development of an Evidence-Based Calibration Methodology Dedicated to
Energy Audit of Office Buildings. Part 1: Methodology and Modeling.
Stéphane Bertagnolio1 and Philippe André2 1
Thermodynamics Laboratory, University of Liège, Belgium 2
Department of Environmental Sciences and Management, University of Liège, Belgium
Corresponding email: stephane.bertagnolio@ulg.ac.be
SUMMARY
To promote improvements in the HVAC installations of existing buildings, the article 9 of the EPBD directive establishes mandatory audits and inspections of air-conditioning systems. The development of auditing tools and procedures and the training of future auditors are the main objectives of the HARMONAC project launched in 2007. A dynamic hourly building energy simulation (BES) model is being developed to help the auditor in establishing his diagnosis despite of the lack of data. The development and the implementation of the BES model are presented in this paper. The mains issues of the proposed calibration-based audit methodology are discussed in the present paper. An example of application of the whole methodology (from benchmarking to evaluation of ECMs) is presented in a companion paper.
INTRODUCTION
Environmental concerns and the recent increase of energy costs open the door to innovative techniques to reduce energy consumptions. Buildings represent about 40% of the European energy consumption [1]. Non-residential buildings are part of the main energy consumers and improvement of their energy performance is a major challenge of the 21th century. To this end the European Commission approved the European Directive on Energy Performance of Buildings [2] on 16 December 2002.
To promote improvements in the HVAC plant of existing buildings, the article 9 of the EPBD directive establishes mandatory inspection of air-conditioning systems. Four audit stages are generally distinguished: (1) benchmarking, (2) inspection, (3) detailed audit and (4) investment grade audit. Answering the questions encountered along the whole audit process requires some diagnosis, which has to be established on the basis of the very scarce information currently available: technical data contained in as-built files actually present and, generally, very global recordings of energy consumptions.
Building energy simulation tools can be very helpful when conducting an energy audit. Bbuilding energy simulation tools are mainly used in the frame of an audit procedure for selecting and evaluating energy conservation measures at detailed audit stage. It is now proposed to extend the use of BES models to other steps of the audit process, such as, benchmarking and inspection stages:
- Benchmarking: While normalization is commonly used for benchmarking purposes to allow comparison between data recorded on the studied installation and reference values obtained from case studies or statistics; the use of simulation models allow to
assess directly the studied installation, without any normalization needed. Indeed, applying a simulation-based benchmarking tool allows an individual normalization and avoid size and climate normalization. So, rather than looking for very global weather indexes, it seems rational to use a simulation model and run it over a few thousands of hours corresponding to one typical year. The current capabilities of computers and simulation tools make this approach very efficient and allow considering the climate as it is, without any simplification.
- Inspection/Audit: Global monthly consumptions are generally insufficient to answer all the questions encountered during an inspection or a detailed audit. Even if some very rough results can be expected from the analysis of monthly fuel consumption, global electricity consumption records analysis do not allow to quantify and distinguish the energy consumption related to AC from that related to other electricity consumers. Even if the analysis of the energy bills does not allow identifying with accuracy the different energy consumers present in the facility, the consumption records can be used to calibrate building and system simulation models.
After having been calibrated to recorded data, the baseline model can be used to analyze the actual performance of the building and to identify the main energy consumers (lights, appliances, fans, pumps …). At the end of the audit process, selected energy conservation opportunities can be implemented, assessed and compared to each other.
MODEL CALIBRATION FOR AUDIT PURPOSES
Calibration cannot be avoided when pretending applying a BES model to an existing building. In the frame of an energy audit and in addition to pre or post-retrofit evaluation of ECMs, calibrated BES models could be used along the auditing process to help the auditor identifying points needing further investigations. For this auditing targeted work, simulation models and calibration methods adapted to the needs and constrains of energy audit will be developed.
Numerous authors have calibrated detailed simulation models (DOE-2, EnergyPlus, Trnsys…), developed calibration procedures and attempted to compile calibration guidelines and manuals. As explained by Reddy [3], various calibration methods already exist, including manual iterative methods, graphical methods, methods based on specific tests and automatic methods.
Automatic methods are very powerful but are generally heavy to handle and limited because of their reduced flexibility (pre-defined required data and impossibility to integrate specific monitoring data in the calibration process). Semi-automatic methods including heuristic steps are a good compromise but still have limited flexibility. Moreover, these methods are fully black-box methods and can lead to unrealistic calibrated models if not well controlled and understood by the user. Therefore, these methods don’t suit very well with energy audit (where available data and measurements can vary a lot from cases to cases).
Methods combining manual iterations and graphical/statistical tools seem to be well adapted to energy audit purposes. These methods are very flexible and could be adapted to most cases. Moreover, these methods allow the auditor identifying, visualizing and apprehending the behavior of the building under study during the calibration process. However, attention should be paid to keep the calibration method systematic and reproducible and to integrate sensitivity issues.
To reach these objectives, there is a real need for simple, robust and easy-to-use BES models and an associated calibration method. A compromise has to be found between model accuracy, reliability, flexibility and simplicity. It should be noticed that, generally, simplified models differ from detailed ones mainly in the definition of the building and the HVAC system but are also able to perform accurate simulations.
A suite of calculation tools and an audit methodology are being developed in the frame of the HARMONAC project [4] to help the auditor in establishing his diagnosis despite of the lack of data:
- The first tool (“Bill Analyzer”) is dedicated to a preliminary analysis of the recorded data (comparison between actual and reference consumptions, thermal and electrical signatures, degree-days data normalization…)
- The second tool (“SimBench”) is used to perform a code-compliant simulation-based benchmarking of the installation.
- The third tool (“SimAudit”) is calibrated by means of the information gathered from inspection stage to evaluation of selected energy conservation measures (ECMs). The “SimBench” and “SimAudit” tools are based on the same simplified dynamic hourly building energy simulation (BES) model and vary only in the inputs used to run the simulation.
The development, the implementation and the use of the three tools are presented in this paper. The mains issues of the proposed calibration-based audit methodology are discussed. An example of application of the whole methodology (from benchmarking to evaluation of ECMs) is presented in a companion paper.
CALIBRATION-BASED AUDIT METHODOLOGY Preliminary analysis and simulation-based benchmarking The first step of the audit methodology consists in:
- Gathering the as-built and utility data;
- Applying a first treatment and analysis method to this data; - Using the BES model to perform benchmarking.
First, classical analysis methods, such as thermal and electrical signatures will be used to determine a maximum of information from the utilities data. Heating signature will be used to determine the global heat transfer coefficient of the building which can be cross-checked by a “design analysis” [5]. As-built data will also be collected and summarized to determine the main consumption items of the building.
Secondly, the simulation-based benchmarking consists in a comparative evaluation of the building performance realized by means of the developed BES model. This can be done by describing the main characteristic of the building and its use and by assuming this building equipped with a typical HVAC system presenting standard performance [6]. The HVAC system performances are defined in accordance with recent European energy efficiency standards (EPBD-CEN standards series) and international reference standards [7]. These two successive preliminary analyses are useful to decide if any potential energy saving options should be studied in the building and if further investigations are needed.
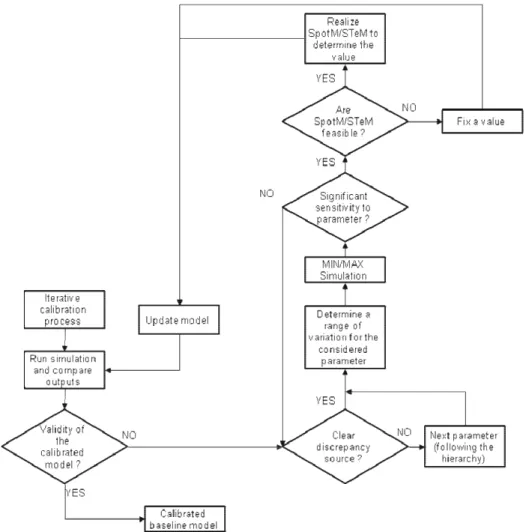
If some potential savings can be expected, the calibration-based audit process can be launched. The iterative calibration method is fully integrated into the audit methodology since it includes all the measurement and calibration issues in order to result in a calibrated baseline model satisfying predefined tolerances and criteria (Figure 1). Before making any additional measurement, the first task of the inspection consists in preparing an “as-built” input file to run a first simulation of the actual building and its system. Default values are used for unknown parameters. This simulation run is the first step of the calibration process.
Figure 1. Graphical representation of the manual iterative “evidence based” calibration method
These very first simulation results should already be compared to the recorded data used to perform calibration (usually utility billing data). The next steps will consist in identifying the source of discrepancy between the simulation and the real situation. If the source of the problem does not appear as evidence, the user should consider a first influencing parameter. The main parameters (or parameters categories) of the BES model are classified as function of their impact on simulation outputs for different building-HVAC configurations. This classification work is based on an extensive sensitivity analysis based on typical building and systems typologies.
A range of variation for the selected parameter will be defined and two simulation runs (“min/max simulation”) will be performed. If the parameter has not a significant influence on the simulation outputs, the next influencing parameter should be considered. If it is not the case (the parameter confirms the result of the sensitivity analysis and has a significant influence), spot or short-term measurements should be looked for to quantify this item. If the
measurement of such item is not feasible, a classical iterative calibration process, starting from a guess value, should be applied. If the measurement can be done, the recorded value will be used to update the simulation model and a new simulation run will be done. Then, the process continues until the calibration tolerances/criteria are satisfied.
Selection and evaluation of ECMs
Then, the calibrated baseline model can be used to evaluate the selected ECMs. Of course, the selection of ECMs is purely heuristic and results of the analysis and observations of the auditor. Typical weather data sets (TRY or TMY) should be used to evaluate the ECMs after their implementation in the baseline model. The uncertainty on computed savings is then evaluated by means of the CV(RMSE)-based method proposed by ASHRAE [8].
MODELING
The same modeling bases are used for both the benchmarking and the auditing tools. A building zone model is used to compute the heat, cold and humidity needs of the building. A secondary HVAC system model and a plant model are used to converts these demands in system loads and final energy consumptions (Figure 2).
Building zone model
The simplified building zone model is based on the simple hourly method described in ISO13790-2007 [9]. The R5-C1 network is solved on an hourly basis (Figure 2). The simplicity of this implementation ensures an easy parameterization work (done in accordance with the related CEN standards [10]), a high flexibility and an easy control of the level of details of the model. The use of Euler’s method to solve the unique integration ensures quick and robust operation of the model.
a) b)
Figure 2. a) Global building-HVAC model block diagram b) ISO13790 simple hourly method RC network
Each building zone is described by three distinct temperatures nodes: an indoor air temperature node, an equivalent surface node (mean temperature between indoor temperature and mean radiant temperature) and a thermal mass temperature. Equivalent sol-air outdoor temperatures are used to take into account solar radiation and infrared losses on opaque surfaces. A variable solar heat gain coefficient (function of the incidence angle) is used to describe glazed surfaces. Convective and radiation part of the heat fluxes related to entering solar gains, internal generated gains (lighting, appliances…) and sensible heating/cooling rates are computed and distributed over the three nodes. A similar solving method is used to
solve the humidity model of the zone and takes the water flow rates related to occupancy, internal process, infiltration and ventilation into account.
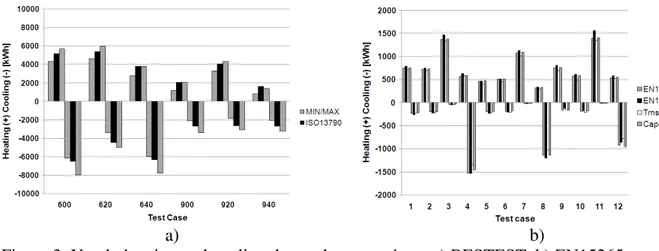
The present implementation of this calculation method has been validated through both IEA-BESTEST [11] and EN15265 [12] comparative validation procedures. Both validation procedures use a rectangular room as a basis for the various test cases.
a) b)
Figure 3. Yearly heating and cooling demands comparison. a) BESTEST. b) EN15265
Figure 3 shows that this simple model is able to provide acceptable values of yearly heating and cooling demands for various conditions (schedule, setpoints, gains, ventilation), orientations and configurations (light or heavy envelope components). In both cases, the model provides results similar to the reference values or to the ones provided by more detailed simulation software.
a) b)
Figure 4. BESTEST hourly validation results. a) heating and cooling demands. b) free floating temperature conditions.
Even if the considered building zone model is not aimed at providing realistic hourly values of temperatures and demands, it appears that the results are again in good accordance with the values provided by more detailed simulation software (Figure 4) and that this simplified model is accurate enough for the considered application.
HVAC System Model
A whole secondary HVAC system model is connected to the zone model: it includes common CAV and VAV AHUs components (air recovery system, economizer, heating coils, cooling
coil, humidification system, fans…) and terminal units (fan coil units, induction units, radiant systems, reheat boxes…). The main equations of these models were presented in previous papers [6].
The primary HVAC system model includes various configurations of chillers (scroll, screw and centrifugal chillers; air and water condensers) and of water coolers (dry cooler, direct and indirect contact cooling towers). Three types of water boilers are already available: On-Off burners, High-Low-Off burners and Modulating burners. All these models uses performances curves generated by means of manufacturer data or detailed validated reference models [9]. Default performances based on literature and market surveys are provided for each HVAC component. Figure 5 shows the default normalized performance curves generated by means of a detailed validated reference model for water boilers.
Figure 5. Default part load performance curves for water boilers
All auxiliaries (pumps, circulators and fans) related to the various HVAC components (terminal units, coils, cooling towers, boiler burner…) are also taken into account in a simplified way: default values of specific fan and pump powers based on manufacturers data are used to compute the related electricity use. Of course, all these parameters may be calibrated by the user if needed or the provided default values may be used in the case of a lack of data.
This simplified BES model has been implemented in an equation Solver [14]. This implementation increases the flexibility of the model and makes it easily readable and understandable for the user.
DISCUSSION
A calibration-based audit methodology was presented in this paper. It has been shown how simplified building energy simulation tools can support the auditor all along the audit process, from early benchmarking to inspection and evaluation of ECMs. The calibration-based methodology relies on an iterative evidence-based calibration process. The iterative process uses the simulation tool to indicate issues requiring further investigations to the user. The calibration of the BES model progresses as well as the data are collected by the auditor (through surveys and inspections, interviews and short-term or spot-measurements). The validity of the calibration is checked by means of the available energy use data (typically monthly energy billing data).
The modeling bases were briefly presented. Focus has been given to the comparative validation of the simplified building zone model. Simplified HVAC components models have been illustrated by an example.
ACKNOWLEDGEMENT
This work is performed with the support of the Walloon Region of Belgium and of Intelligent Energy Europe programme. The sole responsibility for the content of this document lies with the authors. It does not represent the opinion of the Community. The European Commission is not responsible for any use that may be made of the information contained therein.
REFERENCES
1. Pérez-Lombard, L., Ortiz, J., Pout, C. 2008. A review on buildings energy consumption
information. Energy and Buildings, Vol. 40, pp. 394-398.
2. Directive 2002/91/EC of the European Parliament and of the Council of the European Union
of 16 December 2002 on the Energy Performance of Buildings (EPBD).
3. Reddy, T.A. 2006. Literature review on calibration of building energy simulation programs:
uses, problems, procedures, uncertainty and tools. ASHRAE Transactions, Vol. 112(1), pp. 226-240.
4. Knight, I.. 2009. HarmonAc: Harmonizing Air Conditioning Inspection and Audit Procedures
in the Tertiary Building Sector. Intelligent Energy Europe programme.
5. Bertagnolio, S., Lebrun, J., Hannay, J., Aparecida Silva, C. 2008. Simulation – assisted audit
of an air conditioned building.Proceedings of the 8th International Conference for Enhanced Building Operations, Berlin, Germany
6. Bertagnolio S., Lebrun J. 2008. Simulation of a building and its HVAC system with an
equation solver. Application to benchmarking. Building Simulation : An International Journal. Vol. 1, pp 234-250.
7. ASHRAE. 2007. ANSI/ASHRAE/IESNA Standard 90.1-2007, Energy Standard for Buildings
Except Low-Rise Residential Buildings. Atlanta: American Society of Heating, Refrigerating and Air-Conditioning Engineers, Inc.
8. ASHRAE. 2002. ASHRAE Guideline 14-2002: Measurement of energy demand and savings.
Atlanta: American Society of Heating, Refrigerating and Air-Conditioning Engineers, Inc.
9. ISO/FDIS 13790:2007. Energy performance of buildings – Calculation of energy use for space
heating and cooling.
10. ISO 13786:2007. Thermal performance of building components – Dynamic thermal
characteristics – calculation methods.
11. Judkoff, R., Neymark, J. 1995. International Energy Agency Building Energy Simulation Test
(BESTEST) and Diagnostic Method. National Renewable Energy Laboratory, U.S. D.O.E.
12. EN 15265:2007. Thermal performance of buildings – Calculation of energy needs for space
heating and cooling using dynamic methods – General criteria and validation procedures.
13. Bourdouxhe, J.-P., Grodent, M., Lebrun, J., Saavedran C. 1999. ASHRAE HVAC1 Toolkit :
A Toolkit for Primary System Energy Calculation. Atlanta : American Society of Heating, Refrigerating and Air-Conditioning Engineers, Inc.
14. Klein., S.A. 2009. EES: Engineering Equation Solver, User manual. F-chart software.