HAL Id: hal-03127756
https://hal.archives-ouvertes.fr/hal-03127756
Preprint submitted on 1 Feb 2021
HAL is a multi-disciplinary open access
archive for the deposit and dissemination of
sci-entific research documents, whether they are
pub-lished or not. The documents may come from
teaching and research institutions in France or
abroad, or from public or private research centers.
L’archive ouverte pluridisciplinaire HAL, est
destinée au dépôt et à la diffusion de documents
scientifiques de niveau recherche, publiés ou non,
émanant des établissements d’enseignement et de
recherche français ou étrangers, des laboratoires
publics ou privés.
D-JNDQ: LEARNING IMAGE QUALITY FROM
JUST NOTICEABLE DIFFERENCES
Ali Ak, Andreas Pastor, Patrick Le Callet
To cite this version:
Ali Ak, Andreas Pastor, Patrick Le Callet. D-JNDQ: LEARNING IMAGE QUALITY FROM JUST
NOTICEABLE DIFFERENCES. 2021. �hal-03127756�
D-JNDQ: LEARNING IMAGE QUALITY FROM JUST NOTICEABLE DIFFERENCES
Ali Ak, Andr´eas Pastor, Patrick Le Callet
IPI, LS2N, University of Nantes, France
ABSTRACT
According to recent psycho-physics studies, the visibility of distortions is highly correlated with the overall perceived quality of a certain stimulus. Subjective quality evaluation of images relies mainly on mean opinion scores (MOS) to provide ground-truth for measuring image quality on a con-tinuous scale. Alternatively, just noticeable difference (JND) defines the visibility of distortions as a binary measurement based on an anchor point. By using the pristine reference as the anchor, the first JND point can be determined. This first JND point provides an intrinsic quantification of the visi-ble distortions within the stimulus. Therefore, it is intuitively appealing to develop a quality assessment model by utiliz-ing the JND information as the fundamental cornerstone. In this work, we use the first JND point information to train a Siamese Convolutional Neural Network to predict image quality scores on a continuous scale. To ensure generaliza-tion, we first process the input images to acquire achromatic responses. Cross dataset evaluation of the proposed model on the TID-2013 dataset provides a competitive correlation with MOS, proving the generalization of the model on unseen dis-tortion types and supra-threshold disdis-tortion levels.
Index Terms— Image Quality, Just Noticeable Differ-ence, Siamese Convolutional Neural Network
1. INTRODUCTION
Subjective assessment of image quality commonly relies on collecting mean opinion scores (MOS) from a set of ob-servers, as it provides a continuous image quality ment. Just Noticeable Difference provides a binary measure-ment to quantify the perceptual differences between a given image pair, and thus could serve as a potential workaround for quality prediction. It is defined as the smallest intensity change of a stimuli, which can be noticed by the human vi-sual system(HVS). Concisely, when the 1stJND is obtained
by using the pristine reference as an anchor, it also repre-sents the minimum visible distortion intensity. In another words, it measures sub-threshold and near-threshold distor-tions. Without loss of generality, the following JNDs, i.e., the 2nd, 3rd, ..., nthJND, are the perceptual difference obtained
This work has received funding from the European Union’s Horizon 2020 research and innovation programme under the Marie Sklodowska-Curie Grant Agreement No. 765911 (RealVision)
by utilizing the previous JND point as the anchor. Since the anchor points are distorted images, these JND points pro-vide information regarding to supra-threshold distortions. the Only the first JND measures to which extend observers may start to notice the distortions when degrading the quality, while the following JNDs only provide preferences infor-mation between different distortion levels. Since the first JND point [1] indicates directly the minimum noticeable distortion-intensity, it may also reveal how our HVS perceive the distortions quantitatively. It is thus of great potential to be explored for the development of perceptual based quality assessment metric.
Recently, several novel JND datasets were released for the measurement of the visual differences between different distortion levels [1, 2, 3, 4]. Nonetheless, the collected JND points of the same content may have high variation among ob-servers. Therefore, additional models are often used to fuse observer responses into one single JND point [5].
Identifying the JND points of certain content from one ob-server requires a series of comparisons between pairs. Lim-ited by the budget, existing datasets contain only a handful of SouRce Content (SRC) and distortion types, i.e., the Hy-pothetical Reference Circuit (HRC) [1, 2]. There may not be sufficient data to develop a learning-based model directly. Therefore, it is inevitable to adopt alternative approaches to overcome the problem of lack of training data. For instance, transfer learning was adopted in [6] to predict Satisfied User Ratio (SUR) using the MCL-JCI dataset [1]. Siamese Con-volutional Neural Network (CNN) was frequently adopted in the quality domain for predicting the quality-ranking of the stimuli, where pairwise inputs indirectly augment the limited data.
To this end, in this work, we proposed1to train a Siamese
CNN by exploiting the perceptual information provided by the first JND. Furthermore, to further ensure model gener-alization with limited data, we also exploit the intermediate perceptual representation introduced in the Optical and Reti-nal Pathway model[7] to bridge the gap between the percep-tual distortion space within HVS and the latent representation output by our Siamese network.According to experimental results on the TID-2013 dataset [8], the proposed model achieves competitive performances compared to state-of-the-art quality metrics. It was also verified via experiments that
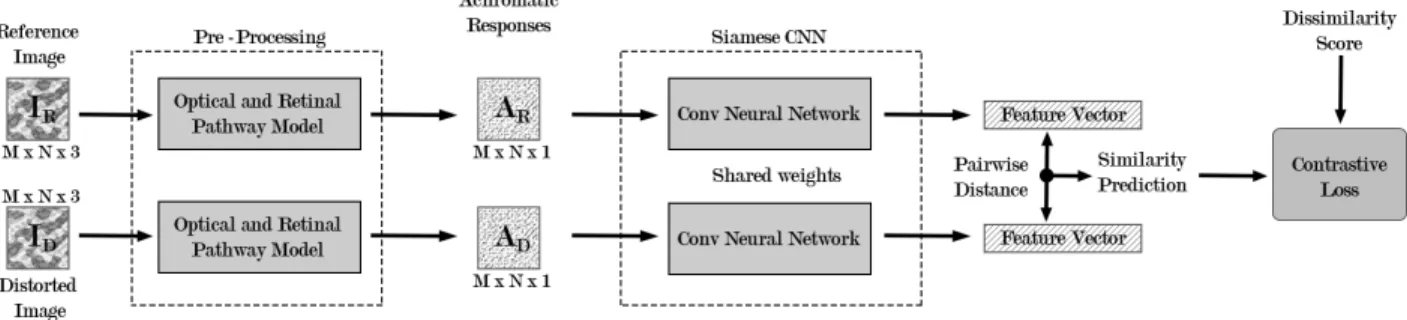
Fig. 1. Diagram of the proposed model where IR/Dindicates the input images, and AR/Ddenotes the achromatic responses.
the model is generalized in image quality task for unseen distortion types in both sub-threshold and supra-threshold ranges.
2. RELATED WORKS
There are several JND datasets in the literature for image compression and video compression with varied pre-process approaches to obtrain accurate and representative JNDs. MCL-JCI dataset [1] is composed of 50 source image (SRC) with varying number of JND points on JPEG compression levels. After getting the raw JND points, a Gaussian mixture model was adapted to generate a staircase quality function from a set of JND points [5]. MCL-JCV dataset was re-leased from [3], which contains JND data obtained from 50 observers prepossessed by a similar staircase quality func-tion designed for H.264/AVC. JND-PANO dataset contains JND samples for 40 reference panoramic images over JPEG compression levels[2]. VideoSet is a large-scale dataset that provides JND samples for H.264 compression levels at vary-ing resolution [9]. PWJNDInfer is consist of JND samples over 202 reference images over compression levels.
The booming of JND subjective studies over the past sev-eral years has sparked a lot of interest and have spurred a lot of interesting ideas for the development of JND prediction mod-els. Liu et al. proposed a picture-wise binary JND prediction model by defining JND prediction as a multi-label classifica-tion task and reducing it to a series of binary classificaclassifica-tion problems [10]. Fan et al. proposed a model to predict the sat-isfied user ratio and the first JND point over MCL-JCI dataset. Analogously, Zhang et al. proposed a satisfied user ratio pre-diction model for video compression distortions [11]. Ac-cording to our best knowledge, this is the first work that uti-lizes the first JND points to predict overall image quality on a continuous scale for various distortion types in sub-threshold and supra-threshold ranges.
3. PROPOSED MODEL
Human Visual System is a very complex system and not yet fully understood. Based on relevant studies [12], it can mainly
be split into four broad parts as optical, retinal, lateral genic-ulate nucleus, and visual cortex processing. In the proposed framework, as a preliminary study, we simplify our approach by dividing this complex process into two. We first use an ex-isting Optical and Retinal Pathway model to pre-process in-put images, i.e., the Optical and Retinal Pathway proposed by Mantiuk et al. This module provides an estimation of the achromatic responses for displayed images. Optical and Retinal processing of HVS highly affects the visibility of dis-tortions. Hence, including this module as a pre-processing tool simplifies the similarity prediction task. After acquiring achromatic responses of both the reference and distorted im-ages, the remaining task is to predict the similarity between the achromatic responses inputs. Regarding its proven suc-cess in visual similarity, and pairwise ranking prediction tasks [13], Siamese CNN was employed to predict the similarity be-tween input pair. In general, Siamese networks are equipped with two or more identical networks with shared weights to learn the embedding between a pair or triplet of input data. More concretely, we aim to learn the first JND point distribu-tions of the observers using the Siamese network.
The overall structure of the proposed model is shown in Fig. 1. All the achromatic responses are acquired by pre-processing input RGB images with the optical and retinal pathway model from HDR-VDP 2. Then, they are fed into the Siamese CNN to extract their latent representation, i.e., feature vectors. Afterwards, the pairwise distance between outputted feature vectors is calculated to compute a similarity score. During training, contrastive loss [14] is used between the predicted outputs and the ground truth dissimilarity scores acquired from MCL-JCI dataset. In the following sections, a detailed information is given regarding the pre-processing stage and the Siamese CNNs.
3.1. Optical and Retinal Pathway Model
Optical and Retinal Pathway is modeled as a combination of 4 sub-modules in the HDR-VDP 2 [7]. The first module ac-counts for the light scattering that occurs in the cornea, lens, and retina. It is defined by a modulation transfer function esti-mated via psychophysical studies. The second module
calcu-Fig. 2. Reference and distorted image (QP=17) with corre-sponding achromatic responses for SRC-7 in MCL-JCI. lates the probability of a photo-receptor sensing a photon at a corresponding wavelength. It outputs cone and rod responses of the input image. The third module mimics the non-linear response to light of the photo-receptors. It is modeled as a non-linear transducer function. The final module converts the non-linear responses into joint cone and rod achromatic re-sponses by simple summation.
By incorporating Optical and Retinal Pathway into pre-processing stage, the masking effects occurring at this stage of the visual pipeline could be well taken into account. By enhancing or masking the distortions visibility with existing knowledge in the domain, the training complexity of the simi-larity network could be well simplified and accelerated. Nev-ertheless, it enhances the generalization of the model for tack-ling not only unseen distortion types but also supra-threshold distortion values.
3.2. Siamese Convolutional Neural Network
The Siamese network is utilized as a feature extractor with-out any fully connected layers. On top of this backbone, we directly compute the pairwise distances. This architecture fa-cilitates arbitrary input resolutions. We design our Siamese network from the scratch. It is consists of 5 convolutional layers with batch normalization, ReLu activation layers. To reduce the spatial resolution, a stride of 2 was adapted for the first 4 convolutional layers.
For the last layer of the network, a Sigmoid activation function is employed without stride. After flattening the out-put feature vector, they are then used to calculate the similar-ity score between the reference and distorted images.
4. DATASET AND TRAINING DETAILS MCL-JCI dataset [1] was used to train our network. MCL-JCI dataset contains 50 SRCs with a resolution of 1920 × 1080. Each SRC is encoded using JPEG encoder [15] with vary-ing Quantization Parameter (QP) levels in a range of [0, 100], where 100 correspond to the highest quality. This results in a
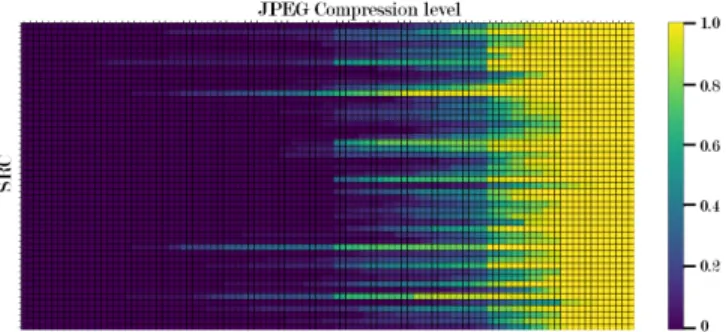
Fig. 3. Dissimilarity scores acquired by using first JND steps of each observer. Each row represents an SRC. Columns are ordered from the highest QP level to lowest, left to right. total of 5050 images including the reference images. 30 sub-jects provided 3 to 8 JND points for each SRC image with the bisection method. Individual JND points were fused for each SRC [5].
As described in Sec. 3.1, reference and distorted images from the MCL-JCI dataset are first converted into achromatic responses using the Optical and Retinal Pathway model from HDR-VDP 2. The obtained achromatic responses share the same spatial resolution with input images. However, pixel values are represented in a single channel, resulting in an ar-ray of size 1920 × 1080 × 1.
After experimenting on the MCL-JCI dataset, it was ob-served that the task of detecting the first JND point and fol-lowing JND points are different. While identifying the first JND point, an observer tried to identify the difference be-tween the reference and distorted image. However, for the later JND points, this task gradually turned into a preference task, i.e., which stimulus is preferred compared to the other. More specifically, instead of “at which QP level the distortion becomes visible”, question evolved into “at which QP level the distortion becomes more disturbing”. This observation encourages us to utilize only the first JND point for labeling the training dataset. In order to capture the uncertainty of the observers, we utilized the individual observer scores as done in [16, 6]. For each SRC, uncompressed image was paired with 100 compressed images with different QP levels. Each pair was assigned with a dissimilarity score ranging from 0 to 1. It is defined by the number of observers, whose JND points are beyond the corresponding QP level. In Fig. 3, each SRC is represented by a line. With a decreasing QP level, the dissimilarity between the reference and distorted image increases.
After pre-processing the dataset as described above, we conducted hyper parameter tuning for the Siamese network. Contrastive loss function was used with a batch size of 32 during training. We found out that 0.03 learning rate with Adam optimizer provides us the best convergence speed and lowest validation loss with the final network structure. Fi-nally, Siamese network trained for 100 epochs over the train-ing dataset with the optimal hyper parameters. We also
exper-imented with weight decay and regularization terms during hyper parameter search, however we observed no improve-ment on training convergence or model accuracy.
5. EVALUATION AND RESULTS
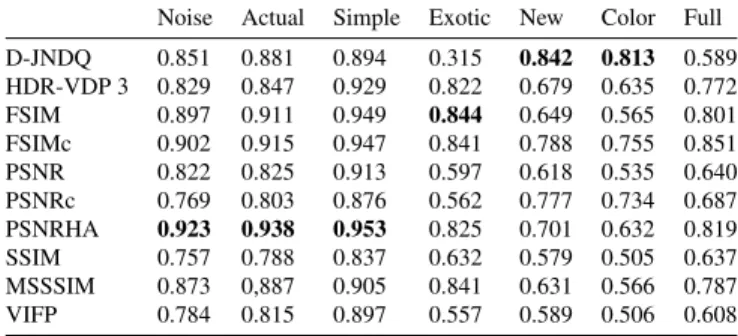
Table 1. SROCC values for selected metrics in TID-2013
Noise Actual Simple Exotic New Color Full D-JNDQ 0.851 0.881 0.894 0.315 0.842 0.813 0.589 HDR-VDP 3 0.829 0.847 0.929 0.822 0.679 0.635 0.772 FSIM 0.897 0.911 0.949 0.844 0.649 0.565 0.801 FSIMc 0.902 0.915 0.947 0.841 0.788 0.755 0.851 PSNR 0.822 0.825 0.913 0.597 0.618 0.535 0.640 PSNRc 0.769 0.803 0.876 0.562 0.777 0.734 0.687 PSNRHA 0.923 0.938 0.953 0.825 0.701 0.632 0.819 SSIM 0.757 0.788 0.837 0.632 0.579 0.505 0.637 MSSSIM 0.873 0,887 0.905 0.841 0.631 0.566 0.787 VIFP 0.784 0.815 0.897 0.557 0.589 0.506 0.608
Table 2. SROCC values with and without pre-processing.
Noise Actual Simple Exotic New Color Full
A.R. Input 0.851 0.881 0.894 0.315 0.842 0.813 0.589
RGB Input 0.742 0.750 0.801 0.141 0.703 0.734 0.446
It is worth mentioning that our model was trained only on JPEG distortions with the first JND. To prove the gen-eralization of the proposed model on unseen distortions and novel supra-threshold distortion levels, we conducted a cross-dataset evaluation on the TID-2013 cross-dataset [8]. TID-2013 dataset contains 24 different distortions including but not lim-ited to noise, blur, transmission error, compression distor-tions. They are categorized into 6 overlapping groups. In total, there are 3000 distorted images with varying distortion intensity and distortion types.
We tested the model on all 3000 images without any pre-training. We used the scripts provided by the authors to cal-culate the correlation of between the predicted results and the MOS. As such, correlation results are directly comparable with other metric correlations acquired by the authors. Ta-ble 5 reports the Spearman rank order correlation coefficients of the proposed model and the other methodologies provided by [8]. The proposed model , i.e., D-JNDQ, provides com-petitive results with the compared metrics in Noise, Actual and Simple categories and providing better results in New and Color category of distortions compared to other evalu-ated metrics. The proposed model achieved the lowest per-formance on the subset of exotic category. This is mainly due to the preferential nature of the distortions in this category. For distortions, such as local block-wise distortion, detecting the distortion plays a minimal role since the distortions are visible at all levels with different variations rather than dif-ferent intensities. Therefore, we expected a poor prediction performance in this category, which also reduces the overall correlation results. Table. 2 depicts the ablation study results. Best model parameters for each input type was trained for same amount of iterations. Results show that the model with
Fig. 4. Metric performances on TID-2013 dataset excluding part of the ”Exotic” category.
achromatic response input has a higher correlation with the MOS compared to the one using RGB inputs.
In addition to Spearman correlation evaluation, we also conducted an analysis on the performance of identifying sig-nificant pairs. In this analysis, we have excluded the afore-mentioned 4 distortion types (out of total 24 types) from the “Exotic“ category. We followed the strategy proposed in [17] to stress out the performances of considered models, readers are recommended to refer to [17] for more details. In Fig. 4, the left sub-figure presents the area under curve (AUC) values for each metric at identifying significant and non-significant pairs. Similarly, right figure shows AUC values for each met-ric in identifying better or worse image pairs, while the mid-dle figure indicates the accuracy of the metric in terms of dis-tinguishing better or worse images in significant pairs. Al-though there is no significant difference in many of the metric performances, proposed metric (D-JNDQ) has a competitive performance in identifying significant versus similar pairs. For better/worse analysis, all metrics seem to perform well overall. D-JDNQ, HDR-VDP 3, FSIM and FSIMc have a significantly better performance than the rest of the evalu-ated metrics in terms of AUC values. D-JNDQ, HDR-VDP 3, FSIMc and PSNRc have more than 98% accuracy on identify-ing whether a stimulus within a significant pair is significantly better or worse than another.
6. CONCLUSION
We propose a learning based metric, D-JNDQ trained using the first JND point information. The optical and retinal path-way model from HDR-VDP 2 is used as a pre-processing module to improve performance of the metric. Our exper-imental results show that the metric is well generalized in quality assessment of various types of distortions in both sub and supra threshold intensities. It is demonstrated that the first JND points provide rich information for image quality assess-ment. Additionally, proposed metric shows poor performance for certain distortion types, where the image quality task is re-lated to distortion preference rather than distortion visibility. Since we utilized a distortion visibility database to develop the metric, this is not a surprising outcome. We also believe that the proposed approach can be extended on video quality evaluation task following a similar recipe.
7. REFERENCES
[1] Lina Jin, J. Lin, Sudeng Hu, H. Wang, P. Wang, I. Kat-savounidis, Anne Aaron, and C.-C. Jay Kuo, “Statis-tical study on perceived jpeg image quality via mcl-jci dataset construction and analysis,” electronic imaging, vol. 2016, pp. 1–9, 2016.
[2] Xiaohua Liu, Zihao Chen, Xu Wang, Jianmin Jiang, and Sam Kowng, “Jnd-pano: Database for just notice-able difference of jpeg compressed panoramic images,” Sept. 2018, 19th Pacific-Rim Conference on Multime-dia (PCM 2018) ; Conference date: 09-2018.
[3] H. Wang, W. Gan, S. Hu, J. Y. Lin, L. Jin, L. Song, P. Wang, I. Katsavounidis, A. Aaron, and C. . J. Kuo, “Mcl-jcv: A jnd-based h.264/avc video quality assess-ment dataset,” in 2016 IEEE International Conference on Image Processing (ICIP), 2016, pp. 1509–1513. [4] Haiqiang Wang, Ioannis Katsavounidis, Jiantong Zhou,
Jeong-Hoon Park, Shawmin Lei, Xin Zhou, Man-On Pun, Xin Jin, Ronggang Wang, Xu Wang, Yun Zhang, Jiwu Huang, Sam Kwong, and C.-C. Jay Kuo, “Videoset: A large-scale compressed video quality dataset based on JND measurement,” CoRR, vol. abs/1701.01500, 2017.
[5] S. Hu, H. Wang, and C. . J. Kuo, “A gmm-based stair quality model for human perceived jpeg images,” in 2016 IEEE International Conference on Acoustics, Speech and Signal Processing (ICASSP), 2016, pp. 1070–1074.
[6] C. Fan, H. Lin, V. Hosu, Y. Zhang, Q. Jiang, R. Hamza-oui, and D. Saupe, “Sur-net: Predicting the satisfied user ratio curve for image compression with deep learning,” in 2019 Eleventh International Conference on Quality of Multimedia Experience (QoMEX), 2019, pp. 1–6. [7] Rafal Mantiuk, Kil Joong Kim, Allan G. Rempel, and
Wolfgang Heidrich, “Hdr-vdp-2: A calibrated visual metric for visibility and quality predictions in all lumi-nance conditions,” ACM Trans. Graph., vol. 30, no. 4, July 2011.
[8] Nikolay Ponomarenko, Lina Jin, Oleg Ieremeiev, Vladimir Lukin, Karen Egiazarian, Jaakko Astola, Benoit Vozel, Kacem Chehdi, Marco Carli, Federica Battisti, and C.-C. Jay Kuo, “Image database tid2013: Peculiarities, results and perspectives,” Signal Process-ing: Image Communication, vol. 30, pp. 57 – 77, 2015.
[9] Haiqiang Wang, Ioannis Katsavounidis, Jiantong Zhou, Jeonghoon Park, Shawmin Lei, Xin Zhou, Man-On Pun, Xin Jin, Ronggang Wang, Xu Wang, Yun Zhang, Jiwu Huang, Sam Kwong, and C. C. Jay Kuo, “Videoset: A large-scale compressed video quality dataset based on jnd measurement,” 2017.
[10] H. Liu, Y. Zhang, H. Zhang, C. Fan, S. Kwong, C. . C. J. Kuo, and X. Fan, “Deep learning-based picture-wise just noticeable distortion prediction model for im-age compression,” IEEE Transactions on Imim-age Pro-cessing, vol. 29, pp. 641–656, 2020.
[11] X. Zhang, C. Yang, H. Wang, W. Xu, and C. . C. J. Kuo, “Satisfied-user-ratio modeling for compressed video,” IEEE Transactions on Image Processing, vol. 29, pp. 3777–3789, 2020.
[12] Xinbo Gao, Wen Lu, Dacheng Tao, and Wei Liu, “Im-age quality assessment and human visual system,” Pro-ceedings of SPIE - The International Society for Optical Engineering, vol. 7744, 07 2010.
[13] S. Roy, M. Harandi, R. Nock, and R. Hartley, “Siamese networks: The tale of two manifolds,” in 2019 IEEE/CVF International Conference on Computer Vi-sion (ICCV), 2019, pp. 3046–3055.
[14] R. Hadsell, S. Chopra, and Y. LeCun, “Dimensionality reduction by learning an invariant mapping,” in 2006 IEEE Computer Society Conference on Computer Vision and Pattern Recognition (CVPR’06), 2006, vol. 2, pp. 1735–1742.
[15] “Independent jpeg group, jpeg image compression soft-ware,” http://http://www.ijg.org, Accessed: 2021-01-22. [16] Ali Ak and Patrick Le Callet, “Towards Perceptually Plausible Training of Image Restoration Neural Net-works,” in International Conference on Image Process-ing Theory, Tools and Applications, Istanbul, Turkey, Nov. 2019.
[17] L. Krasula, K. Fliegel, P. Le Callet, and M. Kl´ıma, “On the accuracy of objective image and video qual-ity models: New methodology for performance evalua-tion,” in 2016 Eighth International Conference on Qual-ity of Multimedia Experience (QoMEX), 2016, pp. 1–6.