Titre: Title:
Simulating water flow and reactive transport in waste rock piles using stochastic properties
Auteurs: Authors:
Omar Fala, John Molson, Ihssan Dawood, Michel Aubertin, Bruno Buissière et Robert P. Chapuis
Date: 2011
Type: Rapport / Report Référence:
Citation:
Fala, O., Molson, J., Dawood, I., Aubertin, M., Buissière, B. & Chapuis, R. P. (2011). Simulating water flow and reactive transport in waste rock piles using stochastic properties (Rapport technique n° EPM-RT-2011-03).
Document en libre accès dans PolyPublie Open Access document in PolyPublie
URL de PolyPublie:
PolyPublie URL: http://publications.polymtl.ca/2794/
Version: Version officielle de l'éditeur / Published versionNon révisé par les pairs / Unrefereed Conditions d’utilisation:
Terms of Use: Tous droits réservés / All rights reserved
Document publié chez l’éditeur officiel
Document issued by the official publisher
Maison d’édition:
Publisher: École Polytechnique de Montréal
URL officiel:
Official URL: http://publications.polymtl.ca/2794/
Mention légale:
Legal notice:
Ce fichier a été téléchargé à partir de PolyPublie, le dépôt institutionnel de Polytechnique Montréal
This file has been downloaded from PolyPublie, the institutional repository of Polytechnique Montréal
EPM–RT–2011-03
SIMULATING WATER FLOW AND REACTIVE TRANSPPORT IN WASTE ROCK PILES USING
STOCHASTIC PROPERTIES
O. Fala, J. Molson, I. Dawood, M. Aubertin, B. Bussière, R.P. Chapuis
École Polytechnique de Montréal
EPM-RT-2011-03
Simulating water flow and reactive transport in waste rock
piles using stochastic properties
O. Fala
1, 2, J. Molson
3, I. Dawood
1, M. Aubertin
1, B. Bussière
4, R.P.
Chapuis
11 École Polytechnique, Montréal, Québec, Canada, 2Genivar; Val d’Or; Québec; Canada,
3 Université Laval; Québec; Canada;
4Université du Québec en Abitibi-Témiscaminque, Rouyn-Noranda, Québec,
2011 Fala et al.
Tous droits réservés
Dépôt légal :
Bibliothèque nationale du Québec, 2011 Bibliothèque nationale du Canada, 2011 EPM-RT-2011-03
Simulating water flow and reactive transport in waste rock piles using stochastic properties
par : O. Fala1,2, J. Molson3, I. Dawood1, M. Aubertin1, B. Bussière4, R.P. Chapuis1 1 École Polytechnique, Montréal, Québec, Canada,
2Genivar; Val d’Or; Québec; Canada, 3 Université Laval; Québec; Canada;
4Université du Québec en Abitibi-Témiscaminque, Rouyn-Noranda, Québec, Canada
Toute reproduction de ce document à des fins d'étude personnelle ou de recherche est autorisée à la condition que la citation ci-dessus y soit mentionnée.
Tout autre usage doit faire l'objet d'une autorisation écrite des auteurs. Les demandes peuvent être adressées directement aux auteurs (consulter le bottin sur le site http://www.polymtl.ca/) ou par l'entremise de la Bibliothèque :
École Polytechnique de Montréal
Bibliothèque – Service de fourniture de documents Case postale 6079, Succursale «Centre-Ville» Montréal (Québec)
Canada H3C 3A7
Téléphone : (514) 340-4846
Télécopie : (514) 340-4026
Courrier électronique : [email protected]
Ce rapport technique peut-être repéré par auteur et par titre dans le catalogue de la Bibliothèque : http://www.polymtl.ca/biblio/catalogue/
ABSTRACT
This report presents a numerical modeling approach to assess unsaturated water flow and geochemical transport in a sulphidic waste rock pile using selected realizations of stochastically distributed material properties. Such simulations can serve to better understand the long-term response of a typical waste rock pile. The water retention curve and hydraulic conductivity function are used to represent spatial variability for water flow, while distributed geochemical parameters are used for reactive transport. The results illustrate how the spatial correlation of hydraulic properties directly affects the moisture distribution and flow within the pile, which in some cases creates local preferential flow paths along the direction of the strongest correlation of hydraulic properties. The numerical simulations also show how sulphide mineral oxidation rates can be influenced by the grain size, sulphide fraction and moisture content distribution, which may explain large observed spatial variations in the composition of drainage water.
Key words: Acid Mine Drainage, Seepage, Volumetric Water Content, Hydraulic Conductivity,
Reactive Transport
RÉSUMÉ
Ce rapport présente une approche de modélisation numérique visant à évaluer l’écoulement d'eau et le transport géochimique dans une halde à stériles réactifs, en utilisant des propriétés stochastiques pour les matériaux sulfureux. De telles simulations peuvent servir à mieux comprendre la réponse à long terme d'une halde à stériles typique. La courbe de rétention d'eau et la fonction de conductivité hydraulique non saturée sont utilisées pour représenter la variabilité spatiale de l'écoulement de l'eau ; une distribution des paramètres géochimiques sert pour l’analyse du transport réactif. Les résultats illustrent comment la corrélation spatiale des propriétés hydrauliques affecte la distribution et la circulation de l'eau au sein de l’empilement, produisant, dans certains cas des chemins d’écoulement préférentiels dans la direction de la plus forte corrélation des propriétés hydrauliques. Les simulations numériques montrent également que les taux d'oxydation des minéraux sulfureux sont influencés par la taille des grains, la proportion de sulfure et la distribution de l’eau, qui peuvent être la cause de grandes variations spatiales dans la composition des eaux de drainage.
Mots clés: Drainage minier acide, Écoulement, Teneur en eau volumique, Conductivité hydraulique,
TABLE OF CONTENTS
ABSTRACT ... ii
RÉSUMÉ... ii
TABLE OF CONTENTS... iii
LIST OF FIGURES ... ………..iv
LIST OF TABLES ... ………..vi
1. INTRODUCTION... 1
2. SIMULATION OF PILE RESPONSE ... 2
2.1 Water flow ... 2
2.2 Geochemical reactions ... 14
3. STOCHASTIC MODELLING RESULTS ... 17
3.1 Water flow ... 17
3.2 Geochemical transport ... 27
4. DISCUSSION AND CONCLUSION... 31
ACKNOWLEDGEMENTS ... 34
LIST OF FIGURES
Figure 1: Geometrical configuration of the simulated waste rock pile.
Figure 2: Contours of volumetric water content at the end of March (a), June (b), August (c) and December (d). Case S1 (homogeneous, SBL).
Figure 3: Contours of volumetric water content at the end of March (a), June (b), August (c) and December (d). Case S2 (homogeneous, GRV).
Figure 4: Scaling factors related to hydraulic conductivity (a), suction (b) and volumetric water content (c). Cases S3 and S7 (horizontal correlation with σk,ψ =1, σθ = 0.1)
Figure 5: Scaling factors related to hydraulic conductivity (a), suction (b) and volumetric water content (c). Cases S4 and S8 (horizontal correlation with σk,ψ = 10, σθ = 0.1)
Figure 6: Scaling factors related to hydraulic conductivity (a), suction (b) and volumetric water content (c). Cases S5 and S9 (vertical correlation with σk,ψ = 10, σθ = 0.1)
Figure 7: Scaling factors related to hydraulic conductivity (a), suction (b) and volumetric water content (c). Cases S6 and S10 (mixed correlation with σk,ψ = 10, σθ = 0.1).
Figure 8: Contours of volumetric water content at the end of March (a), June (b), August (c) and December (d). Case S3 (SBL).
Figure 9: Contours of water content at the end of March (a), June (b), August (c) and December (d). Case S4 (SBL).
Figure 10: Contours of volumetric water content at the end of March (a), June (b), August (c) and December (d). Case S5 (SBL).
Figure 11: Contours of volumetric water content at the end of March (a), June (b), August (c) and December (d). Case S6 (SBL).
Figure 12: Contours of volumetric water content at the end of June (a), and December (b). Case S7 (GRV).
Figure 14: Contours of volumetric water content at the end of June (a), and December (b). Case S9 (GRV).
Figure 15: Contours of volumetric water content at the end of June (a), and December (b). Case S10 (GRV).
Figure 16: Seepage velocity (cm/d) at the end of the year. Case S1 Figure 17: Seepage velocity (cm/d) at the end of the year. Case S5. Figure 18: Seepage velocity at the end of the year. Case S4
Figure 19: Seepage velocity at the end of the year. Case S6
Figure 20. Case of waste rock pile with horizontal correlation: Grain radii, and sulphide fraction (pile made with SBL); the corresponding volumetric water content distribution is shown in Fig. 9d, and the velocity field is shown in Fig. 18.
Figure 21: Case of waste rock pile (SBL) with horizontal correlation: Simulated oxygen, pH, sulphate and iron after 20 years.
Figure 22. Case of waste rock pile (SBL) mixed correlation: Grain radii and sulphide fraction; the volumetric water content and velocity fields are shown in Fig. 10 and 19 respectively.
Figure 23. Case of waste rock pile (SBL) mixed correlation: Simulated oxygen, pH, sulphate and iron after 20 years.
LIST OF TABLES
Table 1. Saturated hydraulic conductivity and water retention curve parameters for the van Genuchten (1980) - Mualem (1976) model (see Eq. 2 & 3).
Table 3. Statistical parameters of simulations S1 to S11. Table 4. Background and recharge concentrations
1. INTRODUCTION
Typical waste rock piles are large scale structures that show significant spatial variability of mineralogy, particle size, and porosity, with strong variations of hydrogeological and geochemical properties. The water distribution and flow systems within a waste rock pile are complex and difficult to measure, interpret, and predict. Some recent investigations have nonetheless provided valuable insights into the behaviour of such piles, including the presence of capillary barrier effects and localized flow (e.g. Fala et al. 2005, 2006) which affect their geochemical transport response (Molson et al. 2005). Various forms of localized (or preferential) water flow processes can be identified, including macropore flow, gravity-driven unstable flow, capillary barrier effects, and heterogeneity-driven flow (e.g. Nieber et al., 2000). This paper deals with the latter process of preferential flow due to material heterogeneities in a surface pile containing millions of tons of waste rock.
The geochemical composition of seepage water from a waste rock pile and its rate of discharge depend on a variety of factors, including the local climatic conditions, mineralogical composition of the waste rock, as well as the depositional structure and hydraulic properties of the pile. The hydraulic properties are particularly critical as they control the degree of saturation which affects flow behaviour and the oxygen flux. This is particularly the case when sulphidic minerals in the waste rock may produce acid mine drainage (AMD) in the presence of water and oxygen.
The complex phenomena that occur in a waste rock pile due to the nature of the material and construction methods can be quite challenging to observe and interpret (e.g. Aubertin et al., 2005, 2008; Anterrieu et al., 2010). In this regard, numerical models can be very useful to investigate the various processes that take place in such complex systems.
This report focuses on assessing flow systems in a typical waste rock pile, which play a critical role in the generation of acid mine drainage. The short and long-term behaviour of homogeneous waste rock piles made of one or two types of coarse-grained (sandy SBL or gravelly GRV) materials were recently
presented by Fala et al. (2003, 2005, and 2006). The same materials and pile are used here to assess the long-term hydrogeological behaviour with more realistic field conditions using heterogeneous waste rock properties with preferred spatial correlations.
2. SIMULATION OF PILE RESPONSE 2.1 Water flow
In order to simulate unsaturated flow and geochemical reactions in waste rock piles, the authors have considered a conceptual model for a pile (loosely based on an actual case) made of sandy (SBL) or gravely (GRV) materials. These materials have been characterized in the laboratory by Bussière (1999), including their saturated hydraulic conductivity (Ks) and water retention curve (WRC) that has
been adjusted to the van Genuchten (1980) model (see below). The corresponding hydrogeological parameters are provided in Table 1. Because of their coarse grain size distribution, these materials possess a relatively high saturated hydraulic conductivity and a low water retention capacity (i.e. low air entry value, AEV). The unsaturated hydraulic conductivity function is obtained from Ks and the WRC, using the Mualem–van Genuchten model (van Genuchten et al., 1991). The water flow results are later used to simulate the geochemical evolution and advective-dispersive transport of AMD in the waste rock pile while exposed to surface recharge and oxygen diffusion.
Table 1: Saturated hydraulic conductivity and water retention curve parameters for the van Genuchten (1980) - Mualem (1976) model (see Eq. 2 & 3)
θr θs αv (m-1) nv Ks (m/s)
GRV 0 0,39 14960 1,45 4,7x10⁻³
The water flow simulations were conducted using the HYDRUS2D code (version 2.0; Simunek et al., 1999), which uses the finite element method to solve the governing equations for unsaturated flow. HYDRUS2D has been used in several previous investigations by the authors (e.g. Fala et al. 2003, 2005, and 2006). Like most existing numerical software packages, this code considers that the porous media is incompressible, and uses Richards’ (1931) equation, which can be expressed as follows (for two-dimensional cartesian coordinates, x, z; z is taken positive downward):
[1]
( )
( )
z( )
x z K K K x x z z z t ψ ψ ψ θ ψ ψ ∂ ∂ ∂ + ∂ ∂ − = −∂ ∂ ∂ ∂ ∂ ∂ ∂In this equation, ψ is the water pressure (expressed as a head - L), θ is the volumetric water content (-), t is time (T) and Kx and Kz (L/T) are the pressure-dependent hydraulic conductivities in the
horizontal and vertical directions, respectively.
The van Genuchten (1980) model, which is commonly used to define the water retention curve and the unsaturated hydraulic function, represents material properties. The corresponding equations can be expressed as follows: [2]
(
1)
1 v v m r e n s r v θ θ θ θ θ α ψ − = = − + [3]( )
0.5 1 1(
1/)
v 2 v m m e s e e K θ =K θ − −θ In these equations, θe is the effective volumetric water content, θs is the saturated volumetric water
content (equal to the porosity of the material), θr is the residual volumetric water content, αv and nv (=
1-1/mv) are the van Genuchten (1980) model parameters, and K (θe) is the hydraulic conductivity. The
pile with variable (stochastically distributed) hydrogeological properties; additional cases have also been simulated by Fala (2008), but will not be presented here.
Each of the 11 cases is characterized by a unique material (SBL or GRV). The geometry of the simulated waste rock pile is shown in Figure 1, representing a circular pile with a height of 20 m, and a base diameter of 90 m. The recharge boundary conditions were assigned based on observed annual cycles of precipitation and evaporation. Each cycle is applied for one year, and then re-applied for each subsequent year until the end of the simulation. Two cyclic boundary conditions are applied (Table 2): Cycles C1 and C2 represent, respectively, the observed average daily precipitation (Pr) and evaporation (Ev) for each month (calculated from monthly averages), as recorded at the Latulipe, Quebec (Canada) monitoring station over 28 years. The residual volumetric water content (θr) is assumed as the initial
material state. A free drainage condition was implemented at the base of the modeled pile, for all simulations. This is equivalent to assuming that the pile is underlain by a drainage layer, as often occurs naturally due to accumulation of coarser grained material at the base (e.g. Aubertin et al. 2002). Table 2: Climatic conditions applied for all simulations (rates in cm/d).
Cycle Jan. Feb. March April May June July Aug. Sept. Oct. Nov. Dec C1 0.182 0.15 0.191 0.22 0.258 0.307 0.302 0.314 0.324 0.293 0.231 0.230
C2 0 0 0 0.046 0.237 0.339 0.407 0.345 0.21 0.089 0 0
Figure 1: Geometrical configuration of the simulated waste rock pile, representing a vertical 2D axysymmetric section.
Previous simulations of the short term behaviour of flow through homogeneous waste rock piles (see Fala et. al. 2003, 2005) showed that the wetting front does not extend further than a few meters into the pile after one year when assuming typical climatic conditions in north-west Quebec (Table 2). For such relatively short-term analyses, the results were in part dependent on the initial conditions that are assumed to exist in the pile at the beginning of the cycle (i.e. water content and position of the water table). In reality, a waste rock pile often takes many years to build, during which its surface is exposed to several climatic cycles. A one-year simulation is thus insufficient to fully assess the flow behaviour. Long term studies (with several annual cycles) are therefore required in order to reduce the effect of the initial conditions. In this regard, results of Fala et al. (2006) have shown that the volumetric water content distribution becomes repetitive after a few years (with the same cyclic changes of water distribution during the year). The time required to reach the onset of repeatable cyclic behaviour depends on the system geometry, material properties, initial state, and recharge conditions. Between any set of two successive years following this time, the profiles will therefore be essentially identical (i.e. the profiles at the end of a month of the nth year are identical to those at the end of the
same month of the (n+1)th year). The results shown below correspond to those obtained after such a
pseudo-stationary condition is reached (after 4 to 10 years in the cases studied here).
Base cases with uniform properties
For the first two simulations (S1 and S2), which serve as the base cases, the waste rock has uniform homogeneous hydrogeological properties. In these simulations, the pile consists of either SBL (sandy) or GRV (gravely) material. The calculated contours of water content are shown in Figures 2 (S1, SBL) and 3 (S2, GRV). As can be seen, water infiltrates through the pile fairly uniformly since the hydrogeological properties are homogeneous. At the end of the second and fourth calculation periods (June and December), the upper part of the pile shows a water content corresponding to the applied surface conditions while lower parts show a water content that corresponds to the surface conditions applied during the previous periods (March and August). These results tend to confirm that a pseudo-stationary condition has been reached. The volumetric water content in the pile lies below 0.1 (degree of saturation Sr ≤ 26 %) and below 0.04 (degree of saturation Sr ≤ 14 %) in the gravelly (S2) and sandy (S1) material, respectively. The sloping side of the pile induces a small difference in water content, compared to the center of the pile. This difference persists all year. In the summer, the surface becomes dryer, as the water content is almost equal to the residual water content over a thickness of approximately 10 and 25 cm for GRV and SBL, respectively.
a) b)
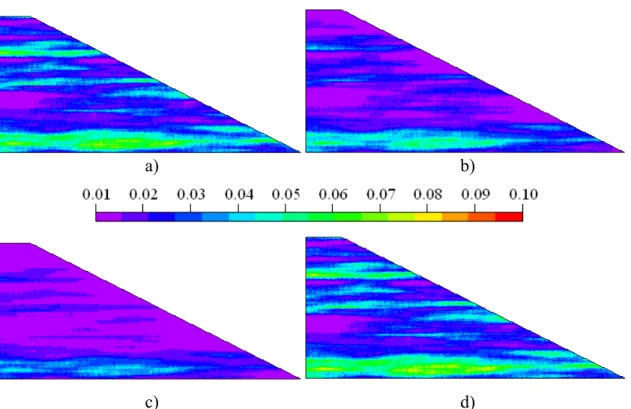
c) d)
Figure 2: Contours of volumetric water content at the end of March (a), June (b), August (c) and December (d). Case S1 (homogeneous, SBL).
a) b)
c) d)
Figure 3: Contours of volumetric water content at the end of March (a), June (b), August (c) and December (d). Case S2 (homogeneous, GRV).
Flow simulations with stochastic properties
A homogeneous material with uniform hydrogeological properties is not representative of real waste rock piles, which typically show heterogeneous property distributions (e.g. Aubertin et al., 2002, 2005; Azam et al., 2007, Anterrieu et al., 2010). The influence of spatial variability of hydrogeological properties can be assessed by using a stochastic analysis. It is assumed here that the representative elementary volumes (REVs) are independent. It is also assumed that the value of a given property measured at two locations depends on the distance between them: the closer they are, the closer their properties will be (on average). Two REVs in proximity generally have somewhat similar geological and depositional histories, which increases the probability of having similar properties (Miyazaki, 2006). This type of spatial variability of material properties can be handled statistically. It should be noted that other types of local heterogeneity cannot be treated in the manner adopted here, such as cracks, macropores, and other random defects; although these may have a great influence on the hydrogeological properties, they are not considered herein.
HYDRUS2D (Simunek et al., 1999) is used to study the effect of spatial variability of the hydrogeological properties on the flow in the dumps. This software uses the procedure described below. Other approaches can also be applied to consider spatial variability of the hydrogeological properties (e.g., Smith and Freeze, 1979; Zhang, 2002; Yates and Warrick, 2002; Vereecken et al., 2007), but these will not be discussed here.
The procedure consists of generating a two-dimensional field of values for a parameter with the values defined for each node or element. It is assumed that the population from which the values are to be chosen is normally distributed, with mean µ and standard deviationA σ , and that the two-A dimensional stochastic process that controls the spatial distribution of the values is stationary, isotropic
and has an autocorrelation structure that can be represented by the following relation (Freeze, 1980; El Kadi, 1986):
[4] ρA(l)=exp(−αAl)
where ρA(l) is the autocorrelation coefficient at lag(l), αA [L-1] is the autocorrelation parameter for
A, and 1/αA [L] is the correlation length. Equation 4, which can be considered as a general (empirical) autocorrelation function, is widely used to describe the spatial distribution of geological, geotechnical, and hydrogeological properties (e.g. Smith and Freeze, 1979; Chin 2000). It represents a three-parameter description of the normal population from which the A values will be generated. The ij
notation N [µ ;A σ ;A α ] is used to denote such a population. The values of A Aij can be related to a set of ε which are taken from the population N [0; 1;ij αA], by the relation:
[5] Aij =µ +A εijσA
The original requirement can then be reduced to that of simulating a two-dimensional field of residuals from the stochastic process N [0, 1; αA].
The generating algorithm is that of Meijia and Rodriguez-Iturbe (1974). The generator utilizes a random variable whose distribution is the radial spectral distribution functions Gm corresponding to the correlation function (Eq. 4) of ε . The algorithm is given by: ij
[6]
∑
[
(
)
]
= + + = = ' 1 2 / 1 cos sin cos ' 2 ) , ( N m m m j m i m j i ij ε x y N w x γ y γ φ εwhere N’ ≥ 50; γ and m φ are chosen from a uniform distribution over the range 0-2π (U [0, 2π ]), m and wm is given by:
[7] 2 / 1 2 1 1 1 − − = m A m G w α
The value of Gm in Eq. 7 is chosen from a uniform distribution over the range 0-1. Additional details
on this statistical approach, with its advantages and limitations, are provided by Dagan (1989; see also the Discussion below).
Based on the above functions (Eq. 4 to 7), HYDRUS2D generates a 2D-field of scaling factors related to the hydraulic conductivity (α ), suction (or pressure,k α ), and volumetric water content ψ
(α ). Examples of such fields are shown in Figure 4. Each point on Figures 4a, b and c indicates that θ the hydraulic conductivity (in the hydraulic conductivity function), suction (in the function of hydraulic conductivity and on the water retention curve) and volumetric water content (on the water retention curve) are multiplied by a specific scaling factor. The distance for which the scale factors are correlated depends on the correlation length (1/αA) along the horizontal and vertical directions. The input values of the analytical model of van Genuchten (1980) are regarded as average values with standard deviation σ (for hydraulic conductivity), k σ (for suction), and ψ σ (for volumetric water content), θ
whereas the actual values vary according to a selected spatial distribution. The stochastic distribution can be applied on hydraulic conductivity K and/or suction ψ and/or the volumetric water content θ. In addition to average values of variables (for the van Genuchten model parameters), and their standard deviation, the correlation lengths are required as input data (i.e. spatial distribution of the hydrogeological characteristics related to hydraulic conductivity and/or suction and/or the water content). The distribution then exhibits a strong correlation (or autocorrelation) along a direction (horizontal, vertical, or mixed) when the scaling factors form parallel rows of similar values. In the
In the simulations presented here, the value of the correlation length varies from 5 to 100 m. The choice of correlation length and its direction depends on the spatial distribution of the required hydrogeological properties, which are related to the grain size distributions observed in the field. The standard deviations are taken equal to 1 and 10 for the hydraulic conductivity and the suction, and equal to 0.1 for the volumetric water content (lower variability compared to the hydraulic conductivity or to the AEV, which can vary over several orders of magnitude). The main objective is to evaluate the effect of a variation in the standard deviation on the hydrogeological behaviour of the pile. Statistical parameters for simulations S3 to S11 are given in Table 3. Results from these simulations are presented and compared with the homogeneous cases (S1 and S2) in Section 3.
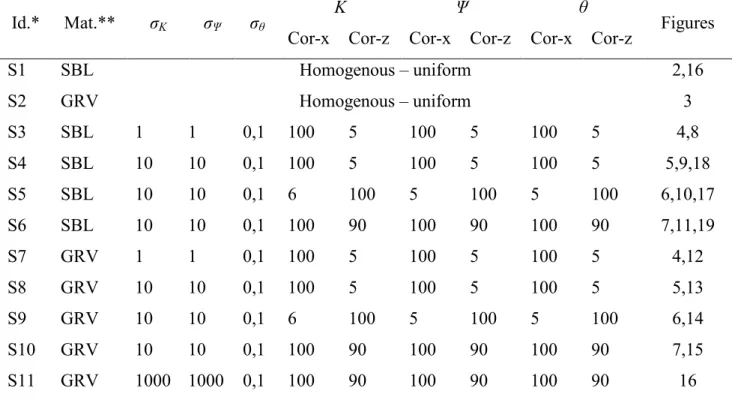
Table 3: Statistical parameters of simulations S1 to S11.
Id.* Mat.** σK σΨ σθ K Ψ θ Figures
Cor-x Cor-z Cor-x Cor-z Cor-x Cor-z
S1 SBL Homogenous – uniform 2,16 S2 GRV Homogenous – uniform 3 S3 SBL 1 1 0,1 100 5 100 5 100 5 4,8 S4 SBL 10 10 0,1 100 5 100 5 100 5 5,9,18 S5 SBL 10 10 0,1 6 100 5 100 5 100 6,10,17 S6 SBL 10 10 0,1 100 90 100 90 100 90 7,11,19 S7 GRV 1 1 0,1 100 5 100 5 100 5 4,12 S8 GRV 10 10 0,1 100 5 100 5 100 5 5,13 S9 GRV 10 10 0,1 6 100 5 100 5 100 6,14 S10 GRV 10 10 0,1 100 90 100 90 100 90 7,15 S11 GRV 1000 1000 0,1 100 90 100 90 100 90 16
*Identification; **Material;σ , k σ and ψ σ : standard deviation relative to K, ψ et θ ; Cor-x : θ
a)
b) c)
Figure 4: Scaling factors related to hydraulic conductivity (a), suction (b) and volumetric water content (c). Cases S3 and S7 (horizontal correlation with σk,ψ =1, σθ = 0.1)
a)
b) c)
a)
b) c)
Figure 6: Scaling factors related to hydraulic conductivity (a), suction (b) and volumetric water content (c). Cases S5 and S9 (vertical correlation with σk,ψ= 10, σθ= 0.1)
a)
b) c)
Figure 7: Scaling factors related to hydraulic conductivity (a), suction (b) and volumetric water content (c). Cases S6 and S10 (mixed correlation with σk,ψ= 10, σθ= 0.1).
2.2 Geochemical reactions
Generation of acid mine drainage includes the diffusion of oxygen into the reactive waste, where it is consumed by oxidation of sulphide minerals such as pyrite (FeS2) and pyrrhotite (Fe1-xS). For pyrite,
the simplified reaction can be expressed as follows (e.g. Aubertin et.al. 2002):
[8] FeS2 + 1/2H2O + 15/4 O2 ⇒ Fe3+ + 2SO42- + H+
The aqueous oxidation products are transported by advection and hydrodynamic dispersion through the water phase. For a partially saturated porous medium, transport is governed by (Molson et.al. 2008):
[9]
( )
(
)
k i k i j k ij i k R x C q x C D x t C + ∂ ∂ − ∂ ∂ ∂ ∂ = ∂ ∂θ θwhere θ is the volumetric water content, Ck is the concentration of the kth aqueous component in the
pore water [ML-3], qi is the ith component of the Darcy flux [LT-1], Dij is the dispersion coefficient
tensor [L2T-1], R
k is a source/sink term from geochemical reactions [ML-3T-1], xij are the spatial
coordinates (L), and t is time (T).
Equation (9) is solved with the POLYMIN model (Molson et al. 2008) using a Galerkin finite element discretization with linear triangular elements. The model was developed from a modified version of the MINTRAN code (Walter et al. 1994), which uses MINTEQA2 (Allison et al. 1991) for equilibrium geochemical speciation. Further details on the numerical scheme and on the modified oxygen diffusion and sulphide oxidation modules are provided by Molson et al. (2005, 2006). In the reactive transport simulations, a Cauchy mass-flux condition is applied across the top boundary using the recharge water
system is assumed initially oxygen-free. In the simulations shown here, the primary physical parameters (saturated hydraulic conductivity, grain radius, and sulphide mineral fraction) of the SBL have a horizontal and mixed correlation. The principal physical properties are provided in Table 5. Background mineralogy was assumed dominated by silicate minerals (95-99%vol.; represented by a single pseudo-component of silica), 1-5% pyrite, and small amounts of calcite, siderite, gibbsite, and ferrihydrite (each < 0.1%). The system is assumed initially gypsum-free but gypsum is allowed to precipitate.
Transport simulations assume the flow system is at steady state, which simplifies the interpretation of the transport system behaviour. Volumetric water content is determined by the flow solution and controls the effective oxygen diffusion coefficient De, which is calculated using the Aachib et al. (2004) model based on an oxygen diffusion coefficient in air of D°a = 1.8×10⁻⁵ m2/s, and that in water
Table 4. Background and recharge concentrations
Component Background (mol/L) Recharge Conc. (mol/L)
Ca2+ 9.8e-03 2.0e-05 Mg2+ 2.2e-03 2.0e-05 Na+ 1.1e-03 7.0e-05 K+ 5.0e-04 5.0e-06 Cl- 5.0e-04 2.0e-05 CO32- 1.7e-06 2.0e-05 SO42- 1.1e-02 7.4-05 Mn2+ 1.6e-04 1.0e-06
H4SiO4- 1.9e-03 1.0e-08
Fe2+ 1.7e-05 2.2e-16
Fe3+ 2.8e-16 1.0e-08
Al3+ 4.7e-13 1.0e-10
pH 7.0 7.0
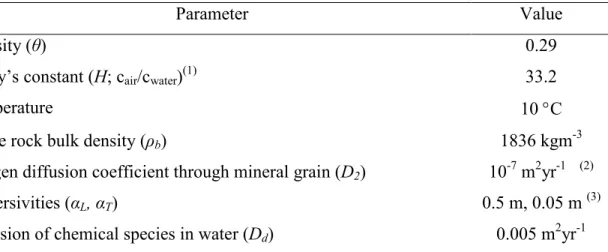
Table 5. Summary of major system variables for the geochemical simulations.
Parameter Value
Porosity (θ) 0.29
Henry’s constant (H; cair/cwater)(1) 33.2
Temperature 10 °C
Waste rock bulk density (ρb) 1836 kgm-3
Oxygen diffusion coefficient through mineral grain (D2) 10-7 m2yr-1 (2)
Dispersivities (αL, αT) 0.5 m, 0.05 m (3)
Diffusion of chemical species in water (Dd) 0.005 m2yr-1
(1) cair is the concentration of a species in the air and cwater is the concentration of a species in the water
3. STOCHASTIC MODELLING RESULTS 3.1 Water flow
Four distributions of the scaling factors have been used for the simulations. These are shown in Figures 4, 5 (horizontal correlations), 6 (vertical correlation), and 7 (mixed correlation). Calculation results with the sandy (SBL, S3 to S6) and gravelly (GRV, S7 to S11) materials are shown for cases with a strong correlation along the horizontal axis (cases S3, S4, S7, and S8) and the vertical axis (cases S5 and S9) and for mixed conditions (cases S6, S10, and S11). These are shown in Figures 8 to 16 described below.
Cases with SBL
In simulation S3 (Figure 8), a small variation in the hydrogeological characteristics (standard deviation equal to 1 for hydraulic conductivity and pressure, and 0.1 for the water content) with a strong horizontal correlation (of 100 m comparatively to 5 m vertically) is introduced. The resulting hydrogeological property distribution is similar to a horizontal stratification which is often encountered with waste rock piles constructed on relatively flat surfaces (e.g. Aubertin et. al. 2002, 2005). The behaviour of the pile changes comparatively to the homogeneous case S1. The wetting zone patterns become almost horizontal and less uniform (Figure 8). Water tends to move horizontally, especially where the AEV is relatively higher. The zone near the surface is affected by evaporation in the summer, and the dry part during August is more extensive than in simulation S1 (a few decimetres in S1 compared with several meters in S3). In part of the pile, the volumetric water content reaches much higher values (i.e. 0.23 to 0.30) as a consequence of a localized capillary barrier effect. In these areas, water is retained locally due to the difference in material properties in adjacent ‘layers’ (e.g. Fala et al. 2005). In the remainder of the pile, the volumetric water content varies from 0.01 to 0.05.
a) b)
c) d)
Figure 8: Contours of volumetric water content at the end of March (a), June (b), August (c) and December (d). Case S3 (SBL).
In simulation S4, the strong correlation of hydrogeological characteristics is still oriented horizontally (Figure 5), but the standard deviation values are 10 times those of S3. The contours of the volumetric water content (Figure 9) show variations between 0 and approximately 0.08. The results indicate that increasing the standard deviation leads to higher horizontal components of seepage. Thus, water seeps more rapidly towards the interior of the pile. An important part of the pile is at residual water content in August. This is related to the fact that some of the SBL behaves as a relatively fine grained material, keeping a relatively high hydraulic conductivity even when the suction is fairly high. The depth of the drying front is thus more important in this case, reaching approximately 5 m.
deviation of 10 (for the pressure and hydraulic conductivity) and mixed orientation of the strong correlation (see Figure 7), the volumetric water content generally varies from 0.01 to 0.04. In the higher part of the dump, it reaches 0.055. The distribution of water content values highlights the oblique distribution of the hydrogeological properties.
a) b)
c) d)
Figure 9: Contours of water content at the end of March (a), June (b), August (c) and December (d). Case S4 (SBL).
a) b)
c) d)
Figure 10: Contours of volumetric water content at the end of March (a), June (b), August (c) and December (d). Case S5 (SBL).
a) b)
c) d)
Figure 11: Contours of volumetric water content at the end of March (a), June (b), August (c) and December (d). Case S6 (SBL).
Cases with GRV
In simulations S7 to S11, the waste rock pile is made of the gravelly material (GRV). The volumetric water content in the GRV usually lies between 0.05 to 0.12 when the standard deviation is 1 (Fig. 12, horizontal correlation), and between 0 to 0.1 when the standard deviation is 10 (Figures 13-15, cases with a horizontal, vertical or mixed correlation). The volumetric water content (shown here for June and December only) is generally slightly higher in the GRV than in the SBL. At a given suction, the hydraulic conductivity of the SBL can be higher (according to the hydraulic conductivity functions), causing slower flow in the GRV (and thus a locally higher volumetric water content). In the GRV, the depth of the drying front is almost similar to the basic homogeneous case (S2, see Fig. 3).
It is also seen that the effect of the orientation of the hydraulic property distribution is less obvious with the GRV than in the case of SBL (compare Figures 8-11 with Figures 12-15), although the same general tendencies are also observed.
An additional simulation was carried out to assess the effect of a much larger standard deviation of the hydrogeological properties on the preferential flow in the GRV (results not shown here). In this simulation, the orientation of the strong correlation is mixed and the standard deviation was increased to 1000 for the suction and hydraulic conductivity (the standard deviation of the water content was not changed). The results (presented in Fala 2008) indicate that a larger standard deviation leads to more pronounced preferential flow. This type of behaviour is not unexpected for actual waste rock piles (based on field investigations, e.g. Aubertin et al. 2005, 2008; Anterrieu et al. 2010).
The results presented here illustrate the effect of stochastic distributions of material properties on water flow and moisture content distribution. It should be mentioned that such results have been obtained for specific realizations; repeating the calculations for the same cases (same distribution parameters) would not give the same results due to the stochastic approach. Nonetheless, the simulations illustrate well the effect of heterogeneous properties on the behaviour of a typical waste rock pile.
a) b)
a) b)
Figure 13: Contours of volumetric water content at the end of June (a), and December (b). Case S8 (GRV).
a) b)
Figure 14: Contours of volumetric water content at the end of June (a), and December (b). Case S9 (GRV).
a) b)
Figure 15: Contours of volumetric water content at the end of June (a), and December (b). Case S10 (GRV).
Seepage velocity
The velocity fields also reveal some interesting aspects of the pile response. Results obtained on the sandy material (SBL) are used here to illustrate this aspect.
In the base case homogenous pile with SBL (S1), two zones with different seepage velocity are observed (Figure 16). These two zones are separated by the wetting front which can be clearly identified. The seepage velocity is about 0.25 cm/d in the upper part, and is lower in the lower part. For a strong vertical correlation (S5), water accumulates along vertical columns where the velocity of water is relatively high (Figure 17). With horizontal or mixed orientations (Figures 18 and 19), the velocity has a strong horizontal or mixed component. Outside of these wet zones, the velocity is almost nil. The maximum velocity in the preferential flow areas is much higher than in the homogeneous case, being about 2.5, 2 and 1 cm/d in the case of the strong vertical, horizontal and mixed correlations, respectively. At specific locations and particular times, the maximum velocity can reach 4.5 cm/d in the case of a strong vertical correlation, 3.5 cm/d in the horizontal case and 1.8 cm/d in the mixed case. In the homogeneous case, the maximum velocity occurs near the border at the base of the pile where it is about 3.5 cm/d. It is also seen that the water flow tends to change direction in the mixed hydrogeological properties case and to a lesser extent in the horizontal case. The direction is more uniform in the vertical case. These sinuous (or tortuous) movements of water have an influence on the maximum velocity of water. It appears that the changes in water direction tend to reduce the maximum velocity.
Figure 16: Seepage velocity (cm/d) at the end of the year. Case S1
Figure 18: Seepage velocity at the end of the year. Case S4
Summary of main tendencies
Results from the simulations presented above indicate that the variation of the volumetric water content tends to follow the distribution of the hydrogeological properties; for instance the volumetric water contents are strongly correlated according to vertical and horizontal correlations when the properties are strongly correlated along such directions. This is an important observation when assessing the environmental behaviour of a pile as the degree of saturation may have an influence on the geochemical response of the waste rock (as illustrated below).
The wetting fronts near the base and drying fronts at the surface are not uniform and move along preferential flow paths, according to the direction of the strong correlation of the properties. A higher standard deviation of the hydrologic properties tends to produce more rapid moisture movement in the pile, particularly in the preferential direction. This makes the wetting front advance deeper in the pile when the standard deviations are higher. Except for a few locations within the pile (generally where hydraulic conductivity is the lowest), the average volumetric water content for the various cases is comparable with the base case S1 and S2 (homogeneous material). This is partly a consequence of the fact that the standard deviation of the volumetric water content scaling factor was kept fairly small in all simulations (equal to 0.1).
3.2 Geochemical transport
The spatially-correlated distributions of selected physical parameters (grain radius, sulphide fraction) for the first conceptual model are shown in Figure 20 (for SBL). The input parameters were generated to be correlated in the horizontal direction, with the grain radii varying from 0.1 mm to 1 mm and the sulphide fraction varying from 1 to 5%. The simulated moisture content distribution varies from about 0.01 to 0.1 and also shows a strong horizontal correlation as seen in Figure 9. Figure 18 indicates that
the flow field is predominantly downward, but shows significant local deviations which are caused by the material stratification.
Selected results for the reactive transport simulation of the case with a strong horizontal correlation (in SBL) are provided in Figure 21, showing oxygen, pH, sulphate and Fe(II) after 20 years. Although the volumetric water content is highly variable, it is relatively low (<0.1) thus the effective oxygen diffusion rate is governed primarily by the higher diffusion rate through the air phase. As a result, the oxygen concentrations in the air phase are relatively uniformly dispersed, showing no clear influence from the moisture content distribution in this case.
Figure 20. Case of waste rock pile with horizontal correlation: Grain radii, and sulphide fraction (pile made with SBL); the corresponding volumetric water content distribution is shown in Fig. 9d, and the
Figure 21: Case of waste rock pile (SBL) with horizontal correlation: Simulated oxygen, pH, sulphate and iron after 20 years.
By 20 years, the oxygen concentrations have reached a steady state distribution, decreasing from the fixed atmospheric concentration at the pile surface (0.26 mg/L) to about 0.14 mg/L in the interior. Diffusion from the outer surface is thus balanced by oxygen consumption in the interior of the waste rock pile. After 20 years, the pH remains buffered at about 2.8 throughout a large part of this pile. Where the sulphide oxidation rate is high and the buffering minerals have been depleted, the pH drops to about 2.5. Most of the acidity originates from the surface of the waste rock pile and propagates downward with the flow system. Low-pH sources are created at the pile surface in localized areas where oxygen concentrations and the sulphide fraction are high and where the grain radii are small, providing a large reactive surface area. In other areas, relatively less acidic zones (pH of 4-5) can be seen where the sulphide minerals have not been as extensively oxidized due to larger grain diameters (and thus a lower surface area per volume) and lower sulphide content. Sulphate and iron concentrations can be correlated to the pH distribution, with high concentrations coinciding with the
low pH zones, and with lower concentrations within the three relatively less active flow zones of more neutral pH.
A mixed correlation is used for the second conceptual model. The grain radius and sulphide fraction distributions are shown in Figure 22; the corresponding volumetric water content distribution is shown in Figure 11 and the velocity field is given in Figure 19. In this case, the grain size is generally coarser towards the base and toe of the pile. Although the water content variability is similar to the case with horizontal correlation, the rate of oxygen consumption is clearly higher since the minimum steady state oxygen concentration has decreased to about 0.08 mg/L (Figure 23). This trend of higher oxygen consumption in the mixed correlation case is likely due to the combination of smaller grain size (which increases the reactive surface area) and higher sulphide mineral fractions toward the core of the waste rock pile.
In this mixed case, the pH has decreased even further compared to the case with horizontal correlation, and the concentrations of sulphate and iron, especially in the central part of the domain, are significantly higher. These trends are consistent with the higher oxygen consumption rate which coincides with the zone of smaller grain size and higher sulphide mineral fraction.
Figure 23. Case of waste rock pile (SBL) with mixed correlation: Simulated oxygen, pH, sulphate and iron after 20 years.
4. DISCUSSION AND CONCLUSION
The simulation approach presented here may be used to assess the unsaturated flow behaviour of a waste rock pile, and to understand its long-term hydrogeological behaviour, hence providing insight for selecting the most appropriate construction sequence and for designing groundwater monitoring systems. The simulations indicate how variable properties of the waste rock may influence the water distribution and velocity in such complex systems.
In the field, different deposition methods can produce various types of property distributions, with strong spatial correlations, within a single waste rock pile. Only a single type of distribution is considered here since HYDRUS2D cannot handle multiple distributions in the same model. Hence, more than one type of correlation may have to be simulated in order to represent the complete internal structure of a pile, i.e. mixed correlations within the external regions and horizontal correlations for the core of the pile.
Furthermore, in the calculations, the scaling factors for hydraulic conductivity, suction and volumetric water content were generated independently. This may lead, in some cases, to inconsistent property distributions since there are actually physical relationships between these properties (e.g. Mbonimpa et al., 2000). The stochastic distributions used here nevertheless constitute fairly general cases that are useful for evaluating the effect of a variation of these properties.
Also, although the stochastic characterization of the hydraulic conductivity can provide a realistic description of the property distribution in the pile, the general approach adopted here has not explicitly taken into account the relationship between the hydraulic properties and the support scale. It is well known, however, that when hydraulic properties (such as Ks) are measured at small support scales, the
individual measurements can be expected to deviate significantly from the mean. The variance of the measurements will thus be high, and the correlation length scale will be small (typically on the order of the support scale). If, in the same porous medium, the hydraulic properties are measured over a much larger support scale, then it is expected that individual measurements at different locations would be much closer to the ensemble mean, with a relatively smaller variance of the measurements and a larger correlation length scale. This sensitivity of the statistical properties to the support scale of the measurements, known as the scale effect, implies that relevant properties in heterogeneous systems should be assessed using tests at various scales, and with a sufficient number of tests to give meaningful relationships (Fala 2008; Aubertin et al. 2008; Dawood and Aubertin 2009). When this is done, the average properties over scales much larger than the support scale of individual measurements can then be estimated by assuming a log-normal distribution of the hydraulic properties, with an exponential correlation function (Dagan, 1989). This is the basis for the approach adopted here.
distributions. Nonetheless, other realizations with the same correlation lengths and the same mean and standard deviation values (results not presented here) show that the hydrogeological behaviour of waste rock piles is in general similar to the results presented above (for a given set of parameters).
The stochastic simulations also provide insights on sulphide mineral oxidation and generation of acid mine drainage within heterogeneous and reactive waste rock piles. These are complex processes which depend on the spatial distribution of the physical, geochemical and hydrogeological properties. While the rate of oxygen diffusion through an unsaturated waste rock pile depends on the moisture distribution, at relatively low water contents the effect of water content on oxygen diffusion appears relatively weak. In these cases, the rate of oxygen advance into the waste rock pile, and thus the oxygen concentrations, appear more sensitive to the oxygen consumption rate due to sulphide oxidation, which is governed primarily by the grain size distribution (through the reactive surface area) as well as by the sulphide mineral fraction.
The influence of water content is expected to be more important at higher water contents and in systems with positive or no correlation between grain size and sulphide content. The simulations have shown that drainage from structured waste rock piles with horizontal stratification may be less acidic relative to poorly structured piles (i.e. without strong horizontal stratification). This appears partly the result of the tendency in the mixed correlated pile considered here towards higher sulphide content and smaller grain radii near the outer pile surface toward the top of the pile, which promotes sulphide oxidation. In the horizontally structured case, the zones of high sulphide fraction and low grain radii are distributed more deeply within the pile, delaying the rate of oxidation.
Additional work is still underway to develop appropriate characterizing methods (in the laboratory and in the field) for waste rock properties. The results are being used in numerical models to propose alternative construction methods that would help prevent deep water infiltration into the pile and the subsequent contamination of drainage water.
ACKNOWLEDGEMENTS
The authors acknowledge the support from École de technologie supérieure de l’Université du Québec and partners of the Industrial NSERC Polytechnique-UQAT Chair in Environment and Mine Wastes Management (http://www.polymtl.ca/enviro-geremi/).
REFERENCES
Aachib M., Mbonimpa, M, Aubertin, M. 2004. Measurement and prediction of the oxygen diffusion coefficient in unsaturated media, with applications to soil covers. Water, Air & Soil Pollution 156: 163-193.
Anterrieu, O., Chouteau, M., Aubertin, M. 2010. Geophysical characterization of the large-scale internal structure of a waste rock pile from a hard rock mine. Bull. Eng. Geol. Environ., 69:533-548.
Allison, J.D., Brown D.S. and Novo-Gradac, K.J. 1991. MINTEQA2/PRODEFA2, A geochemical assessment model for environmental systems: Version 3.0 User's Manual. EPA/600/3-91/021, Environmental Research Laboratory, Office of Research and Development, U. S. Environmental Protection Agency, Athens, Georgia, U.S.A.
Aubertin, M., Bussière, B. and Bernier, L., 2002. « Environnement et gestion des rejets miniers ». [Manual on CD-ROM] Montréal, Québec : Les Presses Internationales de Polytechnique.
Aubertin, M., Fala, O., Molson, J., Gamache-Rochette1, A., Lahmira, B., Martin, V., Lefebvre, R., Bussière, B., Chapuis, R.P., Chouteau, M., Wilson, G.W. 2005. Évaluation du comportement hydrogéologique et
géochimique des haldes a stériles. Symposium Rouyn-Noranda: L’Environnement et les Mines, 15-18 mai 2005, Rouyn-Noranda, Canada. CIM. 39p.
Aubertin, M., Fala, O., Molson, J., Chouteau, M., Anterrieu, O., Hernandez, M.A., Chapuis, R.P, Bussière, B., Lahmira, B., Lefebvre, R. 2008. Caractérisation du comportement hydrogéologique et géochimique des haldes à stériles. Symposium 2008 sur l'environnement et les mines, 2-5 novembre 2008, Rouyn-Noranda, Canada. CIM.
Azam, S., Wilson, G.W., Herasymuik, G., Nichol, C., Barbour, L.S. 2007. Hydrogeological behaviour of an unsaturated waste rock pile: a case study at the Golden Sunlight Mine, Montana, USA. Bull. Eng. Geol. Environ. 66:259-268
Bussière, B. 1999. Étude du comportement hydrique de couverture avec effets de barrière capillaire inclinées à l’aide de modélisations physiques et numériques. Thèse de doctorat, École Polytechnique de Montréal,
Dagan G. 1989. Flow and Transport in Porous Formations. Springer-Verlag, New York.
Dawood, I. and Aubertin, M. 2009. A numerical investigation of the influence of internal structure on the unsaturated flow in a large waste rock pile. GeoHalifax’2009: 62nd Canadian Geotechnical Conference and 10th Joint CGS/ IAH-CNC Groundwater Specialty Conference, 20-24 September 2009, Halifax, Nova Scotia, pp. 1534-1541.
El Kadi, A.I. 1986. A computer-program for generating two-dimensional fields of auto- correlated parameters. Ground Water, 24 (5): 663-667.
Fala, O., 2008. Analyse des conditions d’écoulement non saturé dans les haldes à stériles, Thèse de doctorat. École Polytechnique de Montréal, Canada.
Fala, O., Aubertin, M., Molson, J.W., Bussière, B., Wilson, G.W., Chapuis, R., Martin, V. 2003. Numerical modeling of unsaturated flow in uniform and heterogeneous waste rock piles. In: Farrell, T. and Taylor, G. (Eds.), Proceedings of the 6th International Conference on Acid Rock Drainage (ICARD), Australasian Institute of Mining and Metallurgy, Cairns, Australia, Publication Series 3/2003, pp 895-902.
Fala, O., Aubertin, M., Bussière, B., Chapuis, R., Molson, J. 2008. Stochastic numerical simulations of long term unsaturated flow in waste rock piles. GeoEdmonton 2008, Proc. 61st Canadian Geotechnical Conference and 9th Joint CSG/IAH-CNC Groundwater Conference, Edmonton, pp. 1492-1498.
Fala, O., Molson, J., Aubertin, M., Bussière, B., Chapuis, R.P. 2006. Numerical simulations of long term unsaturated flow and acid mine drainage at waste rock piles. Proceedings of the 7th International Conference on Acid Rock Drainage (ICARD), 26-30 March 2006, St. Louis, Missouri, R.I. Barnhisel (ed.). The
American Society of Mining and Reclamation, pp. 582-597.
Fala, O., Molson, J.W., Aubertin, M., Bussière, B. 2005. Numerical modelling of flow and capillary barrier effects in unsaturated waste rock piles. Mine Water & Environment 24(4): 172-185.
Freeze, R.A. 1980. A stochastic-conceptual analysis of rainfall-runoff processes on a hillslope. Water Resour. Res., 16 (2): 391-408.
Gerke, H.H., Molson, J.W., and Frind, E.O., 1998. Modelling the effect of chemical heterogeneity on
acidification and solute leaching in overburden mine spoils. Journal of Hydrology. Special Issue: Reactive Transport Modelling, 209: 166-185.
Mualem Y. 1976. A new model predicting the hydraulic conductivity of unsaturated porous media. Water Resour. Res. ;12:513-522.
Mbonimpa, M., Aubertin, M., Chapuis, R.P. 2002. Simple hydraulic functions using basic tailings properties. Proc. 6th Environmental Speciality Conference, Canadian Society for Civil Engineering, London, Ontario Mejia, J.M., Rodriguez-Iturbe, I. 1974. On the synthesis of random field sampling from the spectrum: an
application to the generation of hydrologic spatial processes. Water Resour. Res., 10 (4), 705-711. Miyazaki, 2006. Water Flow in Soils. Taylor & Francis, CRC, Boca Raton
Molson, J.W., Aubertin, M., Frind, E.O., and Blowes, D., 2006. POLYMIN, User Guide, A 2D multicomponent reactive transport model with geochemical speciation and kinetic sulphide oxidation, Dept. of Civil,
Geological and Mining Engineering, Ecole Polytechnique, Montreal.
Molson, J.W., Fala, O., Aubertin, M. and Bussière, B., 2005. Numerical simulations of sulphide oxidation, geochemical speciation and acid mine drainage in unsaturated waste rock piles, Journal of Contaminant Hydrology, Volume 78, Issue 4, 343-371
Molson, J.W., Fala, O., Aubertin, M. and Bussière, B., 2008. Geochemical transport modelling of acid mine drainage within heterogeneous waste rock piles. GeoEdmonton 2008, Proc. 61st Canadian Geotechnical Conference and 9th Joint CSG/IAH-CNC Groundwater Conference, Edmonton, pp. 1586-1593.
Nieber, J.L., Bauters T.W.J., Steenhuis, T.S., Parlange, J.-Y. 2000. Numerical simulation of experimental gravity-driven unstable flow in water repellent sand. Journal of Hydrology.231-232 : 295-307.
Richards, L. A. 1931. Capillary conduction of liquids through porous mediums. Physics, 1, 318-333
Romano, C.G., Mayer, K.U., Jones, D.R., Ellerbroek, D.A., and Blowes, D.W., 2003. Effectiveness of various cover scenarios on the rate of sulphide oxidation of mine tailings. Jour. of Hydrology 271: 171-187.
Schulze-Makuch, D., 2005. Longitudinal dispersivity data and implications for scaling behavior, Ground Water, 43 (3) , p443-456.
Simunek, J., Sejna, M., van Genuchten, Th.M. 1999. The HYDRUS-2D software package for simulating the two dimensional movement of water, heat, and multiple solutes in variably-saturated media. Version 2.0. U.S. Salinity Laboratory.
Smith, L., Freeze, R.A. 1979. Stochastic analysis of steady state groundwater flow in a bounded domain. Two-dimensional simulations. Water Resour. Res., 15(6): 1543-1559.
van Genuchten, M.Th. 1980. A closed-form equation for predicting the hydraulic conductivity of unsaturated soils. Soil Science Society of America Journal, 44: 892-898.
van Genuchten, M.Th., Leij, F.J., Yates, S.R. 1991. The RETC code for quantifying the hydraulic functions of unsaturated soils. USEPA 000/091/000. USEPA, Ada, OK.
Vereecken, H., Kasteel, R., Vanderborght, J.; Harter, T. 2007. Upscaling hydraulic properties and soil water flow processes in heterogeneous soils: a review. Vadose Zone Journal 6:1-28.
Walter, A.L., Frind E.O., Blowes, D.W., Ptacek, C.J. and Molson, J.W., 1994. Modelling of multi-component reactive transport in groundwater: 1. Model development and evaluation, Water Resources Research, 30(11), 3137-3148.
Wunderly, M.D., Blowes, D.W., Frind, E.O., and Ptacek, C.J., 1996. Sulfide mineral oxidation and subsequent reactive transport of oxidation products in mine tailings impoundments: A numerical model. Water Resources
Yates, S.R. and Warrick, A.W. 2002. Geostatistics. In Methods of Soil Analysis. Part 4: Physical Methods. Soil Science Society of America, Inc.