HAL Id: hal-02328645
https://hal.archives-ouvertes.fr/hal-02328645
Submitted on 25 Mar 2021HAL is a multi-disciplinary open access
archive for the deposit and dissemination of sci-entific research documents, whether they are pub-lished or not. The documents may come from teaching and research institutions in France or abroad, or from public or private research centers.
L’archive ouverte pluridisciplinaire HAL, est destinée au dépôt et à la diffusion de documents scientifiques de niveau recherche, publiés ou non, émanant des établissements d’enseignement et de recherche français ou étrangers, des laboratoires publics ou privés.
In situ real-time 3D observation of porosity growth
during composite part curing by ultra-fast synchrotron
X-ray microtomography
Basile de Parscau Du Plessix, Patrice Lefébure, Nicolas Boyard, Steven Le
Corre, Nicolas Lefèvre, Frédéric Jacquemin, Vincent Sobotka, Sabine Rolland
Du Roscoat
To cite this version:
Basile de Parscau Du Plessix, Patrice Lefébure, Nicolas Boyard, Steven Le Corre, Nicolas Lefèvre, et al.. In situ real-time 3D observation of porosity growth during composite part curing by ultra-fast synchrotron X-ray microtomography. Journal of Composite Materials, SAGE Publications, 2019, 53 (28-30), pp.4105-4116. �10.1177/0021998319846260�. �hal-02328645�
In situ real time 3D observation of porosity growth during
composite part curing by ultra-fast synchrotron X-ray
microtomography
Basile de Parscau du Plessix
1, Patrice Lefébure
1, Nicolas Boyard
2,
Steven Le Corre
2, Nicolas Lefèvre
2, Frédéric Jacquemin
3, Vincent
Sobotka
2, Sabine Rolland du Roscoat
41Airbus Central Research and Technology, chemin du Chaffault, Bâtiment A1, 44340
Bouguenais, France
2Laboratoire de Thermique et Energie de Nantes, UMR CNRS 6607, Université de
Nantes, La Chantrerie, rue Christian Pauc, CS 50609, 44306 Nantes cedex 3, France
3Institut de Recherche en Génie Civil et Mécanique, UMR CNRS, Université de Nantes,
58 rue Michel Ange, 44600 Saint-Nazaire, France
4Laboratoire 3SR, UMR CNRS 5521, Grenoble INP, Université Grenoble Alpes,
Domaine Universitaire, BP 53, 38041 Grenoble, France.
Abstract
The present study reports on an experimental development addressing 3D void growth in epoxy-based carbon fibre-reinforced composites during their curing process. For that purpose and to investigate autoclave condition effects, composites samples were cured according to different curing cycles by using a specially designed device, which was installed on a synchrotron beamline dedicated to ultra fast X-ray microtomography. Thus, 3D in situ images of the voids evolution could be obtained as a function of time,
temperature, pressure, initial water content and resin conversion degree, which are the driving factors of void size evolution during the polymerization cycles. Results confirm the combined roles of humidity and temperature on the porosity growth and highlight the complex shape of the generated bubbles. It is also emphasized that a sharp increase of the applied pressure during the curing cycle instantaneously reduces the pore size. Such results improve the understanding of the cure of composites parts and can finally be used as input data for modelling purpose or for validation of existing models.
Keywords
Carbon fibres ; Thermoset polymer-matrix composites ; Porosity/Voids ; X-ray microtomography ; in situ monitoring ; composite parts cure.
Introduction
Carbon fibre reinforced epoxy matrix prepregs are widely used for manufacturing of aeronautical parts. One of the major defects, which can occur during composite manufacturing, is the creation of voids. The impact of voids on mechanical properties has been largely investigated. It has been shown that over a critical volume content, voids induce a severe degradation of mechanical properties [1-5]. Porosity may induce damages, crack initiation and propagation [4,6] decreasing the interlaminar shear strength and flexural and compressible strength properties [1,3-4]. Some investigations showed also an impact of the presence of porosity on fatigue performances [2,5]. On a manufacturing point of view, this may lead to production rates drops, huge amount of derogation costs, excessive scraps, associated reworks and repair costs [7].
Nevertheless, the mechanisms of void creation and development are complex and opposing views are held concerning the origin of voids [36]. All the studies agree on the fact that voids are the result of micro-cavities, which are present in the material at the initial state and evolve under the effect of time, temperature, pressure, material polymerization degree and water concentrations. Some researchers [3, 7-10] claim that dissolved volatile and especially moisture are the primary sources of micro-cavities. Others [4, 11-13] also mentioned the possible role of the air, which is mechanically entrapped during the lay-up. Grunenfelder [9] investigated the effects of moisture dissolved in the resin on the porosity by producing different composite plates in an oven only under vacuum, for which prepreg plies were beforehand humidity-conditioned at different relative humidity levels. This investigation showed that different initial dissolved moisture contents result in different final void volume fractions and validate the predominant effect of moisture dissolved in the resin on the porosity creation. Campbell [7] gave an interesting explanation for this observation: since moisture is the most important volatile present in hot melt addition curing prepregs, the amount of absorbed moisture in the prepreg determines the resultant vapour pressure of volatiles generated during the cure cycle. Indeed, an increase in moisture content and temperature results in an increase of vapour pressure, which leads to void growth if the latter exceeds the resin pressure (addition of vacuum and autoclave pressure) while the resin is a liquid. When the resin gelation occurs, voids are finally locked into the resin matrix. Besides, temperature accelerates water diffusion phenomena between the voids and the resin, contributing also to the increase of the internal void pressure. Conversely, when the resin hydrostatic pressure exceeds the internal void pressure, water is dissolved in the resin, which leads to the porosity reduction size [11]. Moreover, the porosity evolution in a laminate during curing is currently guessed from models that are all based on numerous over-simplifying assumptions. The main concern is to limit the study to the spherical growth of a unique bubble surrounded only by resin [8,11,14-17] but improvements were recently proposed [32], taking into account the coupling between water diffusion, thermo-mechanical effects and matrix properties evolution. The existence of a boundary layer, accounting for moisture transfer modification around the bubble, is also proposed. However, the observations on cured samples show porosities with complex geometry, inhomogeneous sizes and distributions inside the laminate. Indeed, the assumption of the creation and developments of porosities due to moisture absorption included in these models need to be experimentally validated.
Nowadays, porosities are widely and classically studied experimentally by gravimetric method and optical microscopy, the micrographs being then quantified by 2D images analysis [13,18-20]. Over the years, many ex situ X-ray microtomography experiments have been performed to study porosities [21-26]. This technique is of particular interest since it can provide full 3D characterization of voids even in composites materials with an optically opaque matrix, including volume content, space distribution, and shape. Many information about this technique applied to polymer composites is available in [27], including other applications such as the evolution of mechanical behaviour (tensile or compressive failure, impact damage, fatigue). However, microscopy and microtomography experiments are for the moment only carried out at room temperature and on polymerized samples because of the drastic difficulties to prepare uncured samples for microscopy and because laboratory microtomography is too slow for acquisition of 3D image during curing. Such analysis does not provide any information on the evolution of porosity during the manufacturing process.
More recently, the development of synchrotron techniques has allowed to make in situ monitoring of mechanical testing [28], impregnation of fiber tow [29] and possible void transport [30], or also alloys solidification observations [31], as a means of visualizing and quantifying microstructural changes as a function of time. Considering these new capabilities offered by synchrotron microtomography, the purpose of the present study was thus to propose a new and original experimental set-up for 3D in situ monitoring of the void development inside thermosetting carbon fibre-reinforced composite during the curing process. The final objectives were ideally to determine the minimum size of voids, their physical origin (porosities due to compaction and/or moisture sorption), their repartition in the composite part, their size evolution and to validate an associated stop criterion.
In this work, the device and the associated methodology are built and tested in conditions of temperature, pressure, for samples with known initial water content and resin conversion degree, to get a qualitative evolution of the void content. Such parameters are the driven factors of void size evolution during the polymerization cycle.
Material and experimental procedure
The material is a high-performance CFRC prepreg based on HEXCEL M21-based resin and commonly used for manufacturing primary aerospace structures. This contains 34wt% epoxy resin (60vol% fibers). The resin is toughened by thermoplastic interleaves.
The samples were 32 QI plies thick with a symmetrical stacking [0/45/90/-45]4S. Due to experimental constraints and to achieve a significant representative volume, their geometrical shape was 20mm diameter cylinder with a thickness of 5.92mm, and was well above the size of representative volume element (the maximum pore size experimentally observed and without any coalescence was typically of 300µm).
Uncured and partially cured samples were thus prepared. The first ones were made from circular plies directly cut in the prepreg roll with a hollow punch. They were successively compacted each 4 plies during 15min under vacuum at room temperature. Core drill
sampling in a composite panel was used to obtain partially cured samples. The plate was cured beforehand at 120°C under vacuum, during a time leading to a conversion degree of 33%, the crosslinking kinetics being known [32]. Partially crosslinked samples were made for several reasons: i) it ensures to keep a good compaction state between plies during humidity aging, ii) water diffusion is reduced while increasing the conversion degree of reaction, limiting a possible partial desorption before X-ray tomography experiments but also avoiding a too large numbers of pores in the samples.
In order to investigate the effect of initial moisture content in the porosity development during the resin crosslinking, these samples were first dried at 30°C in an oven during 2h, as a reference condition. A preliminary desorption test, which was carried out at 30°C in an oven, showed that samples weights had reached equilibrium after 1 h. Indeed, most of the moisture contained in the specimens was assumed to be removed after 2 h.
The dried samples were then installed inside an environmental chamber (supplied by Climats company and assisted by Spiral 3 software) during 3 weeks, at 30°C and 84% of relative humidity. Now using the sorption model presented in [33], the amount of water absorbed by the composite can be estimated to 0.5wt% and 0.1wt% for raw and partially cured materials, respectively. It can be further noted that these conditions correspond to the shelf-life of the prepregs at room temperature.
Description of the experimental set-up
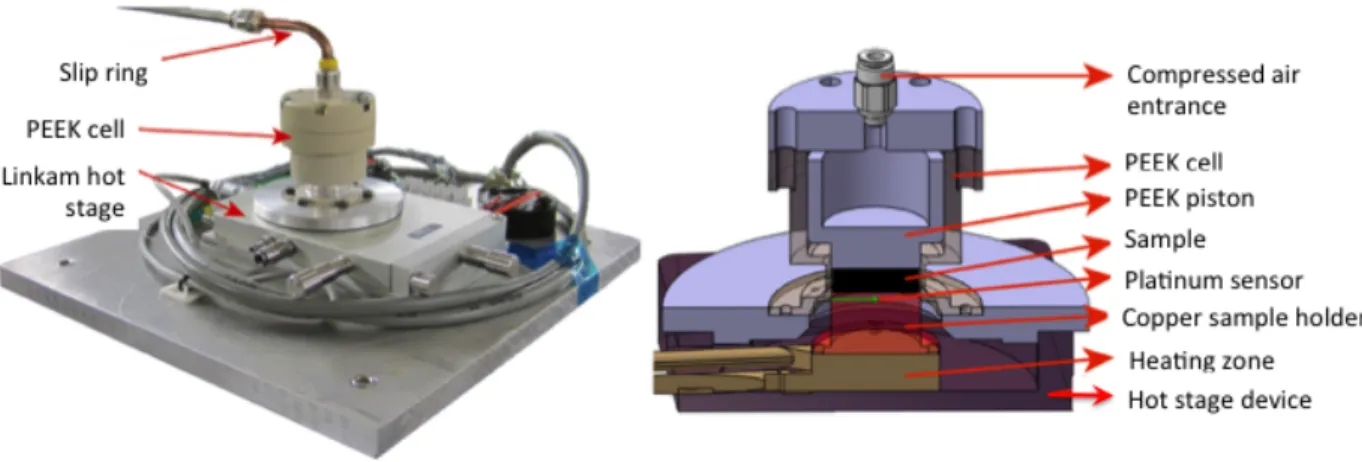
A specific device was developed in this work. It was aimed at applying a pressure and a temperature cycle in order to follow the microstructural evolutions of the prepreg during an X-ray microtomography experiment. It thus intended to be roughly representative of autoclave cure conditions. A strong technical constraint was to limitate any X-ray absorbing materials that constitute the set-up around the sample. For this purpose, a PEEK cylinder containing a piston for pressure application with compressed air, was specifically designed and fixed to a hot stage, as shown in Figure 1. PEEK has the advantage of having a rather low absorption of X-rays while keeping good mechanical properties during the heating.
situ growth voids during CRFC curing.
The absolute pressure (up to 0.8MPa) is controlled by a manometer and a slip ring is used to supply compressed air during the rotation of the microtomograph platform. Pressure value and uniformity were checked using a colour film (Fujifilm ultra superlow prescale) that was sensitive to pressure.
Sample heating was achieved thanks to a hot-stage Linkam TMS600. To ensure a good position of the sample with respect to the X-ray beam, a copper sample holder was machined and fixed on the heating plate before positioning the composite sample on its top surface (see Figure 1). A platinum temperature sensor was inserted as close as possible to the copper surface to measure the imposed temperature of the sample lower face. All power cables and thermocouple wires were connected to a slip ring connector to allow microtomograph platform rotation. Such set-up was thus installed in the X-ray microtomograph of the ID19 beamline at the European Synchrotron Radiation Facilities (Grenoble, France) similarly to [34]. To obtain sufficiently high resolved images with respect to void sizes, only the central zone of the sample (diameter: 5.5mm, height: 5.5mm) was analysed from a fast scan of 30s each 5 minutes during the curing phase. This scan consisted in 2016 X-ray 2D projections obtained from an incremental rotation along the vertical axis with a beam energy of 35keV. Such reduced acquisition time was an advantage for real-time observation, since it limits a potential size variation of the voids during the scan. After reconstruction of the 2D projections using Paganin method [35], 3D maps inside the composite cylinder were obtained, representing a volume of 2048 x 2048 x 2048 voxels3 (voxel volume: 2.75µm3). Additional post-treatment was done at ESRF to reduce slip rings defaults. Finally, these 3D maps could be cut in order to get cross sections of the CFRC and then to follow evolution of void shape.
Figure 2: Example of 3D image of porosity distribution obtained during the curing of composite sample, from set-up presented in Figure 1.
This document is the property of Airbus Group Innovations ; no part of it shall be reproduced or transmitted without the express prior written authorisation of Airbus Group Innovations, and its contents shall not be disclosed. © - Airbus group - 2015
Analyses8et8modélisation8du8développement8de8porosités8lors8de8la8cuisson8de8pièces8composites8thermodurcissables8hautes8performances
Compréhension8des8phénomènes
9 11/01/16
Observation8 in>situ8du8 développement8 de8porosités
"
Microbtomographie' rapide' à'rayons'X
"
Rayonnement' synchrotron' (ESRF)
"
Rotation' continue
Durée' d’acquisition' :'308secondes
Temperature and pressure cycles
During this first run at ESRF, two types of time-temperature-pressure cycles were tested, as displayed in Figure 3. For the first one (Figure 3a), the composite is heated under atmospheric pressure at 2°C/min up to 180°C: our aim was thus to check how the voids grew without pressure, up to a material rigidification level to be determined. This test should therefore address only the effects of temperature and polymerization on water diffusion and vaporization phenomena.
In the second one, we wanted to highlight the effect of the applied pressure on the pores growth. A size restriction or reduction is indeed expected when using a suitable level of pressure during cure. An isothermal dwell (T = 90°C) was therefore chosen to prevent from any crosslinking during which a 0,8MPa pressure was applied during about 10min and then released (see Figure 3b).
Figure 3: Temperature/pressure profiles to analyse (a) the void growth during an increase of temperature and conversion degree, (b) the void size variation during a variation of pressure, at
Results and discussions
Effect of water diffusion
Within the aim to investigate the effect of moisture dissolved in the resin on the growth of pores, a partially cured sample containing 0.1wt% of water was submitted to the curing cycle given on Figure 3a. The temperature profile is imposed on the lower face of the sample. Preliminary tests were done without X-rays to check the temperature field through the sample thickness. On the bottom face, temperature was measurement by a platinum probe inserted in the copper sample holder. On the top surface a thermocouple was temporarily inserted between the sample and the PEEK piston (see Fig. 1). Results demonstrated that the temperature difference increased with the imposed temperature and could reach 25°C for a set-point of 180°C. Such temperature gradient (4.22°C/mm) can be attributed to heat losses on the lateral and upper faces of the sample (the wall thickness of PEEK cylinder is too small to ensure a sufficient thermal insulation but is required to limit interactions with X-rays).
0 5 10 15 20 25 30 35 40 90 92 94 96 98 100 102 104 106 108 110 0 1 2 3 4 5 6 Co nv er si on d eg re e (%) Temp eratu re ( °C) Thickness (mm) t = 40 minutes Temperature conversion degree
Figure 4: Temperature and conversion degree profiles through the composite thickness at t = 40min and 75min, i.e. during the heating and isothermal steps.
As a consequence, the conversion degree field, naturally strongly coupled to the temperature one, was not homogeneous through the composite thickness. In order to get a better estimation of these parameters in time, the heat equation coupled to a crosslinking kinetics equation was solved in 1D along the sample thickness direction. A finite difference method with and an implicit time scheme was used and the boundary conditions described below were applied.
𝜌𝐶# 𝜕𝑇 𝜕𝑡 = 𝛻)⃗. 𝜆∇))⃗𝑇 + 𝜌∆𝐻 𝜕𝛼 𝜕𝑡 𝜕𝛼 𝜕𝑡 = 𝑘3(1 − 𝛼)89 + 𝑘:𝛼8;(1 − 𝛼)8<𝑓(𝛼 − 𝛼>?@(𝑇)) Boundary conditions: T(z = 0, t) = Texp1(t), T(z = e, t) = Texp2(t)
Initial conditions: T(t = 0, z) = T0, a(t = 0, z) = a0
where r=1550kg.m-3, Cp=1500J.kg-1.K-1, l=0.55W.m-1.K-1. The sample thickness is denoted e, Texp1 and Texp2 are the temperatures measured at the lower and upper surfaces respectively and a is the conversion degree associated to crosslinking.
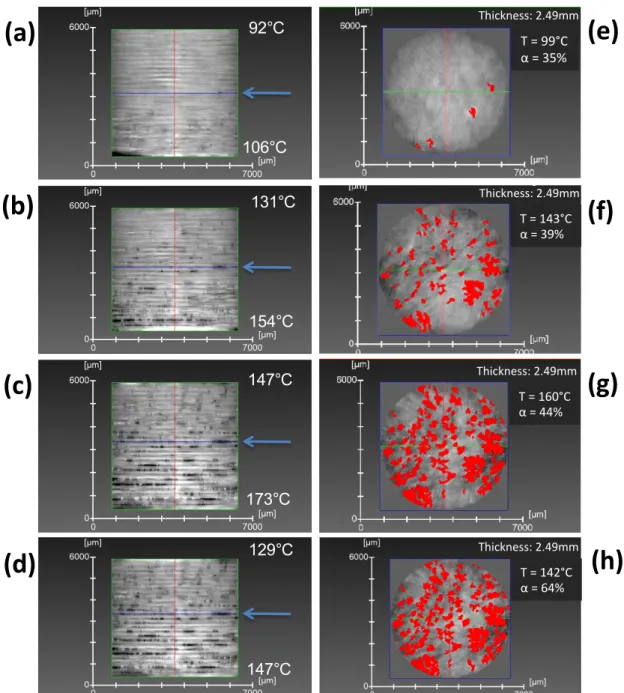
An example of temperature and conversion degree profiles is given in Figure 4 during the heating and isothermal steps. Such gradients implied that a heterogeneous distribution of pores could be expected and was confirmed, as shown in Figure 5 (a-d: pores are in black; e-h: pores are in red).
0 10 20 30 40 50 60 145 150 155 160 165 170 175 0 1 2 3 4 5 6 Co nv er si on d eg re e (%) Temp eratu re ( °C) Thickness (mm) t = 75 minutes Temperature Conversion degree
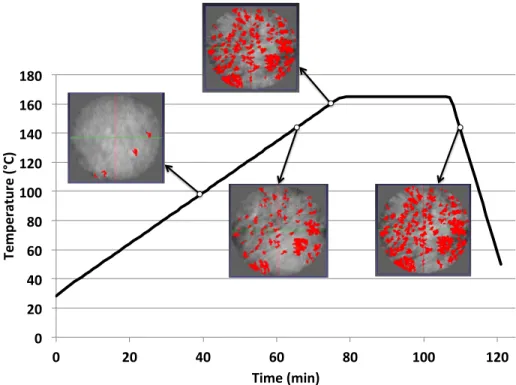
Figure 5: Distribution of pores during the heating (a: 40min, b: 65min, c: 75min) of the partially cured composite and subsequent cooling (d: 110min). e-h: Evolution of pore sizes and distribution in the plane of the sample indicated by a blue arrow drawn on (a-d) images. Figure 5(e-h) depicts the porosity development (in red) in the mid-plane of the sample at different instants of the temperature/pressure cycle. For each image, the calculated temperature and conversion degree are indicated for this location through the sample thickness. In this qualitative analysis, pores contours of the studied 2D slice were detected visually and manually filled in red. No automatic image treatment was used at this stage. Figure 6 illustrates the image acquisition during the selected curing cycle. At the beginning of the experiment at 30°C, no porosity was detected, meaning that if pores existed, their sizes were lower than the voxel size (resolution for this specific set up: 2.75µm). It also
This document is the property of Airbus Group Innovations ; no part of it shall be reproduced or transmitted without the express prior written authorisation of Airbus Group Innovations, and its contents shall not be disclosed. © - Airbus group - 2015
Analyses8et8modélisation8du8développement8de8porosités8lors8de8la8cuisson8de8pièces8composites8thermodurcissables8hautes8performances
Compréhension8des8phénomènes
Cuisson' d’un'échantillon' partiellement'polymérisé' (35%)'
après'vieillissement' humide'(30°C'/'84%RH' /'7'j)
Développement8des8porosités8
10 11/01/16 106°C 92°C 154°C 131°C 173°C 147°C 147°C 129°CThis document is the property of Airbus Group Innovations ; no part of it shall be reproduced or transmitted without the express prior written authorisation of Airbus Group Innovations, and its contents shall not be disclosed. © - Airbus group - 2015
Analyses8et8modélisation8du8développement8de8porosités8lors8de8la8cuisson8de8pièces8composites8thermodurcissables8hautes8performances
Compréhension8des8phénomènes
Cuisson' d’un'échantillon' partiellement'polymérisé' (35%)'
après'vieillissement' humide'(30°C'/'84%RH' /'7'j)
Développement8des8porosités8
10 11/01/16 106°C 92°C 154°C 131°C 173°C 147°C 147°C 129°C Thickness: 2.49mm T = 99°C α = 35% Thickness: 2.49mm T = 143°C α = 39% Thickness: 2.49mm T = 160°C α = 44% Thickness: 2.49mm T = 142°C α = 64%(a)
(b)
(c)
(d)
(g)
(f)
(e)
(h)
demonstrated that partial curing of prepreg samples occurred in good conditions.
Figure 6: Overview of the image capture during the temperature cycle depicted by Figure 3a. The pores are expected to grow when their internal vapour pressure exceed the one imposed on the sample, depending also on the temperature. Thus, the pores start to grow when the temperature reaches 100°C at atmospheric pressure, which was experimentally observed in Figures 5a and 5e. Note that in this case they are mainly located in the inter-layer domains (between two consecutive plies), which are resin-rich areas. The pores (size and number) went on growing due to water diffusion and to the increase of vapour pressure, directly linked to the temperature evolution (see Figures 5b-5f and 5c-5g). Because of the temperature gradient, the pores density was higher where the temperature was higher. The images also highlight that the pores had complex shapes at this stage of development, way far from a spherical geometry, and that their growth seemed to be faster in the sample plane than in the vertical axis. Such limitation in the thickness direction is arguably to be attributed to the role of fibres. The increase of porosity continued up to a conversion degree roughly equal to 55%, which was slightly higher than the gel point of the resin (agel = 45%). The pore growth was then locked up to the end of the experiment, including during the cooling (Figures 5d and 5h).
0 20 40 60 80 100 120 140 160 180 0 20 40 60 80 100 120 Temp eratu re ( °C) Time (min)
This document is the property of Airbus Group Innovations ; no part of it shall be reproduced or transmitted without the express prior written authorisation of Airbus Group Innovations, and its contents shall not be disclosed. © - Airbus group - 2015
Analyses8et8modélisation8du8développement8de8porosités8lors8de8la8cuisson8de8pièces8composites8thermodurcissables8hautes8performances
Compréhension8des8phénomènes
Cuisson' d’un'échantillon' partiellement'polymérisé' (35%)' après'vieillissement' humide'(30°C'/'84%RH' /'7'j) Développement8des8porosités8 10 11/01/16 106°C 92°C 154°C 131°C 173°C 147°C 147°C 129°C
This document is the property of Airbus Group Innovations ; no part of it shall be reproduced or transmitted without the express prior written authorisation of Airbus Group Innovations, and its contents shall not be disclosed. © - Airbus group - 2015
Analyses8et8modélisation8du8développement8de8porosités8lors8de8la8cuisson8de8pièces8composites8thermodurcissables8hautes8performances
Compréhension8des8phénomènes
Cuisson' d’un'échantillon' partiellement'polymérisé' (35%)' après'vieillissement' humide'(30°C'/'84%RH' /'7'j)
Développement8des8porosités8
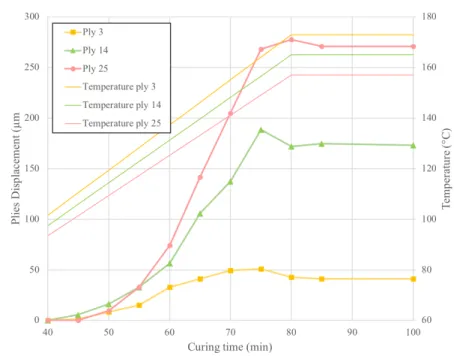
10 11/01/16 106°C 92°C 154°C 131°C 173°C 147°C 147°C 129°CFigure 7: Displacement of some plies during the curing path of Figure 3a.
Still on the same curing test, images were also analysed using the Avizo 3D image analysis software but unfortunately a full quantitative analysis of the growth kinetics of our samples was not possible. This was probably due to an excessive displacement of slices during the 30s of each scan. In figure 7, three plies of one single sample selected at different initial heights were followed manually along the curing cycle. Ply 3 is located near the bottom surface, close to the heat source, ply 14 is right in the middle of the sample whereas ply 25 is about the top of the sample. Displacements are obtained from the direct measurement of the distance in pixels of the centre of the considered layer to the bottom of the image. This position was calculated as the average of the location of the corresponding lower and upper interfaces ones, which can be seen to be rather easily determined from vertical cuts as shown in figures 5(a-d). All slices exhibit a similar increase, which is not proportional to temperature only. As it can be expected from Figures 5 and 6, some additional expansion is obviously induced by the porosity development, thus generating non-linear expansion curves (Fig. 7). Moreover, the crosslinking kinetics model coupled to the heat equation indicates that the reaction restarts at around 50min from a=35% and reaches a=44% in the sample mid-plane at 75min (beginning of the isothermal plateau at 180°C), as visible in Figure 8. In the same time, a small decrease of the plies height can also be seen at this time, which arguably corresponds to the shrinkage induced by the crosslinking. The curing continues up to 110min (a=64% for ply 15) and is characterized by a strong gradient through the sample thickness due to the existing temperature gradient (see Figure 4). However, we do not succeed in observing further shrinkage during the isothermal step with our basic approach of ply displacement, which may not be sensitive enough at this point. As visible from this plot, the displacement is of the order of 15µm/min, that corresponds to 5 pixels/min. During our 30s scans, the displacement of one slice was therefore of the order of 2,5 pixels, which is expected to produce a vertical blur in the reconstructed image.
This value nevertheless seems rather acceptable so that maybe other more local phenomena also contribute to this problem. Indeed, fast porosities motion during growth is likely to occur and suspected to create such effects.
Anyhow, whatever the adopted segmentation method, a full detection of bubbles was impossible for the whole volume of a same scan and so for the whole scans. At some particular locations, as illustrated in figure 8(a), some bubbles could be followed individually in time, making use of the combination of a contour detection and a grey level thresholding. This series of images clearly highlight the very complex shape of bubbles. As mentioned above, their growth is strongly affected by the heterogeneity of the surrounding material which contains thermoplastic nodules and fibres which effect was already discussed.
This almost planar growth suggests an alternate method for the quantification of the bubbles growth kinetics based on a 2D approach. As shown on figure 8(b), bubbles can be seen as having a constant height 𝐻 and equivalent radius 𝑅BC, the latter being estimated from the area 𝐴 of a representative 2D slice of the considered bubble as: 𝑅BC = E𝐴 𝜋⁄ . This 2D analysis does not suffer from the blur problem observed on the top and bottom surfaces and therefore provides a better precision.
Figure 8: Study of the growth of a single bubble taken in ply 14, in the center of the sample - (a) 3D segmentation at different times ; (b) definition of the equivalent flat and
cycle.
An example of three bubbles growth kinetics is given in figure 9. Those bubbles are selected again inside plies 3, 14 and 25. Their initial equivalent radius was respectively 1.71mm, 1.08mm and 1.06mm and their normalized equivalent radius is plotted as a function of time together with the estimated evolution of the conversion degree. We confirm here again that the growth stops for a conversion degree comprised between 50% and 55%. As visible from the radii growth curves, the representation in terms of normalized radius is convenient but hinders the effect of the initial size of bubbles which may also influence the growth kinetics. One would naturally expect that the bubble of ply 3 would grow more than the one of ply 14 due to temperature, but other phenomena can alter this trend. In particular, under the same thermodynamic conditions, a bubble of bigger diameter such as bubble in ply 3 would grow slowlier under the effect of water diffusion than a bubble of lower diameter.
Figure 9: Evolution of the equivalent radius of some porosities taken at different heights as a function of time plotted together with the estimated conversion degree of the
corresponding slice.
Effect of the applied pressure
The influence of the application of pressure was also addressed, since it should influence the evolution of porosities during the cure of the thermoset composite component. In industrial curing techniques, a depressurization is first applied by a vacuum bag which role is first to remove as much as possible the interlaminar air and other volatiles. After this step, the vacuum simply results in an applied pressure for the prepreg, with additional autoclave pressure or not, a situation that can be reproduced by our device, though it makes use of a rigid piston. In our test, an uncured sample was tested, following the cycle
35 40 45 50 55 60 65 70 0 0,5 1 1,5 2 2,5 3 3,5 4 40 50 60 70 80 90 100 D egr ee of c onve rs ion ( % ) Req /Req ,0
Curing Time (min)
Ply 3 Ply 14 Ply 25 Ply 25 Ply 14 Ply 3
presented in Figure 3b. It was checked that the increase of the conversion degree was negligible (<5%) during the time of the experiment. It was important to notice that even if this uncured sample was partially dried before testing, it did not prevent the observation of the pressure effect, at least in terms of pore size variation.
The results obtained during this test are presented in Figure 10, where the evolution of porosity in the sample mid-plane can be observed. The trend was similar in other inter-plies, for the same temperature.
Figure 10: Evolution of porosity in the mid-plane of an uncured sample, in isothermal conditions (90°C), according to the applied absolute pressure. (a) 40min, P = 0.1 MPa; (b) 44min, P = 0.8
MPa, (c) 54min, P = 0.1 MPa.
Since the experiment was carried out at 90°C and at atmospheric pressure, no pores induced by moisture diffusion were expected initially but 3D images demonstrated the opposite (Figure 10a). Such discrepancy could be explained by the sample preparation, which favoured a mechanical entrapment of air at ply interfaces, because the compaction process was not optimal. When the pressure was applied (Figure 10b), the dimensions of porosities decreased dramatically and almost instantaneously. However, some of them did not disappear totally, most probably because the pressure cannot be totally homogeneous in a composite sample. Such an observation is in agreement with the theory: when the pressure
40 min / P = 0.1 MPa (a) 44 min / P = 0.8 MPa (b)
applied on the composite exceeds the internal pressure of pores, air is dissolved in the resin, leading to a reduction of pore size. To the opposite, porosities are created through gas diffusion from the resin if the vapour pressure is higher than the applied one. Figure 10c supports such behaviour since pores can grow again when the pressure is removed. As visible when comparing Figure 10a and Figure 10c, new pores are created during the pressure release with different shapes and locations, which supports again the idea of air dissolution.
Conclusions
This work is an original contribution to the development of in situ monitoring of the creation and the growth of pores occurring during the cure of thermoset composite materials. For this purpose, a specific set-up was developed and installed on an X-ray ultra fast microtomography beamline at ESRF to obtain in situ 3D images. It allows a continuous analysis in time of the effects of curing parameters such as temperature and pressure on the porosity evolution. Uncured and partially cured samples were prepared and humidity-conditioned since moisture is considered as a major source of pores.
In a first stage, a moisture-saturated partially cured sample was heated in the developed set-up to observe the effect of water diffusion. Even if temperature and conversion degree gradients exist, the regular acquisition of 3D images clearly demonstrates that the growth of pores is induced by water diffusion and happens when the vapour pressure is higher than the pressure applied on the sample. Moisture absorption is thus confirmed to be an important source of porosities.
In a second stage, we also emphasized that a sharp increase of the applied pressure during the curing cycle instantaneously reduced the pore size. For the sake of simplicity, the temperature was kept constant during this experiment and lower than 100°C, so that the conversion degree was nearly constant as well as the moisture-induced pore growth. In this case, only the diffusion of entrapped air inside the resin is at the origin of pores formation. In a practical application, the amplitude of this pore size reduction will be directly governed by the relation between the external pressure level with respect to the gas pressure in the pores (including water vapour pressure), the time, the temperature and the evolution of the conversion degree.
All the experiments clearly demonstrate that the biggest pores are mainly located in the resin-rich interfaces between two successive plies, though some other tests, not presented here, also show the possibility of a growth in the fibre rich areas. During growth, bubbles shapes become complex, far from the classical spheres considered in predicting models. This observed complexity is arguably the result of the surrounding heterogeneous medium (fibres, thermoplastic nodules) and of the merging of adjacent pores.
It was also observed that, if no air is mechanically entrapped during laminate samples preparation, the pores, if they initially exist, have a lower size than the microtomograph resolution (2.75µm in our specific configuration; this is a size close to the detection limit of the ultrasonic NDT, which is used for health monitoring of a composite part).
Finally, we notice that the pore growth is stopped when the conversion degree reaches a value (between 50 and 55% here). A minimum rigidity level must therefore be reached in the rubbery solid state in order to avoid this growth phenomenon.
These first experimental results are very promising to improve the comprehension of pore development during the curing of thermoset composite materials. Next X-ray microtomography synchrotron experiments with improved set-up will be optimized for a higher quality of 3D image, which should facilitate the in situ tracking of voids and overall quantitative analyses. Such data will provide useful information for theoretical and numerical models used to predict void size evolution.
Acknowledgements
The authors gratefully acknowledge financial support from Airbus SAS.
References
1. Tang J, Lee W, and Springer G. Effects of cure pressure on resin flow, voids and mechanical properties, J Compos Mater 1987; 21, 421 – 440.
2. De Almeida S and Neto Z. Effect of void content on the strength of composite laminates.
Compos Struct 1994; 28, 139 – 148.
3. Olivier P, Cottu J and Ferret B. Effects of cure cycle pressure and voids on some mechanical properties of carbon/epoxy laminates. Composites, 1995; 26, 509 – 515. 4. Costa M, De Almeida S and Rezende M. The influence of porosity on the interlaminar
shear strength of carbon/epoxy and carbon/bismaleimide fabric laminates. Compos Sci
Technol 2001; 61, 2101–2108.
5. Chambers A, Earl J, Squires C and Suhot M. The effect of voids on the flexural fatigue performance of unidirectional carbon fibre composites developed for wind turbine applications. Int J Fatigue 2006; 28, 1389 – 1398.
6. Wisnom M, Reynolds T and Gwilliam N. Reduction in interlaminar shear strength by discrete and distributed voids. Compos Sci Technol 1996; 56, 93 – 101.
7. Campbell F, Mallow A and Browning C. Porosity in carbon fiber composites-an overview of causes. J Adv Materials 1995; 18 – 33.
8. Kardos J, Dudukovic M and Dave R. Void growth and resin transport during processing of thermosetting matrix composites. Adv Poly Sci 1986; 80, 102 – 123.
9. Grunenfelder LK and Nutt SR. Void formation in composite prepregs –effect of dissolved moisture. Compos Sci Technol 2010; 70(16), 2304–2309.
10. Agius K, Magniez K and B. Fox B. Cure behaviour and void development within rapidly cured out-of-autoclave composites. Compos Part B-Eng 2013; 47, 230–237.
experimental methods for determining the growth and collapse of gas bubbles. Compos
Manuf 1994; 5(3), 139 – 147.
12. Huang H and Talreja R. Effects of void geometry on elastic properties of unidirectional fiber reinforced composites”, Compos Sci Technol 2005; 65, 1964–1981.
13. Liu L, Zhang B, Wang D and Wu Z. Effects of cure cycles on void content and mechanical properties of composite laminates. Compos Struct 2006; 73, 303–309. 14. Epstein PS and Plesset, MS. On the stability of gas bubbles in liquid-gas solutions. J
Chem Phys 1950; 18(11), 1505–1509.
15. Scriven LE. On the dynamics of phase growth. Chem Eng Sci 1959; 10(1-2), 1-13. 16. H. Kwak and Y. Kim, “Homogeneous nucleation and macroscopic growth of gas bubble
in organic solutions”, Int J Heat Mass Tran 1998; 41(4-5), 757–767.
17. Ledru Y. Etude de la porosité dans les matériaux composites stratifiés aéronautiques. PhD dissertation, Université de Toulouse, 2009.
18. Ledru Y, Piquet R, Michel L, Schmidt F and Berhnart G. Quantification 2-d et 3-d de la porosité par analyse d’images dans les matériaux composites stratifiés aéronautiques.
Comptes Rendus des JNC 16, 2009.
19. Little J, Yuan X and Jones M. Characterisation of voids in fibre reinforced composite materials. NDT & E Int, 2012; 46, 122 – 127.
20. George A and Drechsler K. Void characterization and membrane selection in the vacuum assisted process. In European Conference on Composite Materilas 15, Venice, Italy, 2012.
21. HernandezS, Sket F, Molina-Aldareguia J, Gonzalez C and LLorca J. Effect of curing cycle on void distribution and inter-laminar shear strength in polymer-matrix composites.
Compos Sci Technol 2011; 71, 1331–1341.
22. HernandezS, Sket F, Gonzalez C and LLorca J. Optimization of curing cycle in carbon fiber-reinforced laminates: void distribution and mechanical properties. Compos Sci
Technol 2013; 85, 73–82.
23. Le T, Dumont P, Orgéas L, Favier D, Salvo L and Boller E. X-ray phase contrast microtomography for the analysis of the fibrous microstructure of SMC composites.
Compos Part A-Appl S 2008; 39, 91–103.
24. Centea T and Hubert P. Measuring the impregnation of an out-of-autoclave prepreg by micro-ct. Compos Sci Technol 2011; 71, 593–599.
25. Lambert J, Chambers A, Sinclair I and Spearing S. 3D damage characterisation and the role of voids in the fatigue of wind turbine blade materials. Compos Sci Technol 2012; 72, 337–343.
26. Sisodia SM, Garcea SC, George AR, Fullwood DT, Spearing SM and Gamstedt EK. High-resolution computed tomography in resin infused woven carbon fibre composites with voids. Compos Sci Technol 2016; 131, 12-21.
27. Garcea SC, Wang Y, Withers PJ. X-ray computed tomography of polymer composites.
Compos Sci Technol 2018; 156, 305-319.
28. Latil P, Orgéas L, Geindreau C, Dumont P and Rolland du Roscoat S. Towards the 3D in situ characterisation of deformation micro-mechanisms within a compressed bundle of fibres. Compos Sci Technol 2011; 71(4), 480–488.
29. Vila J, Sket F, Wilde F, Requena G, Gonzalez C, Llorca J. An in situ investigation of microscopic infusion and void transport during vacuum-assisted infiltration by means of X-ray computed tomography. Compos Sci Technol 2015; 119, 12-19.
30. Larson NM and Zok FV. Insights from in-situ X-ray computed tomography during axial impregnation of unidirectional fiber beds. Compos Part A-Appl S 2018; 107, 124-134. 31. Limodin N, Salvo L, Boller E, Suéry M, Felberbaum M, Gailliègue S and Madi K. In situ
and real-time 3-D microtomography investigation of dendritic solidification in an Al-10wt% Cu alloy. Acta Mater 2009; 57(7), 2300–2310.
32. De Parscau du Plessix B, Le Corre S, Jacquemin F, Lefebure P and Sobotka V. Improved simplified approach for the prediction of porosity growth during the curing of composite parts. Compos Part A-Appl S 2016; 90, 549-558.
33. De Parscau du Plessix B, Jacquemin F, Lefébure P and Le Corre S. Characterization and modeling of the polymerization-dependent moisture absorption behaviour of an epoxy-carbon-fiber-reinforced composite material. J Compos Mater 2016; 50, 2495-2505. 34. Ferre Sentis D, Orgéas L, Dumont PJJ, Rolland du Roscoat S, Sager M, Latil P, 3D in
situ observations of the compressibility and pore transport in Sheet Moulding Compounds during the early stages of compression moulding. Compos Part A-Appl S 2017; 92, 51-61.
35. Paganin, D, Mayo, SC, Gureyev TE, Miller PR and Wilkins SW. Simultaneous phase and amplitude extraction from a single defocused image of a homogeneous object. J
Microsc-Oxford 2002; 206, 33–40.
36. Mehdikhani, M., Gorbatikh, L., Verpoest, I., & Lomov, S. V. Voids in fiber-reinforced polymer composites: A review on their formation, characteristics, and effects on mechanical performance. Journal of Composite Materials 2018.