HAL Id: hal-02289915
https://hal.archives-ouvertes.fr/hal-02289915
Submitted on 17 Oct 2019HAL is a multi-disciplinary open access archive for the deposit and dissemination of sci-entific research documents, whether they are pub-lished or not. The documents may come from teaching and research institutions in France or abroad, or from public or private research centers.
L’archive ouverte pluridisciplinaire HAL, est destinée au dépôt et à la diffusion de documents scientifiques de niveau recherche, publiés ou non, émanant des établissements d’enseignement et de recherche français ou étrangers, des laboratoires publics ou privés.
Impact of atmospheric water vapor on the thermal
decomposition of calcium hydroxide: a universal kinetic
approach to a physico-geometrical consecutive reaction
in solid–gas systems under different partial pressures of
product gas
Nobuyoshi Koga, Loïc Favergeon, Satoki Kodani
To cite this version:
Nobuyoshi Koga, Loïc Favergeon, Satoki Kodani. Impact of atmospheric water vapor on the thermal decomposition of calcium hydroxide: a universal kinetic approach to a physico-geometrical consecutive reaction in solid–gas systems under different partial pressures of product gas. Physical Chemistry Chemical Physics, Royal Society of Chemistry, 2019, 21 (22), pp.11615-11632. �10.1039/C9CP01327J�. �hal-02289915�
Impact of atmospheric water vapor on the thermal decomposition of
calcium hydroxide: a universal kinetic approach to a physico-geometrical
consecutive reaction in solid–gas systems under different partial pressures
of product gas
Nobuyoshi Koga,
1,*Loic Favergeon,
2and Satoki Kodani
11
Department of Science Education, Graduate School of Education, Hiroshima University,1-1-1 Kagamiyama, Higashi-Hiroshima 739-8524, Japan
2
Mines Saint-Etienne, Univ. Lyon, CNRS, UMR 5307 LGF, Centre SPIN, F-42023 Saint-Etienne, France
Abstract
Thermal decomposition of Ca(OH)2 under atmospheric water vapor exhibits special features, including an induction period (IP) and a subsequent sigmoidal mass-loss behavior under isothermal conditions. Atmospheric water vapor reduces the reaction rate at a specific temperature and causes a systematic shift of the mass-loss curve, which was recorded at a specific heating rate, to higher temperatures as the water vapor pressure, p(H2O), increases. The challenge in this study was to universally describe the kinetics of thermal decomposition under various p(H2O) conditions by introducing an accommodation function in the fundamental kinetic equation. The accommodation function in the multiplied form of two p(H2O) components with a variable exponent in each component was derived according to the classical nucleation and interface reaction theories. The universal kinetic approach was realized by applying the accommodation function to the formal kinetic analyses of the Arrhenius plot for the IP and the Friedman plot for the mass-loss process. Furthermore, the overall reaction process under isothermal conditions was analyzed kinetically based on the physico-geometrical consecutive reaction model, which was composed of an IP, a surface reaction (SR), and a phase boundary-controlled reaction (PBR). Subsequently, the kinetic parameters for each physico-geometrical reaction step were determined by the modified Arrhenius plot with the accommodation function. The impact of the atmospheric water vapor on the kinetics of thermal decomposition was characterized in connection with the physico-geometrical reaction mechanisms through the interpretation of the kinetic parameters and these variation behavior patterns as the overall reaction advanced.
Keywords:
thermal decomposition, Ca(OH)2, water vapor, kinetic mechanism, accommodation function
1. Introduction
The impact of the partial pressure of a gaseous reactant or a product in the reaction atmosphere on the kinetics of the reversible reactions in solid–gas systems, which may be thermal decomposition of solids or solid–gas reactions, is one of the intrinsic problems for the kinetic description.
From a simple consideration of chemical equilibrium, an increase in the partial pressure of C(g) in the reaction atmosphere reduces the overall reaction rate of the thermal decomposition of solids and increases the rate of the solid–gas reactions at a selected temperature. This type of behavior is a generally observed phenomenon for reactions in solid–gas systems.1–11
At the same time, different phenomena have also been observed through the effect of atmospheric gas on the reaction rates. The Smith–Topley effect details an exotic phenomenon observed for the thermal dehydration of inorganic hydrates. 12–16 Initially, the overall reaction rate of thermal dehydration at a selected temperature is rapidly reduced by introducing water vapor with a low water vapor pressure, p(H2O), value into the reaction atmosphere. However, the reaction rate recovers when water vapor with a higher p(H2O) value is introduced and increases continuously within the range of p(H2O). After the reaction rate is attained the maximum rate at a certain p(H2O) value, the reaction rate decreases with further increases in p(H2O). This phenomenon was first reported for the thermal dehydration of MnC2O4·2H2O by Topley and Smith17,18 and was subsequently confirmed by Volmer and Seydel.19 The similar trends were also reported for the thermal dehydration of many inorganic hydrates, as summarized by L’vov et al.20 Alternatively, the opposite effect is noted for different gases that evolve simultaneously via the thermal decomposition of solids. Acceleration of the overall reaction rate at a constant temperature and significant shifts in the mass-loss curves to the lower temperatures under nonisothermal conditions at a heating rate b with increasing p(H2O) value in the reaction atmosphere are often observed during the thermal decomposition of several solids, in which water vapor evolves as the product.21–29 Examples of these types of reactions include the thermal decomposition of Cu2CO3-(OH)2,21–24 NaHCO3,25,26 Zn5(CO3)2(OH)6,27,28 and CH3COOAg.29 Conversely, the atmospheric CO2, which is the other gaseous product during the thermal decompositions of Cu2CO3(OH)2, NaHCO3, and Zn5(CO3)2(OH)6, decreases the reaction rate at a temperature.23,25,27 Thus, the atmospheric H2O and CO2 that evolve simultaneously during the aforementioned thermal decomposition processes tend to exhibit opposite effects on the overall rate of reaction. This complex phenomenon was clearly observed when a sample controlled thermal analysis technique30,31 was used to control the evolution rates of H2O and CO2 to be constant during the course of reaction and by noting shifts in the reaction temperature profile to the lower and higher temperatures, which were due to the experimentally configured changes in the partial pressure of atmospheric H2O and CO2, respectively.23,25,27 When an atmospheric gas reacts with the solid product of a thermal decomposition reaction, the thermal decomposition and solid–gas reactions occur as consecutive process constrained by the physico-geometrical features of the component reactions. Such examples can be seen in the thermally induced carbonation of LiOH·H2O and Ca(OH)2.11,32 The catalytic effects of atmospheric water vapor on the crystallization of ZrO2 gel33,34 and sintering processes of both MgO35–37 and TiO238 were also reported. These examples are indicative of the influence of atmospheric water vapor on crucial physico-geometrical reaction steps involved in the thermal decomposition of solids and solid–gas reactions, even if the water vapor is neither the reactant nor the product of the overall chemical reaction. An example of this is the thermal decomposition of Ag2CO3, in which the overall reaction to form Ag2O and CO2 is accelerated by atmospheric water vapor.39,40
Among these complex kinetic behaviors induced by the presence of atmospheric gases, the decrease in the reaction rate for the thermal decomposition of solids and the increase in the reaction rate for solid–gas reactions at a selected temperature has long been subject to theoretical explanation and formulation of kinetic equations.1,2,41–
49
One possible way to formulate the kinetic equation with consideration for the impact of the partial pressure of C(g), p(C(g)), is to introduce an accommodation function,50–55 a(p(C(g)), Peq(T)), into the fundamental kinetic equation that describes the reaction rate of a single-step reaction as a function of temperature (T) and the fractional reaction (α).
d
d = exp − C g ,
(2)
where A, Ea, and R are the Arrhenius preexponential factor, activation energy, and gas constant, respectively. Peq(T) is the equilibrium pressure of the reversible reaction of eqn (1). The function f(α) is the kinetic model function that describes the changes in the reaction rate as the reaction progresses at a constant temperature. The equilibrium pressure, Peq(T), for the forward reaction of eqn (1) is expressed by the following equation:
= exp !−∆#$°&
(3)
where ∆rG° is the standard Gibbs energy for the reaction. At a constant temperature, eqn (2) is rewritten as
follows:
d
d = ' C g ,
(4)
where k is the rate constant. Various forms of a(p(C(g)), Peq(T)) have been derived and used for describing reaction kinetics in solid–gas systems.1-10, 41, 56,57 Among these accommodation functions, a simple function has been widely used in the practical kinetic analysis for the thermal decomposition of solids with consideration for the influence of p(C(g)).1-3, 7
C g , = 1 −) * +,-. / (5)
The accommodation function of eqn (5) is derived simply by considering the contribution of the reverse reaction in the overall reaction rate.1 A comparable form of the accommodation function has also been derived by focusing on the component reaction steps of gas absorption on the intermediate layer,42 gaseous diffusion via the solid-product layer,44 and the formation of an active solid product.3 The accommodation function of eqn (5) is also derived more generally based on the transition state theory.48 However, application of eqn (2) with the accommodation function of eqn (5) for kinetic calculations sometimes results in the varying Arrhenius-type plots for the respective reaction processes under different p(C(g)) values; these plots shift systematically to higher temperatures with the increase of p(C(g)).7 These results imply that the equation cannot universally describe the kinetic behaviors of the reaction under different p(C(g)) values. For a rigorous description based on the fundamental kinetic equation, which assumes a single-step reaction characterized by a constant Ea value, alternative forms for the accommodation function should be utilized to formulate a kinetic equation universally applicable to the process in solid–gas systems under different p(C(g)) conditions. On the other hand, apparent variations of calculated Ea with p(C(g)) have been subjected to correlation analysis, and arguments have been made for finding a theoretical background of possible variations in Ea with p(C(g)).47
constrained by the physico-geometrical properties of the reaction mechanism.16,52,58 In many cases, mass and heat transfer phenomena largely influence on the apparent kinetic behavior.59–62 Since a surface of reactant solid is the most reactive site, the overall reaction proceeds via the physico-geometrical consecutive processes comprising the surface and subsequent internal reactions. In turn, these reactions are characterized by surface nucleation and growth processes, as well as advancement of the reaction interface toward the center of the original solid reactant.16,52,58 In some cases, a significant induction period (IP) is also observed prior to the surface reaction (SR).63–69 Such heterogeneous characteristics of the reaction and any significant impact of the mass and heat transfer phenomena are responsible for the numerous observations induced by atmospheric gases. Therefore, in addition to having a universal kinetic description for these processes under various p(C(g)) conditions, investigation into the impact of p(C(g)) on each component physico-geometrical reaction step must be explored separately in order to gain further insights into the fundamental problems of reaction kinetics that are often encountered in solid–gas systems. To this end, in this study, we focus on the thermal decomposition of Ca(OH)2 under various water vapor pressure values, p(H2O).
Ca(OH)2 (s) ⇄ CaO (s) + H2O (g) (6)
This reaction is a well-known reversible process, and thermal decomposition rate is significantly suppressed by the presence of atmospheric water vapor.11,70–72 The overall mass-loss behavior observed during thermal decomposition has been explained via the contracting-geometry-type reaction model.72 At the same time, the two-step physico-geometrical consecutive processes of surface and internal reactions was predicted using kinetic analysis.11,70 In addition, prereaction structural distortion is a reported trigger for thermal decomposition reaction,73–75 in which the characteristic temperatures of structural distortion are strongly dependent on atmospheric p(H2O). Previously reported trends in the thermal decomposition of Ca(OH)2 indicate the characteristics of the physico-geometrical consecutive process and the impact of atmospheric p(H2O) on the kinetics of each component reaction step, which are desirable features for the purpose of the present kinetic study. There is a need to describe universal kinetics for the thermal decomposition processes under various p(H2O) conditions and to separately interpret the impact of p(H2O) on each physico-geometrical reaction step through logically designed kinetic analyses for the systematically recorded kinetic data under controlled p(H2O) values.
2. Experimental
2.1 Sample CharacteristicsReagent grade Ca(OH)2 (special grade, 499.9% in metal base, Wako Pure Chem. Ind.) was used without any further purification or pulverization. In our previous study,11 which was focused on the kinetic modeling for the thermal decomposition of Ca(OH)2 in an inert gas atmosphere and thermally induced carbonation of Ca(OH)2 in a CO2 atmosphere, the sample was characterized using powder X-ray diffraction (XRD), Fourier-transform infrared (FTIR) spectroscopy, and simultaneous thermogravimetry and differential thermal analysis (TG–DTA). The sample exhibited partial carbonation, in which a mixed phase of Ca(OH)2 and CaCO3 was formed, and the purity of Ca(OH)2 was determined to be 94.30 mass% from the mass-loss values during the thermal decomposition of Ca(OH)2 and CaCO3. The morphological characteristics of the sample powders were also examined using a scanning electron microscopy (SEM). The specific surface area of the sample was determined using the single-point Brunauer–Emmett–Teller (BET) method. It was revealed that the sample was the agglomerate of
submicron-sized particles, and the specific surface area was 3.41±0.03 m2 g-1. The same sample was used for this study, and all measurements were performed during the same period alongside the aforementioned kinetic studies for the thermal decomposition of Ca(OH)2 in an inert atmosphere and the thermally induced carbonation of Ca(OH)2 in a CO2 atmosphere.
2.2 TG measurements under various water vapor pressures
Approximately 3.00±0.05 mg of the Ca(OH)2 sample was weighed into a platinum pan that was 5 mm in diameter and 2.5 mm deep. The weighed sample was set in a TG–DTA instrument (TG8120; Rigaku) that had been constructed using a horizontal thermobalance with a differential mechanism. Water vapor pressure in the reaction atmosphere was controlled using an instrument (HUM-1, Rigaku) according to the following procedures.76 Hot water in the controlled temperature range of 323–343 K was circulated around the furnace tube of the TG–DTA instrument prior to the measurement run in order to avoid possible water vapor condensation when the atmospheric gas with a higher p(H2O) is later introduced into the furnace tube. The sample was initially heated to a predetermined temperature within the range of 323–343 K at a heating rate (β) of 5 K min-1. During the linear heating phase, dry N2 was introduced at a rate of 400 cm3 min-1 at the forefront of the furnace tube. At the same time, a purge gas consisting of dry N2 was also introduced at the back of the balance system at a rate of 50 cm3 min-1. These gases were discharged from a gas line positioned at the end of the furnace tube, at a spot that was close to the joint of the furnace tube and the balance system. While maintaining the sample within the aforementioned temperature range, the gas introduced at the forefront of the furnace tube was switched to a wet N2 gas with a controlled p(H2O), flowing at a rate of approximately 400 cm3 min-1. After the measurement system was stabilized in a stream of wet N2 gas, mass-change measurements were performed by heating the sample to 873 K at different β values (1 ≤ β ≤ 10 K min-1). Similarly, the sample was heated to different pre-determined temperatures (T) at β = 10 K min-1 and held at these temperatures while the mass-change trace was recorded. In order to obtain the mass-loss traces for the kinetic calculations, three different p(H2O) values were selected at approximately 0.65, 1.85, and 5.65 kPa. The details of the experimental setup involving the instrument calibration and the control of p(H2O) values in the reaction atmosphere are described in Section S1 in the ESI,† together with the examples of the TG measurement procedures performed under controlled p(H2O) conditions (Fig. S1, ESI†).
3. Results and Discussion
3.1 Impact of the water vapor pressure on the thermal decomposition process
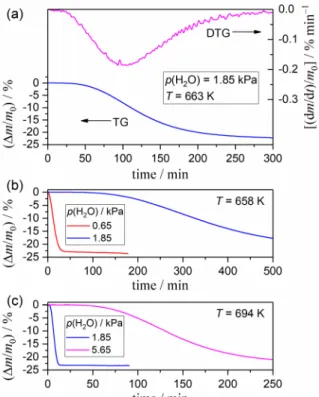
Irrespective of the atmospheric p(H2O) values applied for the thermal decomposition of the sample, two separate mass-loss processes were observed under linearly increasing temperature conditions, as in the dry N2 gas flow conditions reported previously11 (see Fig. S2 in the ESI†). These mass-loss steps originated from the thermal decomposition of Ca(OH)2 and CaCO3.11,77 The first mass-loss step attributed to the thermal decomposition of Ca(OH)2 was subjected to kinetic studies focused on the impact of atmospheric water vapor. Fig. 1 illustrates the characteristics of the thermal decomposition of Ca(OH)2 under isothermal conditions and the impact of atmospheric water vapor on the reaction. In the presence of water vapor, the IP was clearly observed as a certain time period without any mass changes after the sample has reached the pre-determined reaction temperature and before the start of the mass-loss process (Fig. 1(a)). This was not evident in our previous study of the same sample
in a stream of dry N2 gas.11 Once mass loss was initiated, the mass-loss rate gradually increased, reaching its maximum midway through the reaction, followed by gradual deceleration. Generally, the mass-loss process for the thermal decomposition of Ca(OH)2 in a stream of wet N2 gas was characterized by a smooth curve with a sigmoidal shape and was vastly different in shape from that observed in a stream of dry N2 gas.11 In a stream of dry N2 gas, the mass-loss process was characterized by two partially overlapping reaction steps, which were attributed to the thermal decomposition on Ca(OH)2 surfaces that were activated via partial carbonation of the sample and of the main structure of the particles under investigation. The SR appeared as the first kinetic step in a stream of dry N2 gas with the contribution of approximately 0.2 to the overall process was disappeared in a stream of wet N2 gas. This phenomenon indicates a restraining influence of atmospheric water vapor on the SR process and explains the appearance of the IP. Isothermal mass-loss curves recorded at a fixed temperature under different p(H2O) values (Fig. 1(b) and (c)) clearly indicated that the IP and reaction time for the mass-loss process were prolonged under the higher p(H2O) values. Therefore, it is evident that atmospheric water vapor exerts a restraining influence on both the SR and the phase-boundary-controlled reaction (PBR) at the reaction interface that is advancing toward the center of reacting particles of Ca(OH)2.
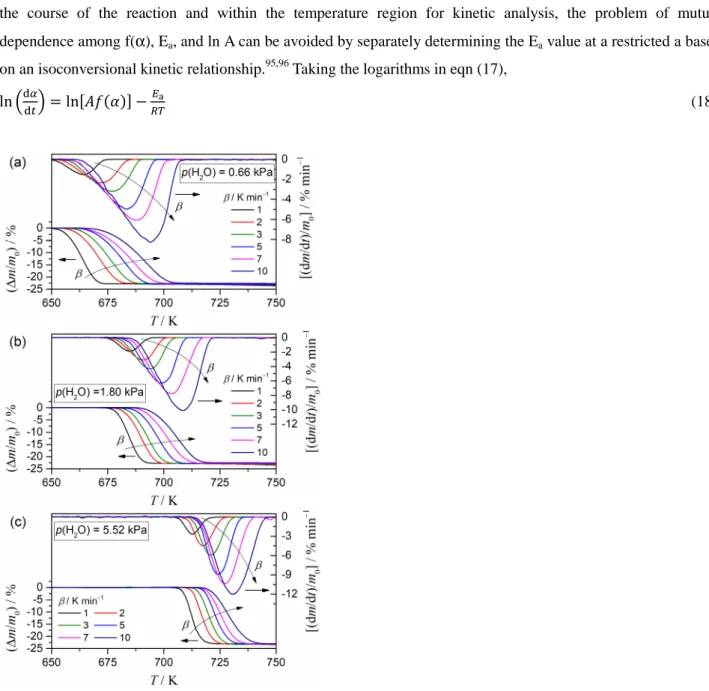
Fig. 2 shows the mass-loss curves of the thermal decomposition of Ca(OH)2 under different p(H2O) conditions, which were achieved by linearly heating the sample at β = 5 K min-1. Nonisothermal mass-loss curves shifted systematically to higher temperatures with increasing p(H2O) (Fig. 2(a)), from which a qualitative relationship between atmospheric p(H2O) and its restraining influence on the overall mass-loss process during thermal decomposition was observed as a normal effect of p(H2O) for a reversible solid–gas reaction system in view of chemical equilibrium. Both the reaction initiation temperature expressed by the extrapolated onset temperature (Teo), which is the temperature at the intersection point of baseline and the tangent line of the initial acceleration period, and the peak top temperature (Tp) of the DTG curve shifted to higher temperatures with increasing p(H2O) (Fig. 2(b)). However, the difference between Teo and Tp decreased with increasing p(H2O), which was accompanied by a systematic rise in the height of the DTG peak. Systematic changes in the reaction temperature interval and the shape of the DTG peak under nonisothermal conditions at a selected b were indicative of changes in the overall kinetic behavior of the reaction; this could be linked to the effect of p(H2O) and its diverse impact on specific reaction stages, such as SR and the subsequent reaction at the reaction interface.
Figure 1. Mass-loss characteristics for the thermal decomposition of Ca(OH)2 under isothermal conditions under a stream of wet N2 gas (400 cm3 min−1) and the p(H2O)-dependent changes: (a) TG–DTG curves at 663 K under
p(H2O) = 1.85 kPa, (b) TG curves at 658 K under p(H2O) = 0.65 and 1.85 kPa, and (c) TG curves at 694 K under
p(H2O) = 1.85 and 5.65 kPa.
Figure 2. Mass-loss curves of the thermal decomposition of Ca(OH)2 under nonisothermal conditions at β = 5 K min−1 under a stream of wet N2 gas (400 cm3 min−1) and the p(H2O)-dependent changes: (a) TG–DTG curves at various p(H2O) values and (b) changes in the extrapolated onset temperature (Teo), peak top temperature (Tp), and peak height at Tp of the DTG curve depending on p(H2O).
3.2 Kinetics of the induction period
Figure 3 shows the isothermal mass-loss curves for the thermal decomposition of Ca(OH)2 at various temperatures in a stream of wet N2 gas with three different p(H2O) values. Irrespective of the p(H2O) value, it was noted that the IP was systematically prolonged with a reduction in the reaction temperature. A systematic decrease in the reaction rate with a reduction in the reaction temperature was also observed for subsequent mass-loss processes. In order to record the isothermal mass-loss curves for kinetic calculations, the reaction temperature range for the isothermal measurements was forcibly shifted to a higher temperature region with increasing p(H2O) values to compensate for the restraining influence of p(H2O).
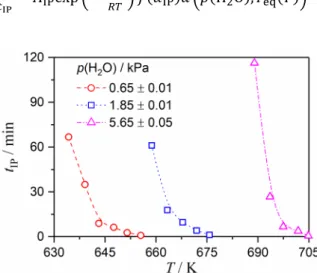
The kinetic data for the IP was extracted from the isothermal mass-loss curves using an empirical procedure that defined the duration time of IP (tIP) as the time interval from the moment when the sample achieved the desired measurement temperature to the time at which the sample indicated a mass-loss value of 0.23%. This value corresponded to the fractional reaction a of 0.01 for the thermal decomposition of Ca(OH)2. Fig. 4 shows the tIP values at various temperatures under three different atmospheric p(H2O) conditions. It was noted that, under each p(H2O) condition, tIP increased exponentially with the reduction in the reaction temperature. Similar changes in the tIP value obtained with relation to temperature were observed for the IP processes under various p(H2O) conditions; however, the temperature regions were clearly separated among the IP processes under various p(H2O) conditions without any indication of continuity in the data points. The kinetics of the IP process were analyzed using the Arrhenius equation by considering the reciprocal value of tIP as the average rate of the chemical process during the IP.65,66,68,69,78–80
0
123= 45exp −
67,23
8/ 45 (7)
where AIP and Ea,IP are the apparent preexponential factor and activation energy for the IP process, respectively. f(αIP) is a kinetic model function that describes the changes in the reaction rate at a constant temperature as a function of the fractional conversion noted during the IP process, αIP. Taking the logarithms of eqn (7), the conventional Arrhenius-type plot of ln(tIP-1) versus T-1 can be applied to the series of data (T, tIP).65,66,68,69,78–80
ln 10
23 = ln; 45 45 < −
67,23
Figure 3. TG–DTG curves for the thermal decomposition of Ca(OH)2 under isothermal conditions at various temperature settings under a stream of wet N2 gas (400 cm
3
min−1) as characterized by different p(H2O) values: (a)
p(H2O) = 0.65 ± 0.01 kPa, (b) p(H2O) = 1.85 ± 0.01 kPa, and (c) p(H2O) = 5.65 ± 0.04 kPa.
Application of the Arrhenius-type plot based on eqn (8) is justified when zero-order kinetics with f (αIP) = 1 is assumed for the IP process78 or when the value of a IP with the average conversion rate (tIP-1) is assumed to be invariant for IP processes at the various temperatures being fulfilled by an isoconversional relationship.65,66,68,69,80 In Fig. S3 (ESI†), conventional Arrhenius plots that were applied to the IP process are shown for the thermal decomposition of Ca(OH)2 in a stream of wet N2 gas as characterized by different p(H2O) conditions. The IP processes under the different p(H2O) values were described by individual Arrhenius plots, while each plot exhibits statistically significant straight line (γ2 > 0.98) (Fig. S3(a), ESI†). The slope of the plots tended to vary depending on p(H2O), which was indicative of a systematic rise in the slope with increasing p(H2O) values; thus, the increases in apparent Ea,IP and ln AIP values were noted. The apparent kinetic parameters determined using the conventional Arrhenius plots are summarized in Table S1 in the ESI.†
The basic kinetic equation of eqn (7) does not consider the impact of p(H2O) on the kinetic behavior of the IP. Thus, kinetic descriptions for the IP processes under different p(H2O) conditions by the individual Arrhenius plots are inevitable and results in a distorted set of apparent kinetic parameters. Introducing an accommodation function a(p(H2O), Peq(T)), composed of p(H2O) and Peq(T) for the reversible reaction of eqn (6), into eqn (7) is one possible way of obtaining the kinetic description considering the p(H2O) as one of the parameters controlling the
kinetic behavior of the IP process.
0
123= 45exp −
67,23
8/ 45 H>O , (9)
Figure 4. Duration of the IP, tIP, for the thermal decomposition of Ca(OH)2 at various temperature settings under different p(H2O) values.
Introducing an accommodation function in the form of eqn (5) is a possible primary approach.1-3, 7
H>O , = 1 −) @,-.A/B
(10)
Practically speaking, the accommodation function corrects the apparent overall reaction rate by simply assuming the linear relationship between the restraining influence of p(H2O) and the relative magnitude of p(H2O) with reference to Peq(T). By introducing the accommodation function, the Arrhenius plot for the IP process is modified as the plot of ln[tIP-1·a(p(H2O),Peq(T))-1] versus T-1.
ln C1 0
23∙E ) @AB ,,-. / F = ln; 45 45 < −
67,23
8/ (11)
Using a modified Arrhenius plot based on eqn (11) with the accommodation function of eqn (10) cannot universally describe the influence of p(H2O) representing individual Arrhenius plots for the IP processes under different p(H2O) values (Fig. S3(b), ESI†). Similar results of the application of the modified Arrhenius plot were reported for the thermal decomposition of CaCO3 under various partial pressures of CO2.7 For the modified Arrhenius plot for each IP process under specific p(H2O) conditions, it was noted that the slope of each plot
decreased slightly from the corresponding original Arrhenius plot (Fig. S3(a), ESI†); however, there was a general
trend toward a rising slope with p(H2O), which did not deviate from the results observed for conventional Arrhenius plots. The apparent values of (Ea,IP, ln[AIP f(αIP)]) determined by the modified Arrhenius plots for each process under different p(H2O) conditions are also summarized in Table S1 in the ESI.†
Changes in Peq for the reversible reaction of eqn (6) with temperature variations, as calculated using a thermodynamic database (MALT2, Kagaku Gijutsu-Sha),81,82 are shown in Fig. S4 (ESI†), along with (T, p(H2O)) values applied to mass-loss measurements that were carried out under isothermal conditions. For the data points recorded under specific p(H2O) conditions, the value of a(p(H2O), Peq(T)), as determined using eqn (10), tended to vary because of the temperature-dependent variations of Peq. Changes in the slope of the modified Arrhenius plot
under specific p(H2O) conditions (Fig. S3(b), ESI†) compared to the observations made from the conventional Arrhenius plot (Fig. S3(a), ESI†) appeared to be due to corrections in the overall rate, which have been determined according to the accommodation function in eqn (10). However, the modified Arrhenius plots under various p(H2O) conditions indicated that there were different linear correlations with different slopes (Fig. S3(b), ESI†), as in the case of the original Arrhenius plots (Fig. S3(a), ESI†). The results indicate that the IP processes taking place within vastly different temperature ranges due to the effect of p(H2O) cannot be universally described by applying the conventional accommodation function in eqn (10). If we adhere to the fundamental assumption, which is a single-step reaction characterized by a constant Ea value for the processes under different p(H2O) conditions, it becomes clear that an alternative accommodation function that can be used as a universal kinetic description is sorely needed. As it relates to finding alternative forms of the accommodation function, possible frameworks were sought by considering the elementary steps of the IP process. The IP process for reactions in the solid state is empirically defined as the time required for activating the reaction at a constant temperature. In the case of thermal decomposition of solids, which produces both solids and gases as products, the reaction is usually initiated on the reactant surfaces. Therefore, the physico-chemical processes of nucleation on the surfaces of the reactant solid should be considered when looking at the kinetics of the IP process.63–69
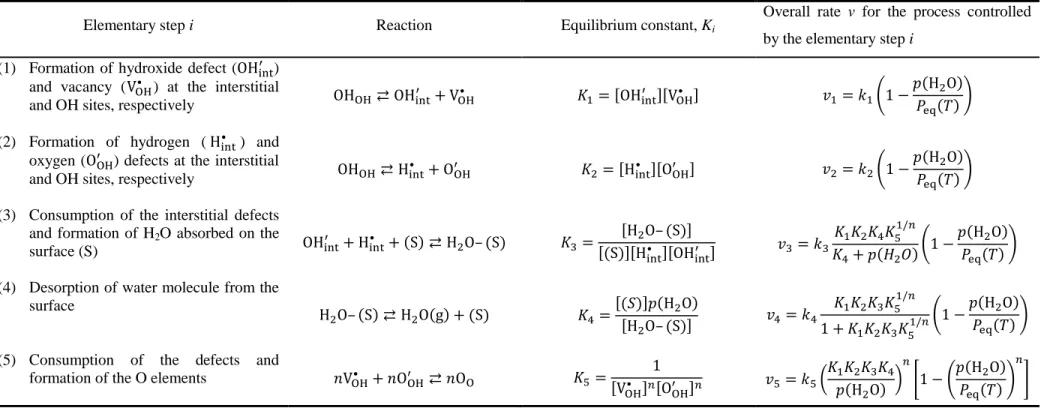
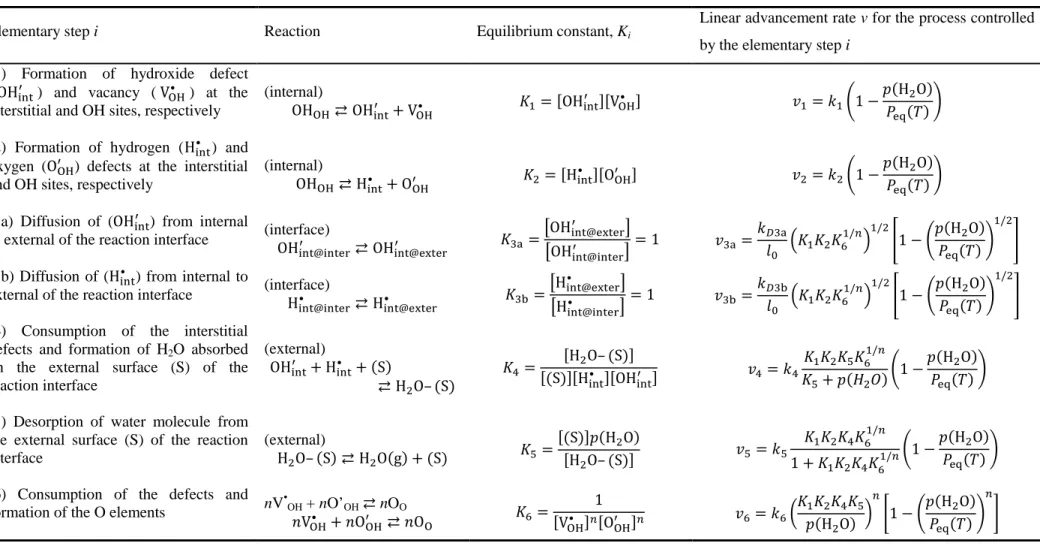
According to the classical nucleation theory,12–16,43,45 various heterogeneous processes may take part in the nucleation process on the surfaces of reactant crystals as elementary steps. For the sake of simplicity, one rate-limiting step was selected from these elementary steps, and the other steps were assumed to be at equilibrium by applying rate-limiting step approximation. For example, using Kröger’s notation,83 five successive steps, as listed in Table 1, could be considered as elementary steps that took part in surface nucleation processes for the thermal decomposition of divalent metal hydroxides to form a divalent metal oxide and water vapor.
M(OH)2(s) ⇄ MO(s) + H2O(g) (12)
The equilibrium constant (Ki) for the elementary step i is expressed as listed in the third column of Table 1, whereas the fourth column shows kinetic equations for the overall formation rate (vi) of the nuclei at a constant temperature, as expressed using the rate constant (ki) of the rate-limiting step i. All kinetic equations contain the p(H2O) component. Peq(T) is also included in all kinetic equations because the overall equilibrium constant (K) for the reversible reaction in eqn (6) is expressed by the product of Ki for all elementary steps i and is equivalent to the equilibrium pressure Peq(T).
G = G0G>GHGIGJ0/L= exp −∆M
°
8/ = (13)
At a constant temperature, each Ki has a certain value. Therefore, the transformation rate vIP of the overall IP
process which is controlled by process i = 1, 2, or 4 can be reduced to the following equation:
N45 = '45O 1 −) @,-.A/B (14)
Similarly, for the overall process controlled by the process i = 5, the rate equation is expressed as
N45 = '45OO ) @0ABPQ1 − ) @,-.A/B
L
R T ≥ 1 (15)
where kIP’ and kIP’’ are the overall rate constants. In eqn (13)–(15), the unit of all pressure terms is in atm. The rate equation for the overall process controlled by the elementary step i = 3 is reduced to eqn (14) and (15) with n = 1, when K4 is much larger and smaller than p(H2O), respectively. Reduction of the rate equation for the overall
process, which is controlled by the elementary step i = 4, to eqn (14) requires the assumption that the value of K1K2K3K51/n is much larger or smaller than unity. The overall rate expressed by eqn (14) is influenced by the relative value of p(H2O) with reference to Peq(T) in the form of the conventional accommodation function in eqn (10). An alternative form of the accommodation function may be derived from the rate equation in eqn (15), in which the overall rate depends on the product of two p(H2O) components, which are composed of the reciprocal of the nth powered p(H2O) and the nth powered relative value of p(H2O) with reference to Peq(T), respectively. Based on eqn (14) and (15), a generalized form of the accommodation function was proposed, which would universally describe the kinetic behavior of IP processes under different p(H2O) conditions.
H>O , =) @0ABVC1 − ) @,-.A/B
W
F (16)
where a and b are constants. P0 is the standard pressure, which is introduced to express all pressure terms in the unit of Pa.
Table 1. Elementary steps that take part in the nucleation processes in the crystal surfaces of metal hydroxides during the IP and the possible kinetic equation for the chemical process of the IP derived by assuming the selected elementary step as the rate-limiting step
Elementary step i Reaction Equilibrium constant, Ki
Overall rate v for the process controlled by the elementary step i
(1) Formation of hydroxide defect (OHXYZO ) and vacancy (VB@• ) at the interstitial
and OH sites, respectively OHB@⇄ OHXYZ
O + V
B@• G0= ;OHXYZO <;VB@• < N0= '0!1 − H>O & (2) Formation of hydrogen (HXYZ• ) and
oxygen (OB@O ) defects at the interstitial
and OH sites, respectively OHB@⇄ HXYZ• + OB@O G>= ;HXYZ• <;OB@O < N>= '>!1 −
H>O & (3) Consumption of the interstitial defects
and formation of H2O absorbed on the
surface (S) OHXYZO + HXYZ• + S ⇄ H>O– S GH=
;H>O– S <
; S <;HXYZ• <;OHXYZO < NH= 'H
G0G>GIGJ0/L
GI+ `>a !1 −
H>O & (4) Desorption of water molecule from the
surface H>O– S ⇄ H>O g + S GI=; b < H;H >O >O– S < NI= 'I G0G>GHGJ0/L 1 + G0G>GHGJ0/L!1 − H>O & (5) Consumption of the defects and
formation of the O elements TVB@• + TOB@O ⇄ TOB GJ= 1
;VB@• <L;OB@O <L NJ= 'J
G0G>GHGI
H>O L
Having (a, b) = (0, 1), the accommodation function is comparable to the conventional accommodation function in eqn (10). The dependence of the overall rate on p(H2O), as expressed by eqn (11), can be modified by applying eqn (16) with a = b = n (n ≥ 1, integer). For a more empirical approach, the values of a and b can be determined numerically through kinetic calculations based on eqn (11) with the accommodation function in eqn (16) to obtain the most appropriate kinetic expression for IP processes under various p(H2O) conditions. Such an approach may lead to empirical (a, b) values in which it is difficult to interpret the physico-chemical significance of the results. Even so, the empirical (a, b) values that were determined through the aforementioned kinetic calculations were useful for evaluating the relevance of the newly introduced accommodation function and for revealing the role of each p(H2O) component in eqn (16) in relation to its influence on the kinetic description for the reaction under investigation.
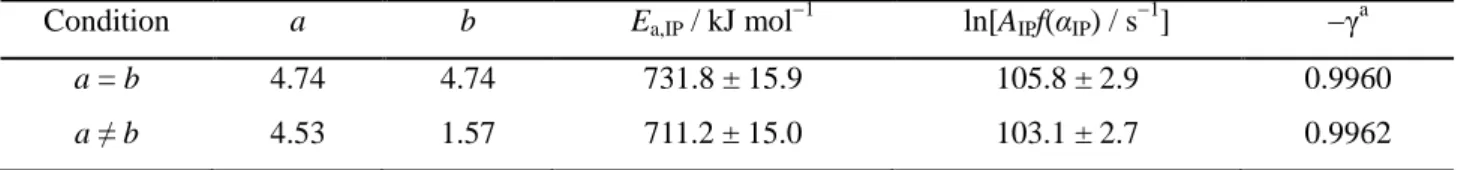
All the data of the IP process recorded at different temperatures under various p(H2O) conditions were universally analyzed using the modified Arrhenius plot based on eqn (11) with the accommodation function in eqn (16). During the kinetic calculations, the (a, b) values in the accommodation function of eqn (16) were optimized in accordance with the Levenberg–Marquardt algorithm to give the best linearity of the modified Arrhenius plot by conducting a linear regression analysis. Fig. 5 shows the results of the said modified Arrhenius plot in two cases: one with the restriction of a = b and the other without it. Irrespective of the restriction of (a, b) values, all data points of the IP processes could be universally described by a single Arrhenius plot that exhibits statistically significant linearity (γ2 > 0.99). Under the restriction of a = b, exponents in the accommodation function of eqn (16) were determined to be a = b = 4.74. When the restriction was removed, thus allowing the different values of a and b, the linearly of the modified Arrhenius plot improved slightly without any practical change in the slope, and the values of a and b values were determined to be (a, b) = (4.53, 1.57). The a value was not significantly influenced by restrictions of a = b, whereas the b value decreased dramatically and approached unity. The second p(H2O) component in eqn (16), expressed by (1 - (p(H2O)/Peq(T))b), was equivalent to the conventional accommodation function of eqn (10), when b was equal to unity. As previously mentioned, introducing the conventional accommodation function of eqn (10) did not significantly improve the kinetic description of the IP process under different p(H2O) conditions; it only resulted in the slight changes in the slope of the Arrhenius plot for IP processes under specific p(H2O) conditions. Therefore, it was empirically understood that the first p(H2O) component in eqn (16), as expressed by (P0/p(H2O))a, played a predominant role in accommodating the influence of p(H2O) on the IP process in the equation needed to determine the universal kinetic description of the process under various p(H2O) conditions. Superficially, the (P0/p(H2O))a component corresponds to the expression for the contribution of a negative catalyst in the homogeneous-like kinetic equation. Table 2 summarizes the kinetic parameters that were determined using a modified Arrhenius plot that was based on eqn (11) with the accommodation function of eqn (16).
Figure 5. Modified Arrhenius plots with the accommodation function of eqn (16) applied to the IP of the thermal
decomposition of Ca(OH)2 at different temperatures under various p(H2O) values.
Table 2. Apparent kinetic parameters for the IP process, as determined according to the modified Arrhenius plot
based on eqn (11) with the accommodation function of eqn (16)
Condition a b Ea,IP / kJ mol−1 ln[AIPf(αIP) / s−1] −γa
a = b 4.74 4.74 731.8 ± 15.9 105.8 ± 2.9 0.9960
a ≠ b 4.53 1.57 711.2 ± 15.0 103.1 ± 2.7 0.9962 a
Correlation coefficient of the linear regression analysis.
3.3 Kinetics of the mass-loss process
Fig. 6 shows the mass-loss curves obtained for the thermal decomposition of Ca(OH)2 at different β values under various p(H2O) conditions. For each of the selected p(H2O) values, the mass-loss curves shifted systematically to a higher temperature range with β, as was generally observed for kinetic processes. The systematic shift in the mass-loss curves to higher temperatures with increasing p(H2O), which was demonstrated previously in Fig. 2, was observed as a general trend irrespective of the selected β value. Kinetic analysis of the mass-loss process during the thermal decomposition of Ca(OH)2 was performed using mass-loss curves recorded under isothermal (Fig. 3) and linear nonisothermal (Fig. 6) conditions. The fundamental kinetic equation in differential form, which assumed a(p(H2O),Peq(T)) = 1 or constant in the expression of eqn (2), was employed for the preliminary kinetic approach.
de
d1 = exp − 67
8/ (17)
where A and Ea are the apparent preexponential factor and activation energy for the mass-loss process, respectively. The fractional reaction (α) was defined as the relative mass-loss value at time t with reference to the overall mass-loss value. The kinetic model function f(α) describes a-dependent changes in the overall reaction rate. For the mass-loss process in the thermal decomposition of solids, the functional form of f(α) was theoretically derived by considering the probability of the reaction initiation via surface nucleation, the geometry of the reaction interface advancement, and the rate-limiting step of this interface advancement, that is, chemical reaction or diffusion-controlled reaction.16,52,58,84 In addition to obtaining an ideal f(α) based on the physico-geometry of the reaction, empirical functions f(α) have also been applied in order to accommodate the actual rate behavior of
the reaction,85 for example, the Sestak–Berggren model SB(m,n,p): f(α) = αm(1-α)n[-ln(1-α)]p.50,86,87 The perfect fit of the experimentally resolved kinetic curves that were determined using the empirical f(α) serves as a way to avoid any undesired distortions of the Arrhenius parameters that originated from an inappropriate f(α),88–90 because the distortions usually result in an empirical linear correlation between Ea and ln A known as the kinetic compensation effect.91–94
When the reaction is well defined as the single-step reaction and the mechanistic feature does not change during the course of the reaction and within the temperature region for kinetic analysis, the problem of mutual dependence among f(α), Ea, and ln A can be avoided by separately determining the Ea value at a restricted a based on an isoconversional kinetic relationship.95,96 Taking the logarithms in eqn (17),
ln ded1 = ln; < −67
8/ (18)
Figure 6. TG–DTG curves for the thermal decomposition of Ca(OH)2 under linear nonisothermal conditions at different β values in a stream of wet N2 gas (400 cm3 min−1) characterized by different p(H2O) conditions: (a)
p(H2O) = 0.66 ± 0.01 kPa, (b) p(H2O) = 1.80 ± 0.02 kPa, and (c) p(H2O) = 5.52 ± 0.07 kPa.
Among the data points (T, dα/dt) at a selected a, the plot of ln(dα/dt) versus T-1 represents a linear correlation in which the Ea value at particular a is calculated from the slope of the linear plot. The differential isoconversional method based on eqn (18) is known as the Friedman plot97 and is applicable to the kinetic data recorded under any
temperature profiles.98–101 Fig. S5 in the ESI† shows the results of the isoconversional analysis that was applied to the mass-loss process for the thermal decomposition of Ca(OH)2 under isothermal and linear nonisothermal conditions at various p(H2O) values. In each p(H2O) value, the Friedman plot at a constant a exhibited a linear correlation, including the data points recorded under isothermal and linear nonisothermal conditions (Fig. S5(a), ESI†). However, Friedman plots for the mass-loss processes under various p(H2O) values appeared at quite different positions in the ln(dα/dt) versus T-1 coordinate with different slopes. The slope of the Friedman plot at each a systematically increased with a rise in the p(H2O) values, and thus, a larger apparent Ea value for the reaction under a higher p(H2O) value was obtained. However, trends in the variations of the Ea value as the reaction progressed were comparable among the reactions under various p(H2O) values (Fig. S5(b), ESI†), thereby representing systematic decreases in the initial part of the reaction (approximately α ≤ 0.3) followed by a nearly constant Ea value during the main part of the reaction (approximately 0.3 ≤ α ≤ 0.9) and a subsequent rise at the end of the reaction (approximately α ≥ 0.9).
The results of the conventional Friedman plot clearly indicated that an accommodation function a(p(H2O), Peq(T)) should be introduced into the kinetic equation in the form of eqn (2) for describing the influence of p(H2O) on the reaction rate of the mass-loss process for the thermal decomposition of Ca(OH)2, as was the case for the IP process.
de
d1 = exp − 67
8/ H>O , (19)
It was also expected that the introduction of an appropriate accommodation function greatly improve the kinetic description for the reactions under different p(H2O) conditions, because similar trends in the variation of the Ea value as the reaction progressed were noted in Fig. S5(b) (ESI†) among the reactions under different p(H2O) conditions. By introducing the accommodation function, a(p(H2O), Peq(T)), the modified form of the Friedman plot is expressed by
ln C ded1 ∙E ) @ 0
AB ,,-. / F = ln; < −
67
8/ (20)
However, introducing the conventional accommodation function of eqn (10) did not significantly improve the results of the conventional Friedman plot as shown in Fig. S6 in the ESI.† The modified Friedman plot represented individual linear correlations with different slopes and intercepts in ln[(dα/dt)/(1- p(H2O)/Peq(T))] versus T-1 coordinate for the mass-loss processes under each p(H2O) value (Fig. S6(a), ESI†). The apparent Ea values calculated from the modified Friedman plots decreased slightly in comparison to those determined using conventional Friedman plots, where a more impactful effect of the accommodation function was observed for mass-loss processes recorded at higher p(H2O) values. However, introducing the accommodation function of eqn (10) did not achieve a universal kinetic description for the mass-loss processes under different p(H2O) conditions and did not affect the trends in the variation of the apparent Ea values as the reaction progressed (Fig. S6(b), ESI†). Therefore, possible alternative forms of the accommodation function of a(p(H2O), Peq(T)) are again required for the mass-loss processes of the thermal decomposition of Ca(OH)2.
The overall mass-loss process of the thermal decomposition of solids can be interpreted as a physico-geometrical consecutive process of the SR and PBR, which are characterized by nucleation and growth of the solid product on the surface and subsequent movement of the as-produced reaction interface inward the reacting particle, respectively.12–16,43,45 PBR is accompanied by the diffusional removal of the gaseous product via the surface
product layer. Thus, the influence of p(H2O) on the interfacial processes of the PBR was further considered for the overall mass-loss process in addition to nucleation processes as illustrated for the IP process. Similar to nucleation during the IP process, PBR during the mass-loss process can also be described by successive elementary steps that occur at the reaction interface with an appreciable thickness. In addition to the formation/consumption of defects and the adsorption/desorption of gaseous products as assumed for surface nucleation, diffusion of the as-generated defect across the phase boundary (reaction interface) should be considered in the interfacial processes. Successive elementary steps as listed in Table 3 may describe the overall process of PBR. The rate equations listed in the fourth column of Table 3 are obtained when one of the elementary steps is assumed to be the rate-limiting step and the other elementary steps are set at equilibrium. These can be reduced to two types of rate expressions in relation to the dependence of the overall rate of PBR (υPBR) on p(H2O).
N5fg= '5fgO Q1 − ) @,-.A/B L R T =0> hi 1 (21) N5fg= '5fgOO ) @0ABPQ1 − ) @AB ,-. / L R T =0> hi ≥ 1 (22)
where the unit of all pressure terms in eqn (21) and (22) is in atm. Eqn (21) is derived when the elementary step of i = 1, 2, 3a, or 3b is assumed as the rate-limiting step, which is equivalent to eqn (14) when n = 1 and can have n = 1/2 when the reaction rate is controlled by diffusion of the as-formed defects via the reaction interface. Eqn (21) is also derived from the rate equations for steps i = 4 and 5 when p(H2O) is much smaller than K5 and K1K2K4K61/n is much smaller or larger than unity, respectively. Eqn (22), which is expressed by the product of two p(H2O) components with exponent n in each component, is derived from the rate equation of i = 5 if K 5 is much smaller than p(H2O) and from i = 6. The frameworks for eqn (21) and (22) are comparable with eqn (14) and (15) derived for the IP process, respectively.
Subsequently, it was found that H2O(g) produced at the reaction interface diffused to the surface of the reacting particle through the surface product layer and was discharged into the reaction atmosphere via the desorption from the outer surface of the product layer. For processes controlled by the diffusion of gaseous product through the surface product layer, an accommodation function comparable to that mentioned in eqn (5) had already been derived by Searcy and Beruto.44
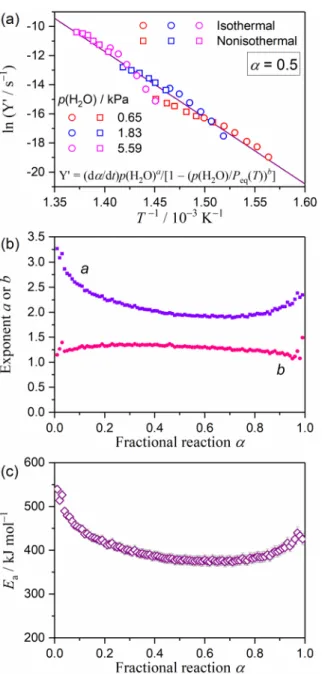
Therefore, all possible rate expressions concerning the effect of p(H2O) were related to the analytical form of the accommodation function described in eqn (16). Fig. 7 shows the results of the kinetic analysis using the modified Friedman plot with the accommodation function of eqn (16). Application of eqn (20) combined with eqn (16) provided the universal linear correlation of the Friedman plot for mass-loss processes under various p(H2O) conditions (Fig. 7(a)), when the appropriate values of a and b were evaluated for each Friedman plot at different α by allowing the different values for a and b. Variations of the optimized exponents (a, b) in the accommodation function of eqn (16) as the reaction progresses (Fig. 7(b)) tell us that there are the changes in the impact of p(H2O) during the course of the reaction. The exponent b was nearly constant within the range of a (0.04 ≤ α ≤ 0.97), with the average value of 1.28 ± 0.07. Constancy in the exponent b, which was close to unity, indicated that the second p(H2O) component in the accommodation function of eqn (16) did not significantly contribute to the universal kinetic description of the mass-loss process at the selected a value under various p(H2O) conditions and that the contribution did not change over the course of the reaction. Thus, the exponent a for the first p(H2O) component, (P0/p(H2O))a, was again responsible for the universal kinetic description for the isoconversional relationship of the
mass-loss processes. However, the exponent a changed systematically as the reaction advanced, exhibiting an initial decrease from approximately 3.2 to 2.0 in the first half of the process (approximately 0.01 ≤ α ≤ 0.50), a nearly constant value of approximately 2.0 in the second half of the process (approximately 0.50 ≤ α ≤ 0.85), and a gradual increase from approximately 2.0 to 2.5 at the end (approximately 0.85 ≤ α ≤ 0.99). Variations in the a value were indicative of the changing impact of p(H2O) over the course of the reaction, which was accompanied by the variations in the contribution of the diffusional removal process of the as-produced water vapor. It was noted that the change in the a value was synchronized with the variation of the apparent Ea value over the course of the reaction (Fig. 7(c)). Therefore, the kinetic approach that was developed on the basis of the modified Friedman plot with the accommodation function of eqn (16) revealed that there were changes in the physico-geometrical reaction mechanism and the impact of p(H2O) over the course of the reaction. Phenomenologically, the existence of the IP and the isothermal mass-loss process characterized by the sigmoidal mass-loss curve were positive evidence of physico-geometrical consecutive processes comprising the IP, SR, and PBR steps. The initial decrease in the Ea value during the first half of the reaction and the constant Ea value noted during the second half, as revealed through the isoconversional kinetic approach, have also been observed for this type of reaction.65,66,68,69 It is expected that a rigorous kinetic solution for the physico-geometrical consecutive process provides further insights into the impact of p(H2O) on each component reaction step.
Table 3. Physico-chemical processes that participate in the phase boundary reaction during the thermal decomposition of metal hydroxides and the kinetic equation for the overall reaction controlled by the selected elementary step
Elementary step i Reaction Equilibrium constant, Ki
Linear advancement rate v for the process controlled by the elementary step i
(1) Formation of hydroxide defect (OHXYZO ) and vacancy (VB@• ) at the interstitial and OH sites, respectively
(internal)
OHB@⇄ OHXYZO + VB@• G0= ;OHXYZ O <;V
B@• < N0= '0!1 − H>O & (2) Formation of hydrogen (HXYZ• ) and
oxygen (OB@O ) defects at the interstitial and OH sites, respectively
(internal) OHB@⇄ HXYZ• + OB@O G>= ;HXYZ • <;O B@ O < N >= '>!1 − H>O & (3a) Diffusion of (OHXYZO ) from internal
to external of the reaction interface (interface) OH
XYZ@XYZ #O ⇄ OHXYZ@ kZ #O GH = lOHXYZ@ kZ #O m lOHXYZ@XYZ #O m= 1 NH = 'nH op G0G>Gq 0/L 0/>r1 − ! H>O &0/>s (3b) Diffusion of (HXYZ• ) from internal to
external of the reaction interface (interface) H XYZ@XYZ # • ⇄ H XYZ@ kZ #• GHt= lHXYZ@ kZ #• m lHXYZ@XYZ #• m= 1 NHt = 'nHt op G0G>Gq 0/L 0/>r1 − ! H>O &0/>s (4) Consumption of the interstitial
defects and formation of H2O absorbed
on the external surface (S) of the reaction interface
(external)
OHXYZO + HXYZ• + S
⇄ H>O– S
GI=; S <;H;H>O– S <
XYZ• <;OHXYZO < NI= 'I
G0G>GJGq0/L
GJ+ `>a !1 −
H>O & (5) Desorption of water molecule from
the external surface (S) of the reaction interface (external) H>O– S ⇄ H>O g + S GJ= ; S < H>O ;H>O– S < NJ= 'J G0G>GIGq0/L 1 + G0G>GIGq0/L !1 − H>O &
(6) Consumption of the defects and
formation of the O elements nV
• OH + nO’OH⇄ nOO TVB@• + TOB@O ⇄ TOB Gq= 1 ;VB@• <L;OB@O <L Nq= 'q G0G>GIGJ H>O L C1 − ! H>O &LF
Figure 7. Results of the modified Friedman plots with the accommodation function of eqn (16) as applied to the
mass-loss process of the thermal decomposition of Ca(OH)2 under isothermal and linear nonisothermal conditions at different p(H2O) values: (a) modified Friedman plot with (a, b) = (1.95, 1.31) at α = 0.5, (b) a and b values at different α values, and (c) Ea values at different α values.
3.4 Kinetic modeling of the consecutive IP-SR-PBR under various water vapor pressures
Kinetic modeling of the consecutive physico-geometrical processes for the surface nucleation and the subsequent reaction interface shrinkage was first proposed by Mampel for solid-state reactions under isothermal conditions.102 Practical kinetic analysis based on the integral form of Mampel’s model has been studied by several researchers in order to gain further insights into the real kinetic feature of various solid-state reactions.103–106 Favergeon et al. discussed in detail the constitutional equations for this type of physico-geometrical consecutive process within the context of nucleation and isotropic or anisotropic growth models.107 Several examples of the physico-geometrical consecutive process were analyzed kinetically using the principles from the nucleation and anisotropic growth
models.108–111 The integral kinetic behavior, which was characterized by a sigmoidal mass-loss curve under isothermal conditions, is superficially similar to those obtained for the reactions comprising the bulk nucleation and growth of nuclei, as formalized by the Johnson–Mehl–Avrami (JMA) model,112–115 and the homogeneous-like autocatalytic model.50,86,87 For the kinetic analysis conducted under isothermal conditions, reactions regulated by JMA and autocatalytic models could be treated as the pseudo-single-step reaction described by one rate constant; on the other hand, in reactions regulated by Mampel’s model, two rate constants for SR and PBR should be evaluated from a single kinetic curve at a constant temperature. Because of the difficulty of conducting kinetic calculations for the experimental kinetic curves that were obtained under isothermal conditions based on Mampel’s model, in many cases, the SR–PBR processes were analyzed using the JMA or auto-catalytic models with an acknowledgment as the empirical approach, regardless of the vastly different physico-geometrical features assumed while formalizing the respective kinetic models. However, difficulties in performing kinetic calculations based on Mampel’s model have been largely alleviated by the increased quality of the kinetic data recorded through the use of the modern thermoanalytical instruments and advancements in software technology. For practical kinetic calculations based on Mampel’s model, Ogasawara and Koga recently formalized the differential kinetic equations for physico-geometrical consecutive processes comprising IP–SR–PBR(n), which occur under isothermal conditions: this was done by assuming a zero-order rate process for IP, a first-order rate process for SR, and a PBR with different geometrical dimensions (n).68 The differential kinetic equations obtained for the consecutive IP–SR–PBR(n) process under isothermal conditions are listed in Table S2 in the ESI.† Application of the kinetic calculation generates the chance to separately discuss the impact of p(H2O) on each component step of the physico-geometrical reaction, as well as gain further insights into the mechanistic feature of the reaction. The isothermal kinetic data recorded at numerous temperature settings under different p(H2O) conditions (Fig. 3) were used to conduct kinetic analysis based on the IP–SR–PBR(n) model. The rate constants, kIP (= 1/tIP), kSR , and kPBR(n) for IP, SR, and PBR with the interface shrinkage dimension of n, respectively, were simultaneously optimized so as to minimize the square sum F of the residue when fitting the experimental (dα/dt)exp versus t by the calculated (da/dt)cal versus t based on the equations listed in Table S2 (ESI†) through nonlinear least-squares analysis according to the Levenberg–Marquardt algorithm.
u = ∑ Q ded1 kw,x− de d1 y z,xR > { x|0 (23)
where N is the number of data points in each kinetic curve. For each optimization run, the initial value for kIP was determined using the apparent Arrhenius parameters obtained via the conventional Arrhenius plot for IP processes under each p(H2O) condition (Table S1 in the ESI†). For kPBR(n), the initial value was derived with reference to the average Ea value that was evaluated using the conventional Friedman plot within the range of 0.5 ≤ α ≤ 0.8 and analyzing an experimental master plot drawn by assuming a constant Ea value within the corresponding a range.95,96,99–101 After setting the initial values of kIP and kPBR(n), the order of the initial kSR value was determined by graphically comparing the experimental and calculated kinetic curves.
Fig. 8 shows typical results of the optimization run as exemplified by the kinetic curve recorded at T = 668 K under p(H2O) = 1.86 kPa; this was indicative of the most satisfactory fit obtainable when two-dimensional shrinkage of the reaction interface (n = 2) was assumed for the PBR step (Fig. 8(b)). Irrespective of p(H2O), the most statistically relevant fit was observed when assuming the IP–SR–PBR(2) model. Therefore, the kIP (= 1/tIP),
kSR, and kPBR(2) values which were determined by positing the IP–SR–PBR(2) model were subjected to further evaluation in order to establish the dependence of those values on T and p(H2O). Table S3 (ESI†) summarizes the optimized rate constants of IP–SR–PBR(2) model for each kinetic curve recorded at different temperatures under various p(H2O) conditions, together with the determination coefficients calculated for the differential and integral kinetic curves.
The temperature dependence of the rate constants for each reaction step was separately analyzed on the basis of the conventional Arrhenius plot.
ln' = ln −67
8/ (24)
where k can be kIP, kSR, or kPBR(2). In Fig. S7 (ESI†), there are conventional Arrhenius plots applied to the kIP (=1/tIP), kSR, and kPBR(2) values determined for the overall process of the thermal decomposition of Ca(OH)2 at different temperatures under various p(H2O) conditions. For each reaction step, that is, IP, SR, and PBR(2), the conventional Arrhenius plot detailed the different linear relationships that existed under different p(H2O) conditions; this was already observed when the conventional Arrhenius and Friedman plots were applied to the IP process (Fig. S3(a) in the ESI†) and to the overall mass-loss process (Fig. S5(a) in the ESI†), respectively. For all reaction steps, the slope of the Arrhenius plot systematically rose with increasing p(H2O). Table S4 (ESI†) lists the apparent Arrhenius parameters that were determined for each reaction step under a particular p(H2O) condition. Thus, introducing an accommodation function, a(p(H2O),Peq(T)), in the Arrhenius plot is a possible means of establishing the universal kinetic description for each physico-geometrical reaction step that occurs at different temperatures and under various p(H2O) conditions.
ln CE ) @ }
AB ,,-. / F = ln −
67
8/ (25)
However, as shown in Fig. S8 (ESI†), introducing the most widely used accommodation function of eqn (10) into eqn (25) did not dramatically improve the individual Arrhenius plots for the processes under different p(H2O) conditions. The apparent Arrhenius parameters that were determined using the modified Arrhenius plot with the accommodation function of eqn (10) are also summarized in Table S4 (ESI†). Although the accommodation function of eqn (10) could not be used to universally describe the rate data obtained under different p(H2O) values, the effect of the correction appeared more extensively for reactions under the higher p(H2O) value, as changes in the slope of the Arrhenius plot, and thus the apparent Ea value.
Figure 8. Typical results of nonlinear least-squares analysis for the appropriate differential and integral kinetic
curves obtained for the thermal decomposition of Ca(OH)2 (T = 668 K, p(H2O) = 1.86 kPa) on the basis of IP– SR–PBR(n) model: (a) n = 1, (b) n = 2, and (c) n = 3.
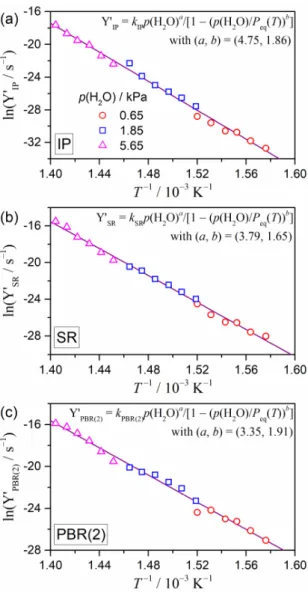
Next, the modified Arrhenius plots with the accommodation function of eqn (16) were examined for each reaction step, as shown in Fig. 9. By optimizing the exponents (a, b) in the accommodation function, it was able to established that all the data points for each reaction step, which originated from the kinetic curves recorded at different temperatures under various p(H2O) conditions, exhibited a single Arrhenius plot with statistically significant linear correlation. Table 4 lists the optimized exponents (a, b) and the apparent Arrhenius parameters for each reaction step evaluated through the modified Arrhenius plot with the accommodation function of eqn (16). The results of the modified Arrhenius plots, when applied separately to the rate constants of each component reaction step, provided us further insights into the physico-geometrical reaction mechanisms of the thermal decomposition of Ca(OH)2 under different p(H2O) values. Relative changes in the impact of p(H2O) as the reaction step progressed could be estimated by comparing the optimized exponents (a, b) in the accommodation function of eqn (16) among those determined for different reaction steps. For the thermal decomposition of Ca(OH)2, it was shown that the exponent a decreased as the reaction step advanced from IP to PBR(2) via SR. Since the first p(H2O) component, (P0/p(H2O))a, in the accommodation function of eqn (16) ((p(H2O)/P0) < 1 in the current experimental setup) corrected the linearity of the Arrhenius plot by making contributions in the logarithmic form, the larger value of a was indicative of the larger dependence of the apparent rate of the reaction
step on p(H2O). Conversely, the b value did not indicate the simple variation trend as the reaction step advanced. It was found to be in the range of 1.5–2.0 for all the reaction steps. A larger b value indicates less significant contribution of the second p(H2O) component, 1 - (p(H2O)/Peq(T))b, in the accommodation function of eqn (16). The second p(H2O) component corrects the overall reaction rate by the relative intensity of p(H2O) with reference to Peq(T), which may play a significant role in the reaction occurring near the equilibrium temperature at a given p(H2O). Analytically, the second p(H2O) component in the accommodation function corrected the slope of the Arrhenius plot within the data points under a selected p(H2O) value.
The largest a value was observed for the IP step. This was expected because the IP step was triggered via exposure to the reaction atmosphere and was not influenced by any self-generated water vapor pressure. Smaller a values observed for the SR and PBR(2) steps were indicative of apparently the rate behaviors that were relatively less sensitive to p(H2O) in comparison to those found in the IP step. However, when interpreting the apparent rate behavior, it must be considered that the actual reaction sites of the SR and PBR(2) steps were not directly exposed to the reaction atmosphere. This situation was more distinguished for the PBR(2) step, since the reaction interface was covered by a surface layer of the solid product. In addition, these reaction steps were accompanied by the evolution of water vapor; therefore, the actual water vapor pressure at the reaction sites positioned within the reacting particles could not be precisely determined. Thus, the impact of atmospheric p(H2O) on the SR and PBR steps was the result of changes in the actual partial pressure of water vapor at the reaction interface, which were induced by changes in the atmospheric p(H2O), even if the evolution rate of water vapor during the reaction under isothermal conditions was much lower than that observed under the nonisothermal conditions. Since there were challenges in directly measuring or precisely calculating the partial pressure of water vapor at the reaction interface, systematic changes in the a value as the reaction step advanced could be used as a semi-quantitative measure that would empirically explain the observed variations in the apparent rate behavior via the effect of atmospheric p(H2O). The relatively constant b values for all reaction steps may have resulted from the same p(H2O)/Peq(T) ratio among the corresponding data points recorded at specific (T, p(H2O)) conditions in all the reaction steps. From the aforementioned results of the modified Arrhenius plots with the accommodation function of eqn (10) (Table S4 and Fig. S8 in the ESI†), it was expected that the second p(H2O) component, 1 - (p(H2O)/Peq(T))b, would make slight corrections to the slope of the individual Arrhenius plot under a specific p(H2O) value. However, the effect of the second component in eqn (16) was smaller than the value that determined in the case of the conventional accommodation function of eqn (10) because the b value was found to be larger than unity. Therefore, the single Arrhenius plot for the rate constants of each reaction step, which had been calculated for the kinetic data recorded under different p(H2O) conditions, was again recognized via the contributions of the first p(H2O) component in eqn (16).
It was observed that the apparent Ea values for each reaction step evaluated from the modified Arrhenius plot with the accommodation function of eqn (16) systematically decreased as the reaction step advanced from IP to PBR(2) via SR. The trend agreed with the aforementioned behavior patterns that were observed via formal kinetic analyses for the IP and the overall mass-loss processes. It was also noted that the preexponential factors that were determined for each reaction step decreased as the reaction step advanced in accompanying with the decrease in the E a values, which followed a generally observed trend known as the kinetic compensation effect.91–94 For the thermal decomposition of the current Ca(OH)2 sample, the results of the kinetic analysis in relation to the impact