HAL Id: hal-03198020
https://hal.archives-ouvertes.fr/hal-03198020
Submitted on 14 Apr 2021
HAL is a multi-disciplinary open access
archive for the deposit and dissemination of sci-entific research documents, whether they are pub-lished or not. The documents may come from teaching and research institutions in France or abroad, or from public or private research centers.
L’archive ouverte pluridisciplinaire HAL, est destinée au dépôt et à la diffusion de documents scientifiques de niveau recherche, publiés ou non, émanant des établissements d’enseignement et de recherche français ou étrangers, des laboratoires publics ou privés.
Automatic Segmentation and Identification of Spinous
Processes on Sagittal X-Rays Based on Random Forest
Classification and Dedicated Contextual Features
Shahin Ebrahimi, Laurent Gajny, Wafa Skalli, Elsa D. Angelini
To cite this version:
Shahin Ebrahimi, Laurent Gajny, Wafa Skalli, Elsa D. Angelini. Automatic Segmentation and Identi-fication of Spinous Processes on Sagittal X-Rays Based on Random Forest ClassiIdenti-fication and Dedicated Contextual Features. 2019 IEEE 16th International Symposium on Biomedical Imaging (ISBI 2019), Apr 2019, Venise, Italy. pp.688 - 691, �10.1109/ISBI.2019.8759490�. �hal-03198020�
AUTOMATIC SEGMENTATION AND IDENTIFICATION OF SPINOUS PROCESSES ON
SAGITTAL X-RAYS BASED ON RANDOM FOREST CLASSIFICATION AND DEDICATED
CONTEXTUAL FEATURES
Shahin Ebrahimi
1, Laurent Gajny
1, Wafa Skalli
1, Elsa D. Angelini
2,31
Arts et Métiers ParisTech, Institut de Biomécanique Humaine Georges Charpak, Paris, France
2Telecom ParisTech, LTCI, Université Paris-Saclay, France
3
ITMAT Data Science Group, NIHR Imperial BRC, Imperial College London, UK.
ABSTRACT
X-ray based quantitative analysis of spine parameters is required in routine diagnosis or treatment planning. Existing tools commonly require manual intervention. Attempts towards automation of the whole procedure have mainly focused on vertebral bodies, whereas other regions such as the posterior arch also bear considerable amount of useful information. In this study, we combine a specific design of contextual visual features with a multi-class Random Forest classifier to perform pixel-wise segmentation and identification of all cervical spine spinous processes, on sagittal radiographs. Segmentations were evaluated on 62 radiographs, comparing to manual tracing. Correct identification was obtained for all subjects, and segmentation returned mean SD values of: Dice coefficient = 88 8%; Hausdorff distance = 2.1 1.4 mm and; mean surface distance = 0.6 0.4 mm. The derived geometric parameters can be used to reduce the amount of manual intervention needed for spine modeling or to measure clinical indices.
Index Terms— Spine X-ray, Spinous process, Multi-class Random Forest, Visual features, Segmentation, Identification
1. INTRODUCTION
Each year, millions of people develop spine-related diseases, and are referred to specialists for treatment. In many circumstances, patients are instructed to get an X-ray for further assessment. X-ray imaging, either standard or biplanar, is commonly used for 2D and 3D spine shape modeling and quantitative spine analysis, since radiation dose is minimal and images are acquired in weight-bearing positions that preserve the spine pose and orientation for further analysis. All current available spine modeling tools require user intervention to determine some landmarks on X-rays [1], [2]. Rich literature exists describing the extraction of landmarks automatically or with minimal user involvement, such as the works in [3]–[6] for vertebrae corners or the works in [7], [8] for pedicle segmentation. However, automation remains very limited for structure localization or landmark detection in the spine posterior arch, while we know that this region is also of interest, especially in spine alignment analysis to detect evidences of injury or disorder [9]. Among the literature focusing on this domain, we can cite the work in
[10], which developed a semi-automated vertebra identification-segmentation method based on generalized Hough transform (GHT) and K-means clustering, from which three landmarks were extracted to approximate the anterior vertebral curve, the posterior vertebral curve and the spinolaminar curve from high resolution sagittal radiographs of the cervical spine (C3-C7). Occlusion and changes in the test database were reported as the main error sources. For the same purpose, [11] proposed a semi-automated method to extract the spinolaminar curve over the entire cervical spine region, having segmented vertebral bodies, and a point manually positioned at the spinolaminar junction. Although sensitivity to the manual point placement was examined, the method also seems vulnerable to the chosen segmentation approach. Likewise, to assess cervical spine disorders, [12] developed an active appearance
model-based [13] framework to model vertebral bodies and spinous processes by extracting few landmarks. However, the proposed method seems sensitive to model initialization, especially for the spinous processes.
In the current study, we aim at segmenting spinous processes of the cervical spine exploiting dedicated contextual features (CF) together with a multi-class Random Forest (RF) classifier. The outputs of the algorithm are spinous processes pixels with assigned labels and scores, determining to which spinous process (C1-C7) the pixels belong to and with what probability. Classification results are then refined. Manually segmented spinous processes are used as the comparison reference for evaluation.
2. MATERIAL AND METHOD
In this study 62 sagittal X-rays, acquired with an EOS low dose system (EOS imaging, Paris, France) are used. They contained 434 spinous processes manually delineated. Images were collected from different research and imaging centers (pixel size = 0.1794 × 0.1794 mm2). Subjects cover a variety of age (range: [8, 59] years,
mean SD = 19 11), sex, and pathology. The experimental protocol has been approved by centers’ ethical committees and written patient consents have been acquired. X-ray images (Fig. 1(a)) are pre-processed with Wiener and median filtering, followed by contrast limited adaptive histogram equalization (CLAHE) as done in [4]
to enhance image quality while preserving boundaries (Fig. 1(b)).
2.1. Contextual Features Extraction
We previously introduced specialized patch-based Haar-like and contextual features for vertebrae corner detection in [4]. These features can capture intensity and gradient information not only locally but also from remote locations. In this study, we present a specific design of patch-based contextual features that acts in a pixel-wise manner enabling simultaneous detection, segmentation, and identification of the objects of interest.
As illustrated in Fig. 1(c), a pool of features is obtained from [3 × 3] patches that are localized around a candidate pixel in different layers with radii 𝑟𝑛 and intra-layer distance 𝑑𝑟𝑛, which are set as follows:
Fig. 1: (a) Original image. (b) Enhanced image. (c) Patches arrangements around every candidate pixel.
𝑟1= 4, 𝑟𝑛= 𝑟1+ ∑ (𝑖 + 1), 𝑛+1 𝑖=3 𝑛 = 2, … ,13 𝑑𝑟𝑛= 𝛼 + 𝛽∑ 𝑖 𝑛−1 𝑖=0 . 𝑛 = 1, … ,13
with 𝛼 = 4.2, 𝛽 = 0.1, and distances in pixels. The features aggregate mean and variance of intensities inside each patch, as well as the mean intensity difference between each patch and the central one, leading to 1,522 feature values for each pixel. Mean, variance and contrast term values are normalized to a unit 𝐿2-norm to increase stability
of the features against intensity variations across the image.
2.2. Multi-class RF Classification
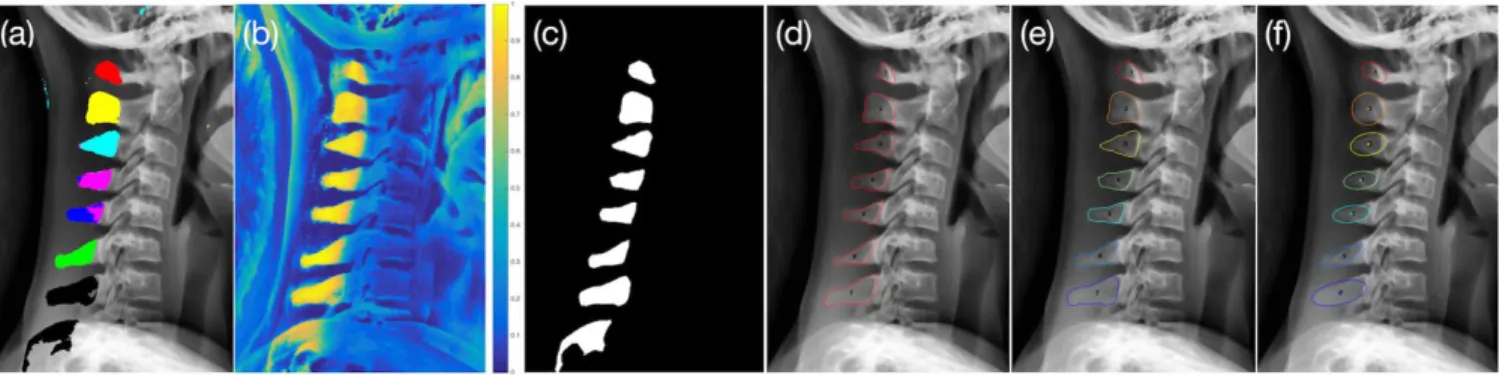
For detection, segmentation and identification tasks, we train and test, in a leave-one-out fashion, a multi-class RF classification with parameters reported in Table 1. In this multi-class RF, we assign one class for each spinous process of cervical vertebrae (C1-C7) and one class for non-spinous process areas. For training, 𝑁 = 100 to 200 (depending on the size of the spinous process) positive samples are randomly gathered from manually delineated spinous processes of 61 subjects, and 𝑁 = 500 negative samples collected from random non-spinous process regions. At testing stage, all image pixels from the test subject are input to the classifier to be examined and assigned a class label. The classification outcome provides detected spinous process pixels, the label of the spinous process they belong to, along with probability values computed as described in [14](Fig. 2(a-b)).
2.3. Refinement
We first build a binary mask of the detections using the binary output of the RF classifier. Then connected components (CCs) smaller than 100 pixels are removed. In order to further refine the obtained CCs, a bounding hull approach [15] is used to build a non-convex enclosure on the set of detected boundary points. As a result, gaps within CCs are filled and boundaries are smoothed (Fig. 2(c)).
Table 1 RF parameters and values
𝑁𝐶 = 8 number of classes
𝑁𝑇𝑟𝑒𝑒 = 500 number of decision trees
𝑁𝑓𝑒𝑎𝑡𝑢𝑟𝑒
= 1,522 number of features
𝑁𝑠𝑓
= √𝑁𝑓𝑒𝑎𝑡𝑢𝑟𝑒
number of selected features at each split node
𝑁𝑜𝑏𝑠 number of observations in the training data
𝑁𝑠
= 𝑁𝑜𝑏𝑠− 1 maximum number of split nodes
𝑁𝑙 = 1 minimum number of leaf node observations
𝑁𝑏 = 10 minimum number of branch node observations
2.4. Identification
Although we have labels for each spinous process, our initial experiments showed that these class labels have variable levels of reliability. We observed that the C2 spinous processes’ labels are highly reliable, given their particular shape and neighborhood. Therefore, in practice we consider C2 as the reference reliable label, while the other spinous processes are relabeled. To this end, first a large probability threshold (𝑇𝑝= 0.85) is applied on the
C2 class labels to filter points with small membership probabilities. The geometrical average over the selected points coordinates (𝑃𝑟𝑒𝑓) provides the approximate location of C2 in the image, which serves as an anchor to locate
other spinous processes. From the refined CCs in Section 2.3 we measure each geometrical CC center and use a dedicated iterative labeling process based on position of CC centers with respect to 𝑃𝑟𝑒𝑓 to assign labels to
remaining CCs (Fig. 2(e)).
2.5. Evaluation Metrics
The following geometrical characteristics are evaluated for the detection of spinous processes (𝑆𝑃𝑠).
(a) Spinous process geometrical center (𝑺𝑷𝑪𝒆𝒏𝒕𝒆𝒓) is the spinous process’s center of mass, and is obtained
via averaging of its pixel coordinates. 𝑆𝑃𝐶𝑒𝑛𝑡𝑒𝑟𝑒𝑟𝑟𝑜𝑟 is the root-mean-square error (RMSE) of the distances
between the ground truth and the algorithm-based geometrical centers positions.
(b) Spinous process principal axis of inertia (𝑺𝑷𝑶𝒓𝒊) is defined via fitting an ellipse [16] to each
segmented spinous process (Fig. 2(f)). The major axis of the ellipse is the axis of inertia. The angle between the axis of inertia and the horizontal image axis determines the spinous processes orientation and is used to measure RMSE orientation differences (𝑆𝑃𝑂𝑟𝑖𝑒𝑟𝑟𝑜𝑟) between automatically and manually segmented
spinous processes.
To evaluate the segmentations, we applied the following three metrics to compare the algorithm-based segmentation (Fig. 2(e)) and the ground truth (Fig. 2(d).
(c) Dice metric is used to determine the overlap.
(d) Hausdorff distance (HD) is calculated between the ground truth and the algorithm outcome. (e) Mean surface distance (MSD), which is less sensitive to outliers.
3. RESULTS
All spinous processes on all cases were correctly detected and labeled. Segmentation errors are reported in Table 2
via mean, median and standard deviation (𝑆𝐷) values for individual and all spinous processes. Overall, we obtained an average Dice coefficient of 88 8%, average HD of 2.1 1.4 mm, and average MSD of 0.6 0.4 mm. For different spinous processes, the segmentation performance is quite similar but the Dice coefficient is a bit lower in
Fig. 2:Multi-class RF classification results. (a) Obtained class labels for different spinous processes (SP): red=SP1, yellow=SP2, cyan=SP3,
magenta=SP4, blue=SP5, green=SP6, and black=SP7. (b) Probability map for each image pixel. (c) Results after the refinement stage. (d)
Spinous processes manual ground truth, and (e) the algorithm-based segmentation-identification. (f) Orientation (via fitted ellipses major axis) and centers overlaid on a sagittal X-ray.
C1, while HD and MSD are higher in C7. Spinous process centroids positioning mean error is below 1 mm in C1-C6. Orientation differences return the best precision for C3-C7 with respective mean, median, and 𝑆𝐷 of 3.6, 2.8, and 3.3. Orientation values in C1 and C2 are not reported in Table 2, as these structures are often round-shaped with no dominant orientation. Fig. 3 illustrates the algorithm results together with the ground truth on some subjects with varied spinous processes in terms of shape, size, orientation, and image contrast.
Table 2 Spinous processes segmentation evaluation using different metrics. HD=Hausdorff distance,
MSD=mean surface distance
Dice (%) HD (mm) MSD (mm) 𝑆𝑃𝐶𝑒𝑛𝑡𝑒𝑟𝑒𝑟𝑟𝑜𝑟 (mm) 𝑆𝑃𝑂𝑟𝑖𝑒𝑟𝑟𝑜𝑟 (∘)
Region mean SD median mean SD median mean SD median mean SD median mean SD median
C1 82 15 86 2.0 1.0 1.8 0.6 0.4 0.5 0.8 0.5 0.6 – – – C2 91 4 93 2.1 1.6 1.8 0.6 0.4 0.5 0.7 0.5 0.5 – – – C3 90 4 91 1.7 0.9 1.4 0.5 0.2 0.4 0.6 0.4 0.5 4.7 4.4 3.3 C4 89 4 90 1.7 0.8 1.4 0.4 0.2 0.4 0.7 0.5 0.6 3.7 3.0 2.9 C5 86 6 88 2.1 1.3 1.7 0.6 0.3 0.4 0.9 0.7 0.6 3.5 3.4 2.4 C6 88 5 90 2.1 1.5 1.7 0.5 0.3 0.4 0.9 0.8 0.7 2.9 2.4 2.5 C7 87 8 90 3.1 2.0 2.5 0.8 0.6 0.6 1.3 0.9 1.1 3.0 2.8 2.4 Ave. 88 8 90 2.1 1.4 1.7 0.6 0.4 0.5 0.8 0.7 0.6 3.6 3.3 2.8
Fig. 3: Spinous processes segmentation examples from 3 subjects with different sizes and orientations. (a)-(c) Manual ground truth. (d)-(f) Corresponding automated segmentation results.
4. DISCUSSION AND CONCLUSION
In this study, we presented an automated framework for cervical vertebrae spinous process detection, segmentation, and identification. To do so, we used a leave-one-out cross validation approach to train and test a multi-class RF classifier that utilizes dedicated contextual features as predictors. Considering the huge variety in shape, size, orientation, and even contrast of different spinous processes, validation results demonstrate very promising outcomes (Fig. 3).
Despite the critical importance of assessing the spine posterior arch parameters, to clinically analyze the spine state and its probable abnormalities [9], or to morphologically model the spine for injury risk anticipation [17], only few works have dealt with this problem, all requiring one or more landmarks on spinous processes. In [10], [11] for instance a landmark on or close to the spinolaminar curve was chosen to approximate it via point interpolation. While there are many works addressing vertebral body detection, segmentation, and identification [18]–[20], to the best of our knowledge we introduce for the first time a fully automated method for spinous process detection, segmentation, and identification on sagittal X-rays of the cervical spine. Dice, HD and MSD evaluation metrics confirmed the efficiency of the proposed algorithm in accurately segmenting the spinous processes. Dice coefficient in C1 spinous process is a bit lower than in the others, which is understandable, as the C1 spinous process is much smaller, and minor surface differences can cause a noticeable decrease in Dice coefficients. Regarding the orientation evaluation, C1 and C2 are not very robust, as their shape is circular, which makes the ellipse fitting uncertain, unlike the more elongated C3-C7 spinous processes with the promising average 𝑆𝑃𝑂𝑟𝑖𝑒𝑟𝑟𝑜𝑟 of
3.6 3.3.
Overall, a high localization precision with a minor difference between various spinous processes is achieved. C7 shows slightly higher error, as in many subjects C7 is partially hidden by other anatomical structures leading to more misdetections and false positives. From a classification point of view, labeling is more robust in C1, C2, C3, C6, and C7. In these regions, we believe that the obtained labels can robustly be utilized as references for vertebrae identification. Although RF classification is highly robust in detecting C4 and C5 spinous processes (as shown in the evaluation), labels are sometimes not correctly assigned. The reason seems to be the similarity between these adjacent spinous processes in terms of shape, intensity and neighborhood. To tackle this limitation, other robustly identified spinous processes contribute to the labeling procedure in our post processing step.
Whilst the variability of structures in the cervical spine and especially the spinous processes, our results show that a pixel-wise object identification is achievable using our contextual visual features incorporated in a trained multi-class RF classifier, and the algorithm is robust to shape deformities and rotations. Our proposed contextual feature’s formation and formulation proved to be highly discriminative while not computationally demanding. We are able to exploit full cervical spine fields of view at native image resolution. Comparing to deep-learning such as
[21] will be the focus of our future work, while tackling current challenges with this approach, such as combining segmentation and labeling tasks, needs for a large annotated cohort and preserving image resolution for fine structures.
The introduced feature normalization step, while simple, is crucial for the stability of the results. Overall, the presented framework has a great potential for being integrated in clinical routine and being applied in a spine 3D model reconstruction procedure, resulting in less manual intervention requirements.
5. ACKNOWLEDGMENTS
The authors are grateful to the ParisTech BiomecAM chair program on subject-specific musculoskeletal modelling for funding, and particularly Société Générale and COVEA.
. REFERENCES
[1] S. Champain, K. Benchikh, A. Nogier, C. Mazel, J. De Guise, and W. Skalli, “Validation of new clinical quantitative analysis software applicable in spine orthopaedic studies,” Eur. Spine J., vol. 15, no. 6, pp. 982– 991, 2006.
[2] R. Lafage, E. Ferrero, J. K. Henry, V. Challier, B. Diebo, B. Liabaud, V. Lafage, and F. Schwab, “Validation of a new computer-assisted tool to measure spino-pelvic parameters,” Spine J., vol. 15, no. 12, pp. 2493– 2502, 2015.
[3] S. Ebrahimi, E. Angelini, L. Gajny, and W. Skalli, “Lumbar spine posterior corner detection in X-rays using Haar-based features,” in 13th IEEE International Symposium on Biomedical Imaging (ISBI), 2016.
[4] S. Ebrahimi, L. Gajny, W. Skalli, and E. Angelini, “Vertebral corners detection on sagittal X-rays based on shape modelling, random forest classifiers and dedicated visual features,” Comput. Methods Biomech.
Biomed. Eng. Imaging Vis., pp. 1–13, May 2018.
[5] S. M. M. R. Al Arif, M. Asad, M. Gundry, K. Knapp, and G. Slabaugh, “Patch-based corner detection for cervical vertebrae in X-ray images,” Signal Process. Image Commun., 2017.
[6] F. Lecron, M. Benjelloun, and S. Mahmoudi, “Fully Automatic Vertebra Detection in X-Ray Images Based on Multi-Class SVM,” in SPIE Medical Imaging: Image Processing, 2012.
[7] V. Doré, L. Duong, F. Cheriet, and M. Cheriet, “Towards Segmentation of Pedicles on Posteroanterior X-Ray Views of Scoliotic Patients,” in Image Analysis and Recognition: 4th International Conference, ICIAR
2007, Montreal, Canada, August 22-24, 2007. Proceedings, M. Kamel and A. Campilho, Eds. Berlin,
Heidelberg: Springer Berlin Heidelberg, 2007, pp. 1028–1039.
[8] J. Zhang, E. Lou, D. L. Hill, J. V. Raso, Y. Wang, L. H. Le, and X. Shi, “Computer-aided assessment of scoliosis on posteroanterior radiographs,” Med. Biol. Eng. Comput., vol. 48, no. 2, pp. 185–195, Feb. 2010. [9] T. R. Yochum and L. J. Rowe, Essentials of Skeletal Radiology, Volume 1, Third Edit. Lippincott Williams
& Wilkins, 2004.
[10] M. A. Larhmam, M. Benjelloun, and S. Mahmoudi, “Vertebra identification using template matching modelmp and K-means clustering,” Int. J. Comput. Assist. Radiol. Surg., vol. 9, no. 2, pp. 177–187, Mar. 2014.
[11] B. Narang, M. Phillips, K. Knapp, A. Appelboam, A. Reuben, and G. Slabaugh, “Semi-automatic delineation of the spino-laminar junction curve on lateral x-ray radiographs of the cervical spine,” in Proc. SPIE 9413,
Medical Imaging 2015: Image Processing, 2015, vol. 9413, p. 94132P–9413–6.
[12] Xi Xu, Hong-Wei Hao, Xu-Cheng Yin, Ning Liu, and S. H. Shafin, “Automatic segmentation of cervical vertebrae in X-ray images,” in The 2012 International Joint Conference on Neural Networks (IJCNN), 2012, pp. 1–8.
[13] T. F. Cootes, G. J. Edwards, and C. J. Taylor, “Active appearance models,” IEEE Trans. Pattern Anal. Mach.
Intell., vol. 23, no. 6, pp. 681–685, Jun. 2001.
[14] L. Breiman, “Random forests,” Mach. Learn., vol. 45, no. 1, pp. 5–32, 2001.
[15] M. Duckham, L. Kulik, M. Worboys, and A. Galton, “Efficient generation of simple polygons for characterizing the shape of a set of points in the plane,” Pattern Recognit., vol. 41, no. 10, pp. 3224–3236, Oct. 2008.
[16] R. M. Haralick and L. G. Shapiro, Computer and Robot Vision. Boston, MA: Addison-Wesley Longman Publishing Co., Inc., 1992.
[17] A. Laniece, D. Brauge, A. Laville, W. Skalli, and S. Laporte, “Influence of Morphology Cervical Spine Injuries Due to Rugby-Like Impacts. A Numerical Study,” in 22nd Congress of the European Society of
Biomechanics, 2016.
[18] Szu-Hao Huang, Yi-Hong Chu, Shang-Hong Lai, and C. L. Novak, “Learning-Based Vertebra Detection and Iterative Normalized-Cut Segmentation for Spinal MRI,” IEEE Trans. Med. Imaging, vol. 28, no. 10, pp. 1595–1605, Oct. 2009.
[19] T. Klinder, J. Ostermann, M. Ehm, A. Franz, R. Kneser, and C. Lorenz, “Automated model-based vertebra detection, identification, and segmentation in CT images,” Med. Image Anal., vol. 13, no. 3, pp. 471–482, Jun. 2009.
[20] B. Glocker, J. Feulner, A. Criminisi, D. R. Haynor, and E. Konukoglu, “Automatic localization and identification of vertebrae in arbitrary field-of-view CT scans.,” in 15th International Conference on
Medical Image Computing and Computer-Assisted Intervention (MICCAI), 2012.
[21] S. M. M. R. Al Arif, K. Knapp, and G. Slabaugh, “Fully automatic cervical vertebrae segmentation framework for X-ray images,” Comput. Methods Programs Biomed., vol. 157, pp. 95–111, Apr. 2018.