HAL Id: hal-02136202
https://hal-imt-atlantique.archives-ouvertes.fr/hal-02136202
Submitted on 21 May 2019
HAL is a multi-disciplinary open access
archive for the deposit and dissemination of
sci-entific research documents, whether they are
pub-lished or not. The documents may come from
teaching and research institutions in France or
abroad, or from public or private research centers.
L’archive ouverte pluridisciplinaire HAL, est
destinée au dépôt et à la diffusion de documents
scientifiques de niveau recherche, publiés ou non,
émanant des établissements d’enseignement et de
recherche français ou étrangers, des laboratoires
publics ou privés.
Influence of Internet Protocols and CDN on Web
Browsing
Antoine Saverimoutou, Bertrand Mathieu, Sandrine Vaton
To cite this version:
Antoine Saverimoutou, Bertrand Mathieu, Sandrine Vaton. Influence of Internet Protocols and CDN
on Web Browsing. NTMS 2019 : 10th IFIP International Conference on New Technologies, Mobility
and Security, Jun 2019, Canary Islands, Spain. �10.1109/NTMS.2019.8763827�. �hal-02136202�
Influence of Internet Protocols and CDN
on Web Browsing
https://webview.orange.com
(public website)https://webview.orange.com/d/UyIIcrUmz
(restricted access to reviewers, will be made public upon paper acceptance)Antoine Saverimoutou, Bertrand Mathieu
Orange Labs Lannion, France {antoine.saverimoutou,bertrand2.mathieu}@orange.com
Sandrine Vaton
IMT Atlantique Brest, France [email protected]Abstract—The Web ecosystem has been evolving over the past years and new Internet protocols, namely HTTP/2 over TLS/TCP and QUIC/UDP, are now used to deliver Web contents. Similarly, CDNs (Content Delivery Network) are deployed worldwide, caching contents close to end-users to optimize web browsing quality. We present in this paper an analysis of the influence of the Internet protocols and CDN on the Top 10,000 Alexa websites, based on a 12-month measurement campaign (from April 2018 to April 2019) performed via our tool Web View [1]. Part of our measurements are made public, represented on a monitoring website1, showing the results for the Top 50 Alexa Websites and 8
french websites, suggested by the French Telecom ministry. Our analysis of this long-term measurement campaign allows to better analyze the delivery of public websites. For instance, it shows that even if some argue that QUIC optimizes the quality, it is not observed in the real-life since QUIC is not largely deployed. Our method for analyzing CDN delivery in the Web browsing allows us to evaluate its influence, which is important since their usage can decrease the web pages’ loading time, on average 43.1% with HTTP/2 and 38.5% with QUIC, when requesting a second time the same home page.
Index Terms—Web, HTTP/2, QUIC, CDN
I. INTRODUCTION
T
HEWeb was originally meant to deliver static contents but has dramatically evolved over the last years to a complex ecosystem. Content is served through new Internet protocols, such as HTTP/2 (Version 2 of the HyperText Transfer Proto-col) [2], which runs over TCP, and QUIC (Quick UDP Internet Connections) [3] which runs over UDP and is paving its way to be standardized as HTTP/3. Meanwhile, network operators and service providers have been adopting the use of CDN infrastructures to optimize the quality offered to end-users. To measure it, standardization bodies like the W3C (World Wide Web Consortium) provide different web metrics to better quantify it. Web browsing quality is deeply correlated to web pages’ loading times and studies show that slow websites lead to web page abandonment. Identifying parameters enhancing or decreasing web browsing QoE is thus of prime importance. Research work has been done to study the impact of web1https://webview.orange.com
pages’ structure. Others have compared the different Internet protocols but evaluating them in standalone mode and with a limited set of specific web servers.
In this paper, we present an analysis about the real deploy-ment of Internet protocols (HTTP/1.1, HTTP/2, QUIC) and CDNs, through a user-representative web browsing measure-ment campaign, performed on the Top 10,000 Alexa websites on a 12-month duration (April 2018 - April 2019), with the Web View tool [1]. Our analysis presents the protocol distribution both for the web servers and the CDN nodes, and their influence on the time to load the home web page. Part of our measurements are made public on a monitoring website1for the Top 50 Alexa Websites and 8 french websites,
suggested by the French Telecom ministry.
We first remind in section II the existing web metrics and related work. In section III we expose our measurement campaign setup. Section IV depicts the Internet protocols distribution we observed and its influence on the end-users quality, whereas section V illustrates it for the CDN nodes involved in the Web browsing delivery. We finally conclude in section VI.
II. BACKGROUND ANDRELATEDWORK
There have been several efforts to better understand the Web ecosystem. Different web metrics and tools have been introduced in the process to identify the structure of websites and parameters which may influence web browsing.
The Page Load Time (PLT) is the time between the start of navigation and when the entire web page is loaded. The Resource Timing provides low-level information about the downloaded content, such as the Internet protocol used or size and type of object. The First Paint (FP) is the time needed for a first pixel to appear. The Above-The-Fold (ATF) [4], using W3C metrics, exposes the time needed to fully load the visible surface area of a web page at first glance. The TFVR (Time for Full Visual Rendering) [5] exposes the loading time of the visible portion of a website at first glance (without scrolling) by making use networking information through the web browser’s exposed HAR (HTTP Archive).
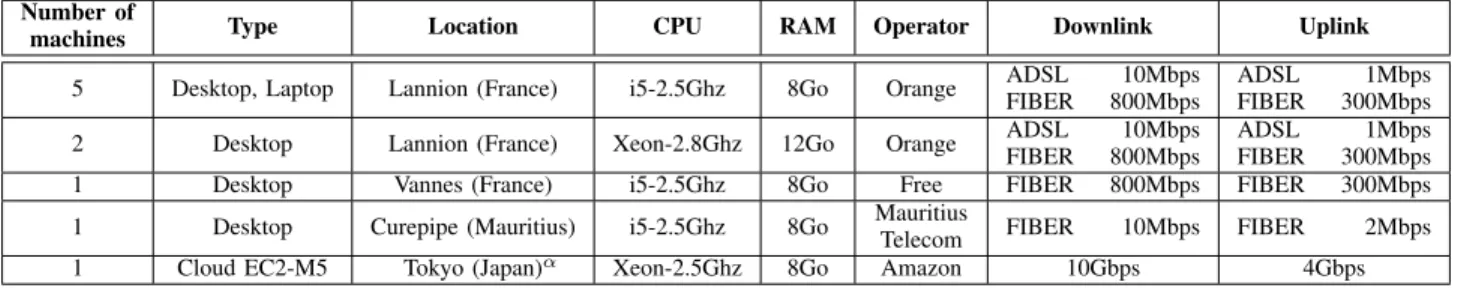
Number of
machines Type Location CPU RAM Operator Downlink Uplink
5 Desktop, Laptop Lannion (France) i5-2.5Ghz 8Go Orange ADSL
FIBER 10Mbps 800Mbps ADSL FIBER 1Mbps 300Mbps 2 Desktop Lannion (France) Xeon-2.8Ghz 12Go Orange ADSLFIBER 800Mbps10Mbps ADSLFIBER 300Mbps1Mbps
1 Desktop Vannes (France) i5-2.5Ghz 8Go Free FIBER 800Mbps FIBER 300Mbps
1 Desktop Curepipe (Mauritius) i5-2.5Ghz 8Go Mauritius
Telecom FIBER 10Mbps FIBER 2Mbps
1 Cloud EC2-M5 Tokyo (Japan)α Xeon-2.5Ghz 8Go Amazon 10Gbps 4Gbps
αMeasurements are not performed on a day-to-day basis
TABLE I: Machines used for our measurements
A set of tools has been used by the research community [6] [7] to perform automated web browsing supporting stateful and stateless measurements, identify bottlenecks in the web page loading process, characterize a particular Internet access and detect root causes of poor experiences in web applications. All these works have largely contributed to the research field but they focus on specific configurations and tests, not analyzing a large set of public websites over a long period.
While some research work investigate the impact of differ-ent Internet protocols on web browsing quality [8] [9], others have been investigating the impact of web pages structure on end-users QoE and their evolution [10]–[15]. Contents being delivered by CDNs, research work has also been made how to improve delivery [16] [17] [18].
When studying web browsing performance as a whole, different on-market web browsers, Internet protocols, network bandwidths, usage of content delivery networks and types of websites need to be taken into account. We have thus tackled our research work by taking them into account to analyze the influence of the deployment of the new Internet protocols (HTTP2, QUIC) and the usage of CDN on Web browsing.
III. MEASUREMENTCAMPAIGNSETUP
Our measurement campaign has been performed during one year (from April 2018 to April 2019), in France, Mauritius and Tokyo as illustrated in Table I through Web View [1]. The different machines operate under Ubuntu 16.04 LTS and the two mostly used on-market web browsers namely Google-Chrome and Mozilla-Firefox, with different window sizes. While Chrome is driven by Chromedriver, Geckodriver drives Firefox and the main automator is Selenium v.3.14.
Automated web browsing sessions have been conducted 24/7/365 by requesting different Internet protocols (only Chrome supports QUIC). When requesting HTTP/1.1, we de-activate HTTP/2 and QUIC in the browser; requesting HTTP/2 implies deactivating QUIC but allowing fallback to HTTP/1.1; when requesting QUIC, we allow fallback to HTTP/1.1 and HTTP/2 for non-UDP web servers. We collect 4 different loading times for each measurement, namely the FP, the TFVR, the PLT and the web browser’s processing time. From the collected HAR we assess the overall number of objects downloaded, their MIME (Multipurpose Internet Main Exten-sions) type and fine-grained timings for every resource (DNS, blocking, connecting, request, waiting and response time).
From the exposed remote servers’ IP addresses correlated to MaxMind GeoIP2 database, we identify the continents from
which these resources are downloaded. For every downloaded resource, we assess through the response headers if we have a cache-hit, indicating if the resource is delivered by a CDN or a cache node. In this case, based on the IP address of the remote server, we resolve its Autonomous System (AS) through the RIPE Atlas database3, and correlated with CdnFinder4 using URLs or with DNS (Domain Name System) message analysis, we are able to identify the presence of a CDN node and its provider. As per the different collected timings, which indicate a web page loading progression through time, we also collect the number of resources downloaded in these lapses of time and the Internet protocol through which they are delivered. Measurements are represented on our monitoring website as well as domains or CDNs5 delivering contents.
IV. INFLUENCE OFINTERNETPROTOCOLS
When browsing a website, an end-user expects to be served by the Internet protocol she requests. However, one website is not fully delivered by one single web server but is rather composed of many resources coming from many different servers, which might not implement the requested protocol. As such, some can reply with another protocol. The Figure 1 (Heatmap: Dark Red means 100% of content delivered in HTTP/2, Light Red means 0%) illustrates how our measured websites reply in terms of Internet protocol distribution when using a Chrome web browser and requesting the content with HTTP/2. It allows to evaluate the fallback to HTTP/1.1 to fetch the resources when the servers do not implement HTTP/2. We can see that websites’s homepage located in North America deliver content through a higher rate of HTTP/2 whereas those coming from Asia are mainly delivered in HTTP/1.1. For websites in Europe and South America, it is almost uniformly distributed over HTTP/2 and HTTP/1.1. For the set of the Top 10,000 Alexa sites, only 12% of websites reply fully in HTTP/2 for all the downloaded resources.
From our one-year long measurement campaign, we have detected that HTTP/2 is deployed at a very slow rate. Indeed, only 4% more resources are delivered in HTTP/2 as compared
2http://www.maxmind.com 3https://stat.ripe.net
4https://www.cdnplanet.com/tools/cdnfinder/
(a) Home page in NA (b) Home page in EU (c) Home page in SA (d) Home page in AS
Fig. 1: Protocol distribution when requesting HTTP/2
Fig. 2: Received QUIC distribution when requesting QUIC
Requesting HTTP/2 Requesting QUIC Received Distribution (%) PLT (ms) Received Distribution (%) PLT (ms) Websites H1 H2 H1 H2 QUIC android.com - 100 2431 - 6.94 93.06 2301 youtube.com - 100 3050 - 23.38 76.62 2809 tumblr.com - 100 2562 - 31.34 68.66 2571 lefigaro.fr 26.32 73.68 5903 27.59 67.25 5.17 5676 twitch.tv 45.97 54.03 5256 45.97 54.03 - 5132 cnn.com 25.44 74.56 5317 24.23 75.77 - 5390 deviantart.com 3.57 96.43 4180 3.53 96.43 0.04 4156 facenama.com 4.47 95.52 12510 4.84 16.42 79.1 11236 imgur.com 5.26 94.74 2332 5.36 92.86 1.79 2233 theguardian.com 17.12 82.88 4125 21.05 73.1 5.85 3549
TABLE II: Received protocol distribution and web page load-ing time followload-ing requested protocol
to one year ago (63% in April 2019 vs 59% in April 2018). Furthermore, many websites include Google Services which represent a huge part of this traffic. When removing Google resources, the percentage of the remaining resources delivered in HTTP/2 is only 20%.
As seen in Fig. 2, the distribution ratio is worth for QUIC, since requesting QUIC results in no websites fully delivering contents through it and only 6.12% resources on average are delivered with QUIC. It shows that QUIC adoption is still very low, being mainly deployed in Google web servers (97%).
To conclude this analysis of the protocol distribution over the public web sites, we can say that HTTP/1.1 is still largely used by web servers, HTTP/2 is deployed at a low pace and QUIC is currently mainly deployed on Google web servers.
Seeing that when requesting one Internet protocol, we can get resources through another one, we wanted to evaluate its potential impact on web browsing quality (page loading time). Table II shows the average values of the PLT for 10
representative websites, and their protocol distribution, when measurements are performed over a Fiber access network. We can see that the value is almost the same for HTTP/2 and QUIC (reduction of only 4.6% for QUIC). This is due to the fact that QUIC adoption is currently very limited and its distribution only represents 7%. Other tests performed over an ADSL network shows that the QUIC protocol helps in decreasing the average PLT by 7.62%, mainly because QUIC works better with low bandwidth networks.
V. INFLUENCE OFCDN
As explained in section III, with our tool we are able to detect that a resource is delivered by a CDN node (and the provider), the used Internet protocol and the node location. In the previous section, we have seen that a web server can reply with an Internet protocol different than the requested one. In this section, we present the results of our measurement campaign on the Top 10,000 Alexa websites, showing that the behavior is the same for CDN providers. We analyzed which Internet protocol is used by the CDN providers and noticed that only 32 CDNs (out of 84 well-known CDNs) have adopted HTTP/2 and only 20 CDNs reply in QUIC. For those replying in QUIC, Google is the main actor (60.7%), Akamai delivers 5.3%, whereas the others provide less than 1% (Verizon, Fastly, Level3, etc).
Since contents can (or not) be available in the CDN node, we performed additional tests with a Repeat mode, to compare with the First mode, which is the normal behavior. This Repeat mode means that we first get the home page of the website, clear all local caches and request the same home page again. Since those resources have just been retrieved, they might have been cached in a CDN node and thus we expect a larger number of resources fetched from the CDN when requesting the home page the second time.
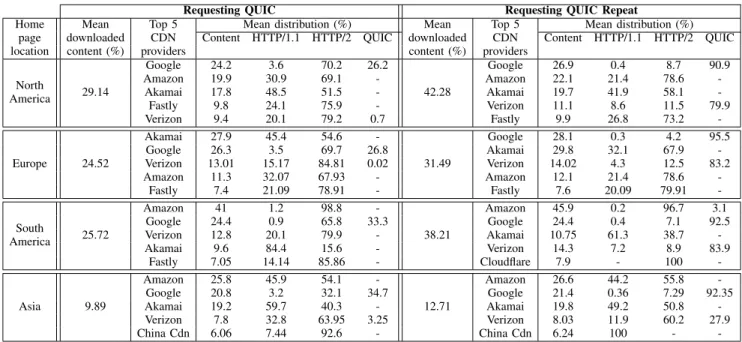
For the Top 10,000 websites, when requesting the QUIC protocol (with possible fallback to HTTP/2 and HTTP/1.1) for the First mode, the CDNs providers deliver an average of 22.3% of the contents to end-users. For North America, South America and Europe, the CDN delivery is at an average of 26.5% but less than 10% for websites having their home page located in Asia. With the Repeat mode, the overall CDN delivery reaches 31.2%, with 37.3% for North America, South America and Europe websites and 12.71% for Asia.
Requesting QUIC Requesting QUIC Repeat Home page location Mean downloaded content (%) Top 5 CDN providers
Mean distribution (%) Mean
downloaded content (%) Top 5 CDN providers Mean distribution (%)
Content HTTP/1.1 HTTP/2 QUIC Content HTTP/1.1 HTTP/2 QUIC
North America Google 24.2 3.6 70.2 26.2 Google 26.9 0.4 8.7 90.9 29.14 Amazon 19.9 30.9 69.1 -42.28 Amazon 22.1 21.4 78.6 -Akamai 17.8 48.5 51.5 - Akamai 19.7 41.9 58.1 -Fastly 9.8 24.1 75.9 - Verizon 11.1 8.6 11.5 79.9 Verizon 9.4 20.1 79.2 0.7 Fastly 9.9 26.8 73.2 -Europe Akamai 27.9 45.4 54.6 - Google 28.1 0.3 4.2 95.5 24.52 Google 26.3 3.5 69.7 26.8 31.49 Akamai 29.8 32.1 67.9 -Verizon 13.01 15.17 84.81 0.02 Verizon 14.02 4.3 12.5 83.2 Amazon 11.3 32.07 67.93 - Amazon 12.1 21.4 78.6 -Fastly 7.4 21.09 78.91 - Fastly 7.6 20.09 79.91 -South America Amazon 41 1.2 98.8 - Amazon 45.9 0.2 96.7 3.1 25.72 Google 24.4 0.9 65.8 33.3 38.21 Google 24.4 0.4 7.1 92.5 Verizon 12.8 20.1 79.9 - Akamai 10.75 61.3 38.7 -Akamai 9.6 84.4 15.6 - Verizon 14.3 7.2 8.9 83.9 Fastly 7.05 14.14 85.86 - Cloudflare 7.9 - 100 -Asia Amazon 25.8 45.9 54.1 - Amazon 26.6 44.2 55.8 -9.89 Google 20.8 3.2 32.1 34.7 12.71 Google 21.4 0.36 7.29 92.35 Akamai 19.2 59.7 40.3 - Akamai 19.8 49.2 50.8 -Verizon 7.8 32.8 63.95 3.25 Verizon 8.03 11.9 60.2 27.9 China Cdn 6.06 7.44 92.6 - China Cdn 6.24 100 -
-TABLE III: Content delivered by CDNs to an end-user in France when using Chrome v.71
Fig. 3: CDN usage and impact on PLT
The Table III depicts the distribution rate of content when requesting QUIC and QUIC Repeat from one probe deployed in France. The table gives many information and for example, we can see that for the First mode, CDNs serve on average 22.3% of contents. When a home page is located in South America, a European end-user is served by Amazon nodes located in South America in HTTP/2 at an average distribu-tion rate of 98.8%, while Amazon nodes located in Europe (precisely Netherlands) reply on average in 67.93% HTTP/2. Furthermore, Akamai nodes located in South America deliver contents mainly in HTTP/1.1.
When performing the tests in the Repeat mode, CDNs usage increases from 22.3% to 31.2%. The Repeat mode favors 0-RTT UDP and 1-0-RTT TCP connections and helps in retrieving content directly from CDNs edge servers with a cache-hit rate
of 98.6% and QUIC distribution is increased by 54.3% (mainly from Google web servers).
In order to analyze the impact of CDNs, we measured the PLT for the First and Repeat mode, both with HTTP/2 and QUIC, at different times of the day. The Peak Period involves measurements performed between 16H and 21H CET and the Off-Peak Period involves measurements performed between 02H and 06H CET.
The Figure 3 illustrates the observed PLT of the Top 1,000 Alexa websites. During Peak Period, requesting HTTP/2 Repeat versus HTTP/2 increases CDN usage from 21.8% to 29.9% and decreases the PLT on average by 31.2%. Request-ing QUIC Repeat versus QUIC increases CDN usage from 22.3% to 30.4% and decreases the PLT on average by 31.4%. The Repeat mode irrespective of the protocol yields merely the
same decrease in loading times. The difference of CDN usage between the QUIC Repeat mode versus the HTTP/2 Repeat is 1.5% and decreases the average PLT by only 181.2 ms since only three CDNs (observed from our measurements) deliver content in QUIC.
For the Off-Peak Periods, when requesting HTTP/2 and QUIC, more resources need to be fetched from the origin servers. This results into a mean CDN usage of 15.3% when request-ing HTTP/2 and 15.6% when requestrequest-ing QUIC. Requestrequest-ing HTTP/2 Repeat versus HTTP/2 increases CDN usage from 15.3% to 29.5% and decreases average PLT by 43.14% (2100.3 ms). The difference of CDN usage between the QUIC protocol and HTTP/2 is only 0.28% and decreases the average PLT by only 452.8 ms. This is mainly due to the latency to reach websites located in Asia and South America.
To conclude, our evaluation, performed with the Repeat mode, clearly highlights the benefits of the CDN delivery in the web browsing quality, leading to a non-negligible load time reduction for all websites (an average of 43.1% for HTTP/2 and 38.5% for QUIC), compared to the First mode. If CDN providers deploy the new protocols in their CDN nodes, the end-users’ QoE can even be more improved.
VI. CONCLUSION ANDFUTURE WORK
The web browsing ecosystem is very complex, with web page structures composed of different types of objects and sizes, new Internet protocols aiming to offer security and efficiency, the use of CDN to provide contents closer to end-users, etc. The goal of this paper was to assess over a 12-month period of measurements the influence of the new protocols (HTTP/2 and QUIC) and CDNs on web browsing and how they can reduce the web pages’ loading time.
From our long-term analysis over the Top 10,000 Alexa websites, we can see that the deployment of new Internet protocols by public websites is slow. Although standardized in 2013 and now available in many products, HTTP/2 is not yet widely deployed, only used for delivering an average of 63% resources. In one year, its deployment rate has increased only by 4%. QUIC, promoted by Google and currently under discussion at IETF, is not yet standardized and mainly used for Google services.
CDNs are now widely used and some big CDN providers have a very large footprint on the world. For web browsing, our measurement campaign highlights its benefits, since in the Repeat mode, the Page Load Time can be reduced by an average of 43.1% for HTTP/2 and 38.5% for QUIC, leading to a better perceived quality by end-users. In short, about more than a quarter of the global contents is served by CDN but in Asia, the use of well-known CDN is yet limited (only 10%). Location of servers delivering contents being at the center of web performance, an ongoing and future work is to assess the network path taken by content before reaching an end-user and its implications on web browsing experience.
VII. ACKNOWLEDGEMENT
This work is partially funded by the French ANR BottleNet project, No ANR-15-CE25-0013-001.
REFERENCES
[1] A. Saverimoutou, B. Mathieu, and S. Vaton, “Web view: Measuring and monitoring representative information on websites,” in IEEE In-ternational Workshop on Quality of Experience Management, QOE-MANAGEMENT Paris, France, February 18, 2019, 2019.
[2] M. Belshe, R. Peon, and M. Thomson, “Hypertext Transfer Protocol Version 2 (HTTP/2),” RFC 7540, May 2015.
[3] J. Iyengar and M. Thomson, “QUIC: A UDP-Based Multiplexed and Secure Transport,” Internet Engineering Task Force, Internet-Draft draft-ietf-quic-transport-18, Jan. 2019, work in Progress.
[4] I. Grigorik. (2012, jul) Above the fold time: Measuring web page performance visually. [Online]. Available: http://conferences.oreilly. com/velocity/velocity-mar2011/public/schedule/detail/18692
[5] A. Saverimoutou, B. Mathieu, and S. Vaton, “Web browsing mea-surements: An above-the-fold browser-based technique,” in 38th IEEE International Conference on Distributed Computing Systems, ICDCS 2018, Vienna, Austria, July 2-6, 2018, 2018.
[6] S. Englehardt and A. Narayanan, “Online tracking: A 1-million-site measurement and analysis,” in Proceedings of the 2016 ACM SIGSAC Conference on Computer and Communications Security, Vienna, Austria, October 24-28, 2016, 2016, pp. 1388–1401.
[7] X. S. Wang, A. Balasubramanian, A. Krishnamurthy, and D. Wetherall, “Demystifying page load performance with wprof,” in Proceedings of the 10th USENIX Symposium on Networked Systems Design and Implementation, NSDI 2013, Lombard, IL, USA, April 2-5, 2013, 2013. [8] A. M. Kakhki, S. Jero, D. R. Choffnes, C. Nita-Rotaru, and A. Mislove, “Taking a long look at QUIC: an approach for rigorous evaluation of rapidly evolving transport protocols,” in Proceedings of the 2017 Internet Measurement Conference, IMC 2017, London, United Kingdom, November 1-3, 2017, 2017.
[9] P. Biswal and O. Gnawali, “Does quic make the web faster?” in 2016 IEEE Global Communications Conference (GLOBECOM), Dec 2016. [10] M. Butkiewicz, H. V. Madhyastha, and V. Sekar, “Characterizing web
page complexity and its impact,” IEEE/ACM Trans. Netw., 2014. [11] E. Bocchi, L. D. Cicco, and D. Rossi, “Measuring the quality of
experience of web users,” Computer Communication Review, 2016. [12] C. Kelton, J. Ryoo, A. Balasubramanian, and S. R. Das, “Improving user
perceived page load times using gaze,” in 14th USENIX Symposium on Networked Systems Design and Implementation, NSDI 2017, Boston, MA, USA, March 27-29, 2017, 2017.
[13] M. Varvello, J. Blackburn, D. Naylor, and K. Papagiannaki, “EYEORG: A platform for crowdsourcing web quality of experience measurements,” in Proceedings of the 12th International on Conference on emerging Networking EXperiments and Technologies, CoNEXT 2016, Irvine, Cal-ifornia, USA, December 12-15, 2016, 2016, pp. 399–412.
[14] Q. Gao, P. Dey, and P. Ahammad, “Perceived performance of top retail webpages in the wild: Insights from large-scale crowdsourcing of above-the-fold qoe,” in Proceedings of the 2017 Workshop on QoE-based Analysis and Management of Data Communication Networks, Internet-QoE@SIGCOMM 2017, Los Angeles, CA, USA, August 21, 2017, 2017. [15] T. Enghardt, T. Zinner, and A. Feldmann, “Web performance pitfalls,” in Passive and Active Measurement, D. Choffnes and M. Barcellos, Eds. Springer International Publishing, 2019, pp. 286–303.
[16] S. P. Narayanan, Y. S. Nam, A. Sivakumar, B. Chandrasekaran, B. M. Maggs, and S. G. Rao, “Reducing latency through page-aware manage-ment of web objects by content delivery networks,” in Proceedings of the 2016 ACM SIGMETRICS International Conference on Measurement and Modeling of Computer Science, Antibes Juan-Les-Pins, France, 2016. [17] R. Anwar, H. Niaz, D. R. Choffnes, ´I. S. Cunha, P. Gill, and E.
Katz-Bassett, “Investigating interdomain routing policies in the wild,” in Proceedings of the 2015 ACM Internet Measurement Conference, IMC 2015, Tokyo, Japan, October 28-30, 2015, 2015.
[18] M. Flores and H. Bedi, “Caching the internet: A view from a global multi-tenant CDN,” in Passive and Active Measurement - 20th Interna-tional Conference, PAM 2019, Puerto Varas, Chile, March 27-29, 2019, Proceedings, 2019, pp. 68–81.