HAL Id: hal-01944490
https://hal-mines-albi.archives-ouvertes.fr/hal-01944490
Submitted on 7 Nov 2019
HAL is a multi-disciplinary open access
archive for the deposit and dissemination of
sci-entific research documents, whether they are
pub-lished or not. The documents may come from
teaching and research institutions in France or
abroad, or from public or private research centers.
L’archive ouverte pluridisciplinaire HAL, est
destinée au dépôt et à la diffusion de documents
scientifiques de niveau recherche, publiés ou non,
émanant des établissements d’enseignement et de
recherche français ou étrangers, des laboratoires
publics ou privés.
Computational intelligence modelling of pharmaceutical
tabletting processes using bio-inspired optimization
algorithms
Hossam Zawbaa, Serena Schiano, Lucia Perez-Gandarillas, Crina Grosan,
Abderrahim Michrafy, Chuan-Yu Wu
To cite this version:
Hossam Zawbaa, Serena Schiano, Lucia Perez-Gandarillas, Crina Grosan, Abderrahim Michrafy,
et al..
Computational intelligence modelling of pharmaceutical tabletting processes using
bio-inspired optimization algorithms. Advanced Powder Technology, Elsevier, 2018, 29 (12), p.2966-2977.
�10.1016/j.apt.2018.11.008�. �hal-01944490�
Computational intelligence modelling of pharmaceutical tabletting
processes using bio-inspired optimization algorithms
Hossam M. Zawbaa
a,b,⇑, Serena Schiano
c, Lucia Perez-Gandarillas
d, Crina Grosan
a, A. Michrafy
d,
Chuan-Yu Wu
caFaculty of Mathematics and Computer Science, Babes-Bolyai University, Romania bFaculty of Computers and Information, Beni-Suef University, Egypt
cDepartment of Chemical and Process Engineering, University of Surrey, United Kingdom dUniversité de Toulouse, Mines Albi, CNRS, Centre RAPSODEE, France
Keywords: Tabletting
Computational intelligence Critical process parameters Predictive modelling Die compaction Bio-inspired optimization Artificial neutral network
a b s t r a c t
In pharmaceutical development, it is very useful to exploit the knowledge of the causal relationship between product quality and critical material attributes (CMA) in developing new formulations and prod-ucts, and optimizing manufacturing processes. With the big data captured in the pharmaceutical indus-try, computational intelligence (CI) models could potentially be used to identify critical quality attributes (CQA), CMA and critical process parameters (CPP). The objective of this study was to develop computa-tional intelligence models for pharmaceutical tabletting processes, for which bio-inspired feature selec-tion algorithms were developed and implemented for optimisaselec-tion while artificial neural network (ANN) was employed to predict the tablet characteristics such as porosity and tensile strength. Various pharma-ceutical excipients (MCC PH 101, MCC PH 102, MCC DG, Mannitol Pearlitol 200SD, Lactose, and binary mixtures) were considered. Granules were also produced with dry granulation using roll compaction. The feed powders and granules were then compressed at various compression pressures to produce tablets with different porosities, and the corresponding tensile strengths were measured. For the CI mod-elling, the efficiency of seven bio-inspired optimization algorithms were explored: grey wolf optimization (GWO), bat optimization (BAT), cuckoo search (CS), flower pollination algorithm (FPA), genetic algorithm (GA), particle swarm optimization (PSO), and social spider optimization (SSO). Two-thirds of the exper-imental dataset was randomly chosen as the training set, and the remaining was used to validate the model prediction. The model efficiency was evaluated in terms of the average reduction (representing the fraction of selected input variables) and the mean square error (MSE). It was found that the CI models can well predict the tablet characteristics (i.e. porosity and tensile strength). It was also shown that the GWO algorithm was the most accurate in predicting porosity. While the most accurate prediction for the tensile strength was achieved using the SSO algorithm. In terms of the average reduction, the GA algo-rithm resulted in the highest reduction of inputs (i.e. 60%) for predicting both the porosity and the tensile strength.
1. Introduction
Over 70% pharmaceutical products are in the tablet form, which is manufactured with die compaction of formulated blends. Most pharmaceutical blends need to go through granulation processes to improve their processabilities. Two types of granulation
pro-cesses are generally used: wet granulation and dry granulation. In recent years, dry granulation has become one of the primary production processes for pharmaceutical tablets[1–3] due to its distinct advantages for heat and moisture sensitive materials. Roll compaction is a widely used dry granulation technique that con-sists of two main steps: (1) roll compaction of raw material to obtain ribbons and (2) milling the ribbons into granules. The gran-ules are then used to produce tablets. It is well recognized that the variation in composition and the quality of tablets are determined by material properties and process conditions during die filling, compaction and ejection[4].
⇑ Corresponding author.
E-mail addresses:hossam.zawbaa@gmail.com(H.M. Zawbaa),c.y.wu@surrey.ac. uk(C.-Y. Wu).
One of the grand challenges in pharmaceutical development is to identify the causal relationship between material properties, intermediate properties, process variables and final product prop-erties[5]. For example, it is well known that comparing tablets produced by direct compression, the tablets made with granules produced using roll compaction generally have lower tensile strengths, i.e. there is a loss in tabletability[6,7]. Several attempts were then made to explain this behavior. For example, Malkowska and Khan [8]proposed the concept of work hardening that was defined as the increase of resistance to permanent deformation of a material with the amount of deformation and argued that work hardening led to the observed reduction in tabletability of pharmaceutical excipients. Sun and Himmelspach[9]showed that tabletability of MCC powders reduced with increasing granule size, and suggested that granule size enlargement was primarily responsible for the reduction in tabletability, because larger gran-ules tend to pack less efficiently due to smaller binding/contact areas, resulting in a reduced tensile strength of the tablets. This illustrates that many factors (i.e. features) play a role in determin-ing the quality of final products. However, the contribution of each feature varies from process to process, and from product to prod-uct. It is of practical and scientific importance to identify the dom-inant ones, i.e. to select the domdom-inant feature in formulation design and product development.
Feature selection is very important in many engineering prac-tices, due to the abundance of noisy, irrelevant, or misleading fea-tures. In the development of predictive models, the redundant and irrelevant features could degrade the model performance during the learning process[10]. Feature selection is particularly useful when the number of features is large and not all of them are required for describing the data and for further exploring the data features in experiments[11]. This process leads to reduction in the dimensionality of feature space for a successful prediction task. Feature selection also helps understanding data, reducing compu-tation requirements, and reducing the effect of the curse of dimen-sionality[12]. The selected features will improve the prediction model performance and provide a faster and more cost-effective prediction while maintaining the predictability (i.e. accuracy)
[13]. Identification and selection of the relevant features is, how-ever, a complex problem. Feature selection is considered as a mul-tiobjective task that minimizes both the selected features and the prediction error. These two objectives are normally contradicted and the optimal solution needs to be sought in the presence of a tradeoff between them [14]. Hence a robust optimisation tech-nique becomes essential in feature selection.
For optimisation, various heuristic techniques mimicing the social behaviour of biological and physical systems of insects, birds, animals, fish in nature were proposed [15]. For instance, genetic algorithm (GA) was the first evolutionary algorithm intro-duced in the literature that mimics the natural evolution process of a population of initial individuals[16]. Particle swarm optimiza-tion (PSO) was one of the well-known swarm algorithms based on the movement and the social behaviour of birds within a flock
[17]. Artificial bee colony (ABC) was a numerical optimization algo-rithm based on the foraging behavior of honeybees[18]. A virtual bee algorithm (VBA) was developed to optimise the numerical function in 2-D using a swarm of virtual bees, which move ran-domly in the search space and interact to find food sources
[19,20]. Artificial fish swarm (AFS) algorithm was introduced to mimic the stimulant reaction by controlling the tail and fin[21].
However, the application of these optimisation techniques in feature selection is still very limited for complex pharmaceutical development and manufacturing, where a feature is a measurable property contributing to the process performance and product quality, and the number of features involved is generally very large, even though the contributions of some features are very
small. Therefore, the purpose of this study is to develop predictive CI models for the tablet manufacturing process with pharmaceuti-cal powders and roll-compacted granules, for which various bio-inspired optimization algorithms are employed for feature selec-tion and an artificial neural network is applied to predict tablet properties, such as porosity and tensile strength. The efficiency of these bio-inspired optimization algorithms for feature selection will be evaluated for maximising feature reduction (minimizing the number of selected features, or identifying the most important features) while obtaining comparable or even better prediction. 2. Bio-inspired optimization algorithms
In this study, seven bio-inspired optimisation algorithms are considered: (1) Grey Wolf Optimization (GWO), (2) Bat Algorithm (BAT), (3) Cuckoo Search (CS), (4) Flower Pollination Algorithm (FPA), (5) Social Spider Optimization (SSO), (6) Genetic Algorithm (GA), and (7) Particle Swarm Optimization (PSO). For complete-ness, a brief introduction of these algorithms is presented in this section, together with a brief description of the artificial neural network.
2.1. Grey Wolf Optimization (GWO)
Grey wolf optimization (GWO) is a new evolutionary computa-tion technique that iss successfully applied in many optimizacomputa-tion tasks but still suffers from the lack of fast and global convergence. Grey wolves manifest a social behaviour – living in groups or packs (of 5–12 on average) with a very rigid hierarchy made of four dif-ferent classes[22]:
1. The leaders (denoted as
a
wolves), consisting of one male and one female wolves. They are responsible for making nec-essary decisions onall pack activities, such as hunting, resting, and travelling. All other wolves in the pack obey their decisions.2. Beta bð Þ wolves. They help the
a
wolves in decision-making and other group actions, and are the best candidates to be elected as the nexta
wolf if aa
wolf dies or becomes too old.3. Delta dð Þ wolves. They are obeying the
a
and b wolves. There are various types of delta wolves with different duties, such as hun-ters, sentinels, Scouts, and caretakers.4. Omegað Þ wolves. They are considered as the lowest ranked
x
wolves and have to obey the different dominant wolves. Each grey wolf decides its position and movement to better areas. GWO is incorporated with a risk probability that mimics the events of wolves crashing with their foes. Moreover, each grey wolf has a particular sensing (coverage) range, indicated as the visual distance. In each iteration t, the new positions X of the wolves are determined using Eqs.(1) and (2) [23]. The best fitted solution is assigned to
a
, the second-best solution to b, and the third-best toc
. All other solutions are assigned tox
.X
! t þ 1ð Þ ¼ X!pð Þ þ At !% D!; ð1Þ
D !
¼ j C!% X!pð Þ & Xt ! tðÞj; ð2Þ
where D! is the fitness value of each hunt agent, A!, and C! demon-strate coefficient vectors are calculated as Eqs. (3) and (4), X!p
depicts a prey position, and X! represents a wolf position.
A ! ¼ 2 A!% R!!1 & a!; ð3Þ C ! ¼ 2 R!!2; ð4Þ
where a! is the updating parameter, R1and R2are the random
vec-tors with a value in [0, 1].
The
a
;b, and d wolves are defined, imposing the other agents to upgrade their positions accordingly. Thus, the wolves’ positions are updated as Da !! ¼ j C!!1 % X!!a & X!j; Db !! ¼ j C!!2 % X!!b & X!j; Dd !! ¼ j C!!3 % X!!d & X!j ð5Þ X1 !! ¼ j X!!a & A!!1 % D!!aj; X2 !! ¼ j X!!b & A!!2 % D!!bj; X3 !! ¼ j X!!d & A!!3 % D!!dj ð6Þ X ! t þ 1ð Þ ¼ X1 !! þ X!!2 þ X!!3 3 ; ð7Þwhere t is the iteration number.
a
;b and d are assigned with random numbers in [0, 1].2.2. Bat Algorithm (BAT)
BAT algorithm is a meta-heuristic technique for solving com-plex optimization problems. Bats use echolocation behavior for seeking the prey and detect/avoid the obstacles. The bats use time delay in the reflection of the emitted loud sound pulse from the surrounding object for navigation in dark[24]. And the magnitude of the emitted sound fluctuates from a high value when looking at the prey and a low value when flying near their prey[25]. The bats’ positions can be determined from[26,27]:
Fi¼ Fminþ Fð max& FminÞb; ð8Þ
Vt
i¼ Vt&1i þ X" ti& X'#Fi; ð9Þ
Xt
i¼ Xt&1i þ Vti; ð10Þ
where b indicates the random vector defined in the uniform distri-bution, X'denotes the best position obtained so far, F
minoutlines the
minimum frequency, Fmaxshows the maximum frequency, and Vi
depicts the speed vector. Moreover, a local exploration is performed by employing the random movement as follows
Xnew¼ Xoldþ
!
At; ð11Þwhere
!
is a random number in [&1, 1], and At represents a batloudness at the t time and is given as
Atþ1
i ¼
a
At; ð12Þwhere
a
is a constant that can be experimentally determined, Ricontrols the BAT local search and is determined by:
Rtþ1
i ¼ R0i½1 & exp &ð
c
tÞ); ð13Þwhere R0
i denotes the first pulse emission which has a value larger
than 0.
2.3. Cuckoo Search (CS)
Cuckoo search (CS) is a heuristic search technique inspired by the cuckoos reproduction strategy[28]. Cuckoos replace their eggs in the nests of other host birds that may be of different kinds. Once the host bird notices that the eggs are not its own, it will either crush the egg or leave the nest to another. Various studies showed that the flight behavior of many animals and insects had the typical characteristics of Lèvy flights. Lèvy flights provide a random walk
while their random steps are drawn from a Lèvy distribution for large steps[28]. In the CS optimisation, a new solution Xiis based
on Lèvy flight and given as
Xtþ1
i ¼ Xtiþ # * L!e
v
y bð Þ; ð14Þwhere # represents the step size associated with the scale problem that is set to 1 in most of the cases, * indicates entry wise multiplications.
Previous studies on the flight behaviour of different animals and insects[29]. Lèvy flights for large moves could be defined as
L!e
v
y + u ¼ t&k;ð1 < k6 3Þ: ð15ÞHence, the successive jumps of the cuckoo form a random walk, and the Lèvy walk should generate some new solutions close to the best solution, which will advance the local search process[28]. The CS local search can be formulated as
Xnew
i ¼ Xoldi þ 2 ' r ' Xoldi & Xbest
$ %
; ð16Þ
This can be applied to obtain new cuckoo solutions based on Eq.
(14) [28]. In Eq.(16), r indicates the random number picked from the Lèvy distribution, Xbest denotes the current best solution, Xoldi
represents an old solution, and Xnew
i demonstrates a newly
gener-ated solution.
The strength of the CS lies in the procedure to discard the wrong solution, so a fraction pa of solutions are ignored, and the updated solutions are obtained by
Xnew
i ¼ Xoldi þ rand1' randð 2> paÞ ' Xð a& XbÞ; ð17Þ
where Xnew
i is the new nest (solution), Xoldi is the old nest to be
neglected, rand1 and rand2 represent two random numbers drawn
from a uniform distribution, pa denote the probability of finding the nest, Xaand Xbare two randomly selected of the current nests[28].
2.4. Flower Pollination Algorithm (FPA)
Flower pollination algorithm (FPA) is inspired from the flower pollination process of plants that dictates the ultimate reproduc-tion. FPA is typically related to the pollen transfer by pollinators
[30]. Pollination is normally carried out in two modes: cross polli-nation(global search) and self pollination (local search), which are described in detail as follows[31]:
1. Cross pollination is referred to as the transfer of the pollen of flowers of different plants separated by a long distance by pol-linators that can fly a long distance (i.e. also known as global pollination)[31]. In the cross pollination, it is the pollinators that assure the pollination and proliferation of the optimal solu-tion g'. The initial rule may be formulated as
Xtþ1
i ¼ Xtiþ L Xti& g'
" #
; ð18Þ
where Xt
i represents the vector of a i solution at t iteration, g'
demonstrates the present best solution, and L describes the pol-lination strength that randomly pulled from the Lèvy distribution.
2. Self pollination is defined as the implantation of one flower from the pollen of the identical flower or different flowers of the identical plant, which usually happens when there is no pollina-tor available[32]. The local pollination and flower constancy are expressed as Xtþ1 i ¼ Xtiþ
!
Xtj& Xtk $ % ; ð19Þ where Xtj and Xtk demonstrate two random solutions, and
!
Since local pollination can be substantial, denoted by the fraction (p), in the aggregate pollination actions (in this study, it is assumed that p = 0.5). A switching probability p
!
½0; 1) controls the local and global pollination.2.5. Social Spider Optimization (SSO)
Social spider optimization (SSO) is a population-based algo-rithm and one of the swarm algoalgo-rithms recently proposed by Cue-vas et al.[33]. SSO algorithm is extracted from the social behaviour of the spider’s colony in nature. A SSO algorithm consists of two main components: social members and communal web. Social mem-bers are divided into male and female spiders. The social behaviour and cooperative interaction depend on the spider gender. The number of female spiders accounts for at least 65% of the total col-ony members. Female spiders present an attraction or dislike to other spiders according to their vibrations that are circulated through the communal web. More details on the SSO implementa-tion can be found in Refs.[34–36]. The SSO algorithm consists of the following steps:
1. Population initialization. The most important property of the SSO is the tendentious female population. The number of females Nf is randomly chosen within the range [65–90%], the
number of male spiders Nmis then calculated by
Nf ¼ floor 0:9 & rand ' 0:25½ð Þ % N); ð20Þ
Nm¼ N & Nf; ð21Þ
where floor[x] function gives the largest integer less than or equal to x.
Thence, the complete population S consists of N spiders, which is then splitted into two categories female (F) and male (M). The F group contains the female members F ¼ f1; f2; f3; . . . ; fNf
$ %
, whereas M group contains the male members
M ¼ m1; m2; m3; . . . ; mNm
ð Þ.
The female spider’s position fiand the male spider’s position mi
are randomly selected between the defined initial parameters (lower limit plowand upper limit phigh) as follows
ft
i;j¼ plowj þ rand ' phighj & plowj
$ %
; ð22Þ
mt
i;j¼ plowj þ rand ' phighj & plowj
$ %
; ð23Þ
where i, and j are the parameter and individual indexes respec-tively, rand is a random number generator between [0 and 1]. 2. Fitness evaluation. In the SSO algorithm, every spider
(individ-ual) has a weight withat defines the solution goodness, a fitness
value of any spider i is calculated as
wi¼J ssð Þ & si worst
best& sworst; ð24Þ
where J sð Þ represents the obtained fitness of the spider si i
posi-tion, the values of sworstand sbestdescribe the worst and the best
fitness values (minimization problem) as defined by
sbest¼ maxi!½1;2;...;N)ðJ sð Þi Þ; ð25Þ
sworst¼ mini!½1;2;...;N)ðJ sð Þi Þ; ð26Þ
3. Vibration modelling in the communal web. Vibration mod-elling is utilized to transfer the data between the colony members. The encoded waves rely on the weight and dis-tance of each spider[35].
4. Mating. It is a vital process to ensure the colony survival and allow the information exchange between all the members. Social spider mating is achieved between the dominant male and female members in the colony. However, the dominant male spider determines the location of one or several female members within a particularized range. Thereafter it mates with them to produce offspring[35].
2.6. Genetic Algorithm (GA)
Genetic algorithm (GA) mimics the natural evolution process of a population of initial solutions (individuals)[37]. Some individu-als undertake crossover and mutation operations to produce better individuals (offsprings) that become the next generation of the population. To determine which individuals should participate in the crossover and mutation, a selection process takes place to select the fittest individuals according to a predetermined fitness function[37].
The crossover operation randomly chooses pairs of these selected individuals to breed. The mutation of some individuals keeps diversity among the population. The larger the population size, the higher the probability to reach a better solution. However, evaluating the fitness of all individuals in a large population is very computer-intensive and needs tremendous computational resources.
2.7. Particle Swarm Optimization (PSO)
Particle swarm optimization (PSO) is one of the well-known swarm technique based on the movement and the social behaviour of birds within a flock. In PSO, each solution is considered as a par-ticle with specific characteristics (position, fitness, and a speed vector), which defines the motion of the particle[17]. PSO is widely used for optimization and feature selection. PSO uses a number of particles (N) that constitute a swarm moving in the search space, looking for the optimal solution [38]. In the PSO algorithm, the position of a particle is determined as[17]
Xtþ1
i;d ¼ Xti;dþ Vtþ1i;d ; ð27Þ
where X is the particle position vector, V is the particle velocity vec-tor, i is the index of a particle, t is the time or iteration counter, d is the dimension, Xt
i;dis the position of particle i at iteration t in the d
dimension, Xtþ1
i;d is the new position of particle i at iteration t þ 1 in
the d dimension, Vtþ1
i;d is the velocity of particle i at iteration t þ 1 in
the d dimension and is given as
Vtþ1
i;d ¼ w ' Vti;dþ c1' randt1 pbestti;d& Xti;d
$ %
þ c2' randt2 gbesttd& Xti;d
$ %
; ð28Þ
where w is the inertia weight factor, gbestt
d is the most optimist
position of the swarm at time t along dimension d; c1 and c2 are parameters representing loyalty and selfishness of particles. Nor-mally, c1 = c2 =2, while randt
1and randt2are random numbers
dis-tributed uniformly over [0, 1]. 2.8. Artificial Neural Network (ANN)
Artificial neural networks (ANN) are regarded as generalizations of mathematical models of biological nervous systems. In ANN, the effects of the synapses are described by weighted connections that modulate the effect of the associated input signals, and a transfer function that represents the non-linear characteristic exhibited by neurons. The neuron impulse is then determined as the
weighted sum of the input signals transformed by the transfer function[39].
The learning ability of ANN is performed by adapting the weights using the chosen learning algorithm. The behaviour of the neural network depends mainly on the interaction between the different neurons. The basic architecture consists of three types of neuron layers: input, hidden, and output [40]. Various ANN architectures can be created according to the characteristics and specification of the applications [41]. The feed-forward ANN is one of the commonly used architectures, in which the signal flow is from input to output units strictly in a feed-forward direction and the data is processed over multiple units without feedback connections.
3. The computational intelligence model
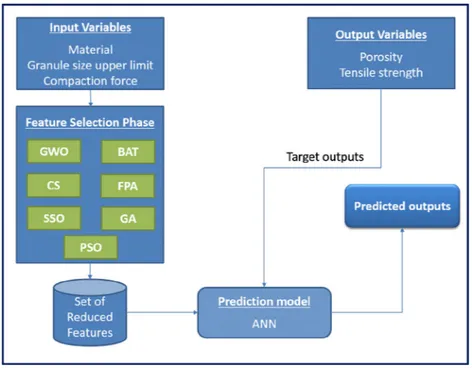
In this study, the artificial neural network (ANN) is used as a regression model to evaluate the final prediction performance, while seven bio-inspired optimization algorithms (GWO, BAT, CS, FPA, SSO, GA, and PSO) described above are incorporated in the ANN for feature selection, as illustrated inFig. 1. The proposed optimization algorithms for feature selection work in a wrapper-based manner. The central point of the wrapper methods is the use of ANN as regression to ensure the quality of selected features during the feature selection process.
Each optimization algorithm is run for 20 times to test the con-vergence capability. The performance of the optimization algo-rithms are evaluated using the following indicators:
1. Average feature reduction (R') defines the mean size of the
reduced features to the aggregate amount of features as follows
R'¼ 1 &size gi' " # Nt & ' , 100; ð29Þ where gi
'is the best solution that obtained in the i & th
applica-tion of the algorithm, Ntrepresents the total number of features
in a given dataset. For example, the dataset used in this study
has 3 features, i.e. Nt= 3, and if the best solution selects 2
fea-tures, then R'= 1 &2 3
" #
' 100 ¼ 33:3.
2. Mean square error (MSE) measures the average of squared errors between the actual output and predicted ones and is given as
MSE ¼ Pn
i¼1ðPi& OiÞ2
n ; ð30Þ
where Oiand Piare the observed and predicted values
respec-tively, n is the total number of samples, and i denotes the i & th number of sample in dataset.
3. Standard deviation (Std) measures how much the sets differ from the mean value. Std represents the optimizer convergence to the same optimal and ensures repeatability of the results
[42].
A generic representation of the fitness function assessing both regression performance and feature reduction is also introduced as
fh¼
a
' E þ 1 &ða
Þ Pihi
N ; ð31Þ
where fh is the fitness function of a vector h with N elements of value 0 or 1, representing unselected or selected features, E is the prediction error, and
a
is a constant controlling the importance of regression performance to the number of features selected and bal-ancing the trade-off between exploration and exploitation. Nor-mally, at the beginning of optimization (a
) has its maximum value to allow for maximum exploration, while, at the end of opti-mization, it has the minimum value for more exploitation of search space.Each bio-inspired algorithm is initialized using n random agents (solutions) with each agent representing a given selected feature combination. Then each algorithm is iteratively applied for a number of iterations aiming to converge to a good solution. The individual solution is represented as a continuously valued vector with the same dimension as a number of attributes in the given dataset. The solution vector values are normalised so that their values are in the range [0, 1]. For the solution fitness function evaluation, these solutions are converted to their binary representations by
yij¼
0 "xij<0:5#
1 "xij>¼ 0:5#
(
ð32Þ
where xijis the continuous value of the solution number i in
dimen-sion j, and yijis the discrete representation of solution vector x.
4. Experimental
This study focuses on powder compaction, a typical manufac-turing process used for a wide range of products, such as pharma-ceutical tablets and catalyst pellets. A variety of widely used pharmaceutical excipients [43] are considered, including micro-crystalline cellulose of different grades: Avicel 101, Avicel PH-102 and DG (FMC, Biopolymer, USA); (Pearlitol 200 SD, Roquette, UK), and Lactose (Granulac 140, Meggle GmbH, Germany). More-over, binary mixtures of MCC 102 and lactose with various mass fractions are also produced using a mixer (TURBULA T2F, Wab, UK). In total, three binary mixtures (seeTable 1), named mixture 1, 2 and 3, based on their compositions are considered, for which the mass fractions of MCC 102 are 25%, 50% and 75%, respectively. The samples were mixed for 15 min at a consistent speed of 34 min-1.
Furthermore, dry granulation using roll compaction is per-formed to produce granules from feed powders and their mixtures. Ribbons are produced using a custom-made gravity fed roll com-pactor with a roll gap of 1.2 mm and roll speed of 1 rpm (for which, two smooth rolls of 200 mm in diameter and 46 mm in width are used), and are then milled using a cutting mill (SM 100, Retsch, Germany) at a speed of 1500 rpm, for which a screen size of 4 mm is used. The produced granules are then sieved using a sieving tower into different granule size classes (0–90, 90–250, 250–500, 500–1000, 1000–1400, 1400–2360 m), for which the upper size limit is used to represent the granular size.
The feed powders, their mixture and granules are then com-pressed at various compression pressures to produce tablets of var-ious porosities, for which the corresponding tensile strengths are measured. Cylindrical tablets are produced with an Instron univer-sal testing machine equiped with a 30 kN load cell. A die of 11.28 mm of diameter is used. A powder mass of 300 5 mg is manually poured into the die and compressed to different maximum pres-sures at the room temperature (23!C, 45 ± 2% RH) and a com-paction speed of 5 mm/min. Diametrical compression tests on the produced tablets are performed using a diametric strength tes-ter (Erweka TBH30, Erweka Gmbh, Germany), in which the crush-ing load is determined. The tablet tensile strength (
r
t) is thencalculated according to[44]
r
t¼p
2 ' F' D ' H; ð33Þ
where F is the maximum load required to break the tablet, D and H are the tablet diameter and height, respectively. All experiments are run in triplicate.
5. Results and discussion 5.1. Dataset generation
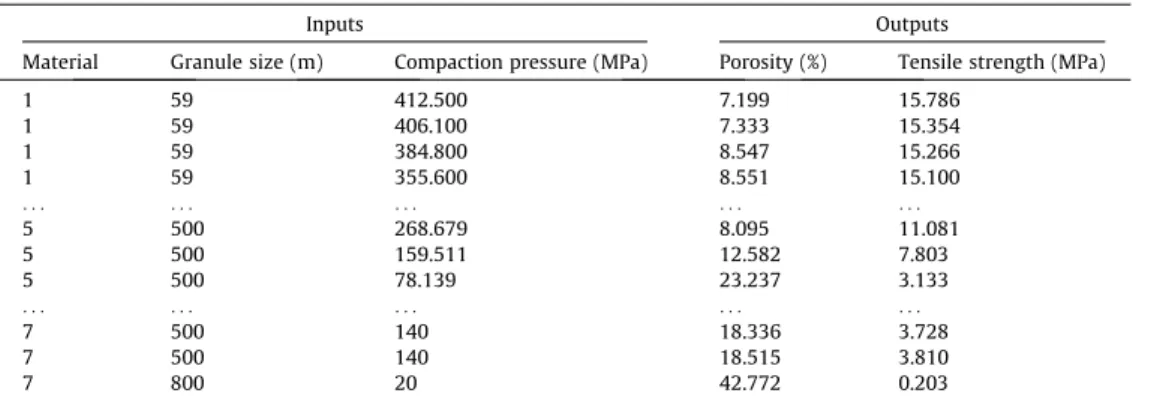
A large dataset (see supplement) is then created using the material, particle/granule size and compaction pressure as the inputs (i.e. 3 inputs), while the porosity and the tensile strength of the produced tablets as independent outputs (i.e. 2 outputs), as exemplified in Table 1. It is worth noting that the tensile
Table 1
Example of dataset generated for the model.
Inputs Outputs
Material Granule size (m) Compaction pressure (MPa) Porosity (%) Tensile strength (MPa)
1 59 412.500 7.199 15.786 1 59 406.100 7.333 15.354 1 59 384.800 8.547 15.266 1 59 355.600 8.551 15.100 . . . . 5 500 268.679 8.095 11.081 5 500 159.511 12.582 7.803 5 500 78.139 23.237 3.133 . . . . 7 500 140 18.336 3.728 7 500 140 18.515 3.810 7 800 20 42.772 0.203
Fig. 2. Average MSE for porosity.
strength and tablet porosity are generally inter-related (e.g. the lower the porosity, the higher the tensile strength) for tablets made of feed powders and their mixtures. However, this inter-relationship does not necessarily hold for roll-compacted granules, as discussed in the Introduction section. Hence these two tablet properties are treated as independent outputs in this study in order to explore if the CI models can identify these behaviours from the data produced with both feed powders and granules.
The legend used to identify the different materials for the CI model is specified as follows:
- Material 1 = MCC PH 101 powder. - Material 2 = MCC PH 102 powder. - Material 3 = MCC DG powder.
- Material 4 = Mannitol Pearlitol 200 SD powder. - Material 5 = MCC PH 101 Granules.
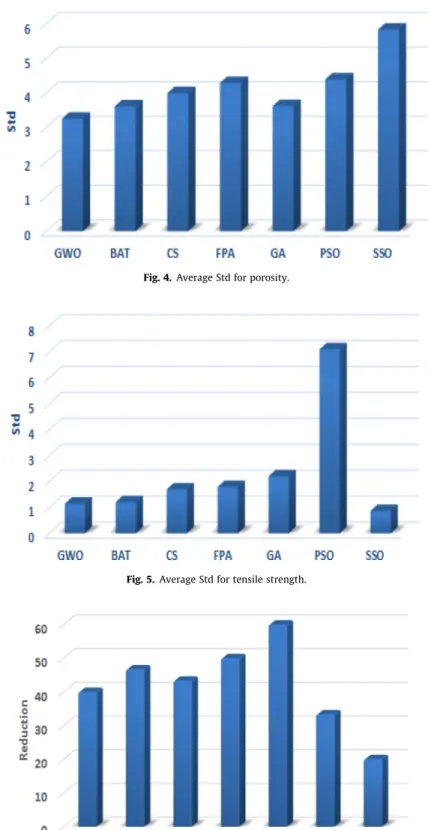
Fig. 4. Average Std for porosity.
Fig. 5. Average Std for tensile strength.
- Material 6 = Binary mixture: 75% MCC102 + 25% Lactose. - Material 7 = Granules binary mixture 75% MCC102 + 25%
Lactose.
- Material 8 = Binary mixture: 50% MCC102 + 50% Lactose. - Material 9 = Granules binary mixture 50% MCC102 + 50%
Lactose.
- Material 10 = Binary mixture: 25% MCC102 + 75% Lactose. - Material 11 = Granules binary mixture 25% MCC102 + 75% Lactose.
5.2. Model construction
Two-thirds of the dataset are randomly chosen to train the mod-els (training set) and the remaining part (testing set) is used to test the model prediction. The training set is used to evaluate the ANN
throughout the optimization process with the bio-inspired algo-rithms and used in the prediction model. The testing data is kept hid-den from the optimization and only used during the prediction process. The optimisation process is run 20 times with each algo-rithm in order to get an average performance for the prediction error and accurately assess statistical evaluation indicators. The bio-inspired optimization algorithms are used for feature selection, so that only the most significant features are fed into the ANN.
In the CI model, ANN is used for the regression purpose (predic-tion of a continuous output), and two approaches are created:
1. A model is used to evaluate all the possible solutions during the bio-inspired feature selection process (i.e. this ANN regression model is used to ensure the goodness of the selected features).
At this stage, ANN is utilised for the bio-inspired optimization algorithm to reach the optimal solution (best-selected features). 2. A predictive model is established for the testing data using the selected features. At this stage, the model is built using the inputs selected by the bio-inspired optimization algorithm as the train set.
5.3. Model prediction
The results presented in Figs. 2 and 3 show the MSE values using each optimizer for 20 different runs, whileFig. 6shows the average feature reduction of the two outputs. It can be seen that the GWO algorithm was the most accurate in predicting porosity,
while the SSO algorithm achieved the most accurate prediction for the tensile strength. In addition, the GA algorithm led to the highest reduction of features - 60% - with an average MSE of 7.2 for predicting porosity and 5.1 for predicting tensile strength.
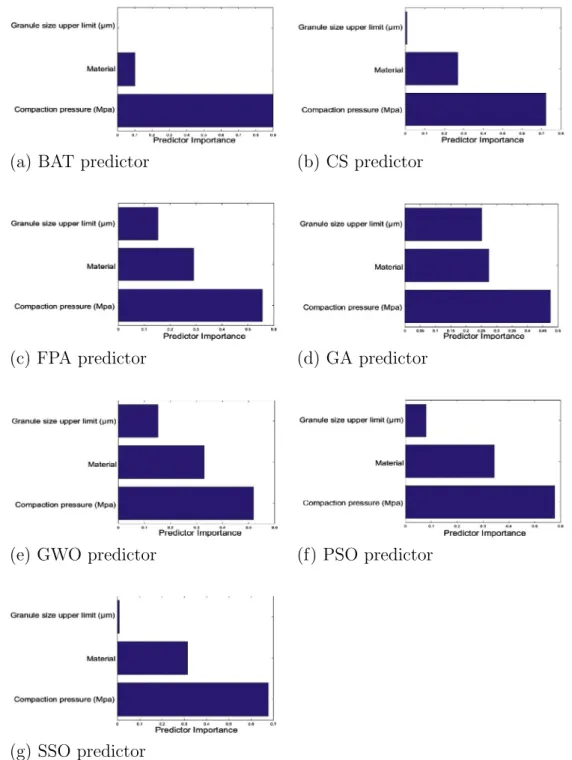
Figs. 4 and 5show the standard deviation values obtained by all the bio-inspired algorithms. The minimum value of the std mea-sure is obtained by GWO for the porosity as shown inFig. 4and obtained by SSO for the tensile strength as shown inFig. 5. Further-more, it is clear that the GWO and SSO algorithms have in general standard deviation (std) less than the ones obtained from the GA and PSO algorithms, which indicates the capability of GWO and SSO to converge to optimal or near-optimal solutions. InFigs. 7 and 8, the majority (9 from 14) of the seven bio-inspired
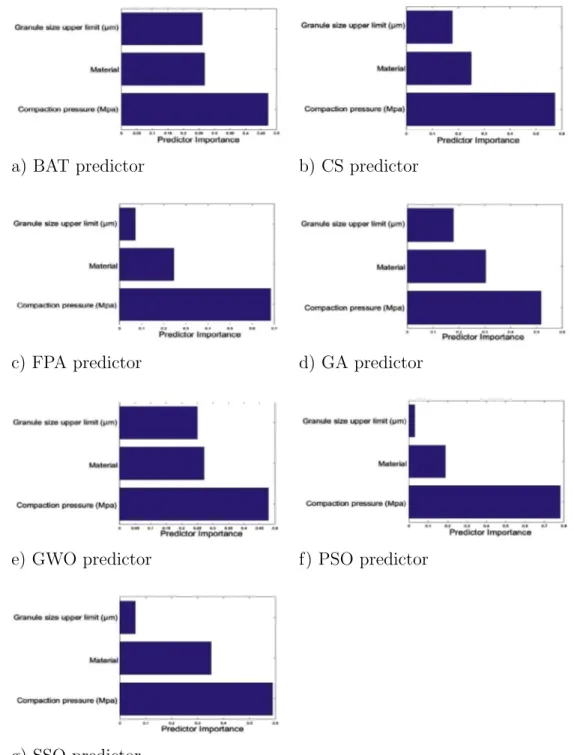
algorithms identify the compaction pressure as the most impor-tance input for both porosity and tensile strength as shown in
Figs. 7 and 8.
Overall, it can be concluded that the GWO algorithm obtains the best compromise between MSE, the standard deviation, and fea-ture reduction for predicting both the porosity and the tensile strength. Each optimizer is run for 20 different runs to ensure con-vergence capability.
The leader selection for a given swarm has a very great impact on the explorative/exploitative ability of each optimizer. The GWO optimizer keeps track of the best three solutions found, but the SSO optimizer has track of the N best solutions found. Therefore, the GWO and SSO bio-inspired algorithms perform differently on the same dataset. GWO performs better in predicting porosity in some
runs and SSO performs better in predicting porosity in other runs. But over the 20 runs, the average performance of the GWO algo-rithm was the most accurate in predicting porosity and the average performance of the SSO algorithm achieved the most accurate pre-diction for the tensile strength. The different performances of the various bio-inspired optimization algorithms are primarily due to the intrisic nature in modelling, as detailed in the recent publica-tions[45–52,23,53].
5.4. Model prediction
Fig. 7shows the comparison between the experimental results and predicted results from the SSO model. This model was chosen here for demonstration because it is the most accurate algorithm
Fig. 9. Comparison of experimental and predicted data obtained with the SSO algorithm for different materials.
Fig. 10. Comparison of experimental and predicted tensile strength obtained with the GWO algorithm for all materials considered.
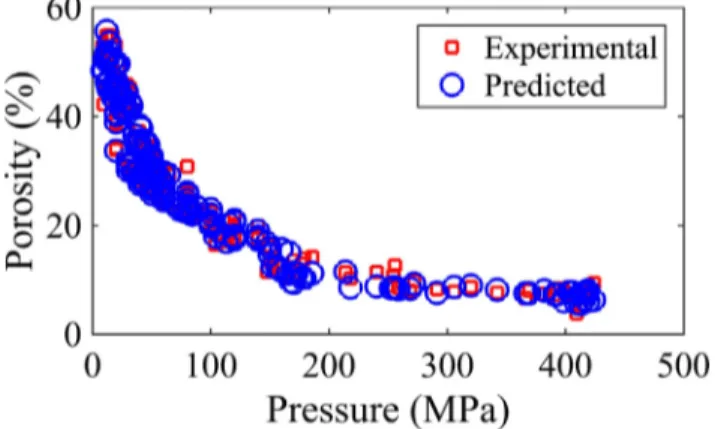
Fig. 11. Comparison of experimental and predicted porosity obtained with the GWO algorithm for all materials considered.
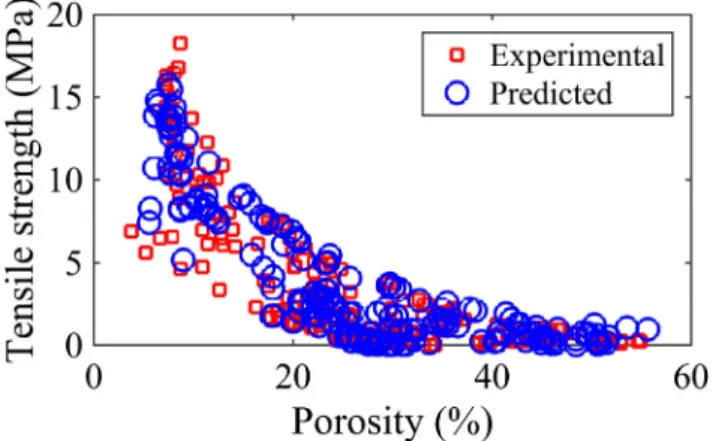
for prediction of tensile strength with an average MSE (1.375) and average reduction (20%). More specifically,Fig. 7presents the ten-sile strength of the tablets as a function of compaction pressure for pure powder (a), Granules (b) and mixtures (c). It is shown that there is an increase in tensile strength with the increase of com-paction pressure for all the materials and granules sizes investi-gated. Moreover, the prediction for pure powders as MCC PH 101 (Fig. 9a) and mixtures (Fig. 9c) are generally more accurate than the granule tensile strength predictions (Fig. 9b) where more scat-tered results were observed. Similarly,Figs. 10–12show the com-parison between compaction experimental results and prediction using the GWO due to its highest accuracy (MSE of 4.832) for porosity prediction as discussed in the previous section (5.2). There is an almost exponential decrease of porosity with the increase of compaction pressure. Interestingly, the GWO gives almost identical values to the measured ones for all the materials with no distinc-tion between pure powders (Fig. 10), mixtures (Fig. 11) or granules (Fig. 12). This proves that the GWO model can predict the tablet porosity during powder compaction for a wide range of materials with high accuracy.
6. Conclusions
The robustness of CI models that integrate artificial neural net-work (ANN) with bio-inspired feature selection algorithms for pre-dicting tablet manufacturing processes was evaluated. In particular, tablet properties such as porosity and tensile strength were predicted based upon powder characteristics. Seven bio-inspired optimization algorithms for feature selection were applied. The modelling efficiency was evaluated in terms of the average feature reduction and mean square error. It was found that the GWO algorithm was the most accurate in predicting porosity with equal accuracy for pure powders, mixtures, and granules, while the most accurate prediction of the tensile strength can be achieved using the SSO algorithm, in particular, the values for pure powders and mixtures were more accurately predicted than the granule tensile strength. Regarding the average feature reduction, GA obtained the highest reduction for predicting both the porosity and the tensile strength outputs, and could be more useful for identification of key features or the critical material attributes. Moreover, it was shown from the results obtained with various optimisation algorithms that the most significant feature is the compaction pressure for both tensile strength and porosity, which is in broad agreement with the experimental observations reported in the literature.
Acknowledgment
This work was supported by the IPROCOM Marie Curie initial training network, funded through the People Programme (Marie Curie Actions) of the European Union’s Seventh Framework Pro-gramme FP7/2007-2013/under REA grant agreement No. 316555.
Appendix A. Supplementary material
Supplementary data associated with this article can be found, in the online version, athttps://doi.org/10.1016/j.apt.2018.11.008.
References
[1]S. Schiano, L. Chen, C.-Y. Wu, The effect of dry granulation on flow behaviour of pharmaceutical powders during die filling, Powder Technol. 337 (2018) 78–83. [2]L. Perez-Gandarillas, A. Mazor, O. Lecoq, A. Michrafy, Compaction properties of dry granulated powders based on Drucker–Prager Cap model, Powder Technol. 337 (2018) 43–50.
[3]K. Csordas, P. Kleinebudde, Evaluation of the performance of different types of roll compactors, Powder Technol. 337 (2018) 84–91.
[4]O. Coube, A.C.F. Cocks, C.Y. Wu, Experimental and numerical study of die filling, powder transfer and die compaction, Powder Metall. 48 (2005) 68–75. [5]V.K. Ojha, S. Schiano, C.Y. Wu, V. Snasel, A. Abraham, Predictive modeling of die filling of the pharmaceutical granules using the flexible neural tree, Neural Comput. Appl. (2016) 1–15.
[6]M.G. Herting, P. Kleinebudde, Studies on the reduction of tensile strength of tablets after roll compaction/dry granulation, Eur. J. Pharm. Biopharm. 70 (1) (2008) 372–379.
[7]A. Patel, S. MacMahon, J. Chalmers, B. Neal, et al., Intensive blood glucose control and vascular outcomes in patients with type 2 diabetes, New Engl. J. Med. 358 (24) (2008) 2560–2572.
[8]S. Malkowska, K.A. Khan, Effect of re-compression on the properties of tablets prepared by dry granulation, Drug Dev. Ind. Pharm. 9 (3) (1983) 331–347. [9]C.C. Sun, M.W. Himmelspach, Reduced tabletability of roller compacted
granules as a result of granule size enlargement, J. Pharm. Sci. 95 (1) (2006) 200–206.
[10]Y. Chen, D. Miao, R. Wang, A rough set approach to feature selection based on ant colony optimization, Pattern Recogn. Lett. 31 (2010) 226–233.
[11]B. Chizi, L. Rokach, O. Maimon, A survey of feature selection techniques, IGI Global (2009) 1888–1895.
[12]G. Chandrashekar, F. Sahin, A survey on feature selection methods, Comput. Electr. Eng. 40 (1) (2014) 16–28.
[13]M. Dash, H. Liu, Feature selection for classification, Intell. Data Anal. 1 (3) (1997) 131–156.
[14]L.Y. Chuang, S.W. Tsai, C.H. Yang, Improved binary particle swarm optimization using catfish effect for attribute selection, Expert Syst. Appl. 38 (2011) 12699–12707.
[15]R. Akbari, A. Mohammadi, K. Ziarati, A novel bee swarm optimization algorithm for numerical function optimization, Commun. Nonlinear Sci. Numer. Simul. (2010) 3142–3155.
[16]A.E. Eiben, P.E. Raue, Z. Ruttkay, Genetic algorithms with multi-parent recombination, in: PPSN III: Proceedings of the International Conference on Evolutionary Computation, Third Conference on Parallel Problem Solving from Nature, 1994, pp. 78–87.
[17]R.C. Eberhart, J. Kennedy, A new optimizer using particle swarm theory, in: Proceeding of the Sixth International Symposium on Micro Machine and Human Science, Nagoya, Japan, 1995, pp. 39–43.
[18]D. Karaboga, B. Basturk, A powerful and efficient algorithm for numerical function optimization: artificial bee colony (ABC) algorithm, J. Global Optim. 39 (3) (2007) 459–471.
[19]X.S. Yang, Engineering Optimizations via Nature-inspired Virtual bee Algorithms, Lecture Notes in Computer Science, Springer, 2005.
[20]K. Sundareswaran, V.T. Sreedevi, Development of novel optimization procedure based on honey bee foraging behavior, IEEE Inte. Conf. Syst. Man Cybernet. (2008) 1220–1225.
[21]X.L. Li, Z.J. Shao, J.X. Qian, An optimizing method based on autonomous animates: fish-swarm algorithm, Methods Pract. Syst. Eng. (2002) 32–38. [22]S.A. Mirjalili, S.M. Mirjalili, A. Lewis, Grey wolf optimizer, Adv. Eng. Softw. 69
(2014) 46–61.
[23] H.M. Zawbaa, E. Emary, C. Grosan, V. Snasel, Large-dimensionality small-instance set feature selection: a hybrid bioinspired heuristic approach, Swarm Evol. Comput. (2018),https://doi.org/10.1016/j.swevo.2018.02.021. [24]X.S. Yang, A new metaheuristic bat-inspired algorithm, nature inspired
cooperative strategies for optimization (NISCO), in: J.R. Gonzalez et al. (Eds.), Studies in Computational Intelligence, vol. 284, Springer, 2010, pp. 65–74. [25]A.H. Gandomi, X.S. Yang, A.H. Alavi, S. Talatahari, Bat algorithm for constrained
optimization tasks, Neural Comput. Appl. (2012) 1–17.
[26]X.S. Yang, Review of meta-heuristics and generalised evolutionary walk algorithm, Int. J. Bio-Inspired Comput. 3 (2) (2011) 77–84.
Fig. 12. Comparison of experimental and predicted data on the variation of tensile strength with porosity obtained with the GWO algorithm for all materials considered.
[27]P.W. Tsai, J.S. Pan, B.Y. Liao, M.J. Tsai, V. Istanda, Bat algorithm inspired algorithm for solving numerical optimization problems, Appl. Mech. Mater. 148 (2012) 134–137.
[28]X.S. Yang, S. Deb, Cuckoo search via Levy flight, in: Proceeding of World Congress on Nature and Biologically Inspired Computing (NaBIC), India, 2009, pp. 210–214.
[29]C.T. Brown, L.S. Liebovitch, R. Glendon, Levy flights in Dobe Ju’hoansi foraging patterns, Hum. Ecol. 35 (1) (2007) 129–138.
[30]X.S. Yang, Flower pollination algorithm for global optimization, in: Unconventional Computation and Natural Computation, Lecture Notes in Computer Science, vol. 7445, 2012, pp. 240–249.
[31]X.S. Yang, M. karamanoglu, X. He, Multi-objective flower algorithm for optimization, Int. Conf. Comput. Sci. Procedia Comput. Sci. 18 (2013) 861–868. [32]I. Pavlyukevich, Levy flights, non-local search and simulated annealing,
Comput. Phys. 226 (2007) 1830–1844.
[33]E. Cuevas, M. Cienfuegos, D. Zaldvar, M. Prez-Cisneros, A swarm optimization algorithm inspired in the behavior of the social-spider, Expert Syst. Appl. 40 (16) (2013) 6374–6384.
[34]A. Pasquet, Cooperation and prey capture efficiency in a social spider, Anelosimus eximius(Araneae, Theridiidae), Ethology 90 (2) (1991) 121–133. [35]T. Jones, S. Riechert, Patterns of reproductive success associated with social
structure and microclimate in a spider system, Anim. Behav. 76 (6) (2008) 2011–2019.
[36]H.M. Zawbaa, E. Emary, A.E. Hassanien, B. Parv, A wrapper approach for feature selection based on swarm optimization algorithm inspired in the behavior of the social-spider, in: 7th International Conference on Soft Computing and Pattern Recognition, 2015.
[37]J. Holland, Adaptation in Natural and Artificial Systems, University of Michigan Press, Ann Arbor, MI, 1975.
[38]Q. Bai, Analysis of particle swarm optimization algorithm, Comput. Inform. Sci. 3 (1) (2010) 180–184.
[39]B. Yu, D.H. Zhu, Automatic thesaurus construction for spam filtering using revised: back propagation neural network, Expert Syst. Appl. 37 (1) (2010) 24– 30.
[40] D.S. Huang, A constructive approach for finding arbitrary roots of polynomials by neural networks, IEEE Trans. Neural Netw. 15 (2) (2004) 477–491. [41]C.M. Bishop, Neural Networks for Pattern Recognition, Oxford University Press,
1995.
[42]L. Jia, W. Gong, H. Wu, An Improved Self-adaptive control parameter of differential evolution for global optimization, Comput. Intell. Intell. Syst. 51 (2009) 215–224.
[43]J.D. Prigge, K. Sommer, Numerical investigation of stress distribution during die compaction of food powders, Part. Sci. Technol. 29 (2011) 40–52. [44]J.T. Fell, J.M. Newton, Determination of tablet strength by the diametric
compression test, J. Pharm. Sci. 59 (1970) 688–691.
[45]E. Emary, H.M. Zawbaa, A.E. Hassanien, Binary grey wolf optimization approaches for feature selection, Neurocomputing 172 (2016) 371–381. [46]E. Emary, H.M. Zawbaa, A.E. Hassanien, Binary ant lion approaches for feature
selection, Neurocomputing 213 (2016) 54–65.
[47]E. Emary, H.M. Zawbaa, C. Grosan, Experienced grey wolf optimizer through reinforcement learning and neural networks, IEEE Trans. Neural Netw. Learn. Syst. (TNNLS) 29 (3) (2018) 681–694.
[48]E. Emary, H.M. Zawbaa, Impact of chaos functions on modern swarm optimizers, PLoS ONE 11 (7) (2016) e0158738.
[49]H.M. Zawbaa, J. Szle!k, C. Grosan, R. Jachowicz, A. Mendyk, Computational intelligence modeling of the macromolecules release from PLGA microspheres-focus on feature selection, PLoS ONE 11 (6) (2016) e0157610. [50] E. Emary, H.M. Zawbaa, A.E. Hassanien, B. PARV, Multi-objective retinal vessel
localization using flower pollination search algorithm with pattern search, Adv. Data Anal. Classif. 11 (3) (2017) 611–627.
[51]H.M. Zawbaa, E. Emary, C. Grosan, Feature selection via chaotic antlion optimization, PLoS ONE 11 (3) (2016) e0150652.
[52]E. Emary, H.M. Zawbaa, C. Grosan, Experienced grey wolf optimizer through reinforcement learning and neural networks, IEEE Trans. Neural Netw. Learn. Syst. (TNNLS) 29 (3) (2018) 681–694.
[53]E. Emary, H.M. Zawbaa, Feature selection via Lèvy Antlion optimization, Pattern Anal. Appl. (PAAA) (2018).