ÉCOLE DE TECHNOLOGIE SUPÉRIEURE UNIVERSITÉ DU QUÉBEC
THESIS PRESENTED TO
ÉCOLE DE TECHNOLOGIE SUPÉRIEURE
IN PARTIAL FULFILLMENT OF THE REQUIREMENTS FOR THE DEGREE OF DOCTOR OF PHILOSOPHY
Ph. D.
BY
Abbasali SABOKTAKIN RIZI
INTEGRITY ASSESSMENT OF PREFORMS AND THICK TEXTILE REINFORCED COMPOSITES FOR AEROSPACE APPLICATIONS
MONTRÉAL, DECEMBER 20, 2013
This Creative Commons licence allows readers to dowload this work and share it with others as long as the author is credited. The content of this work can’t be modified in any way or used commercially.
BOARD OF EXAMINERS (THESIS PH.D.) THIS THESIS HAS BEEN EVALUATED BY THE FOLLOWING BOARD OF EXAMINERS
Prof. Toan Vu-Khanh, Thesis adviser
Dept. of mechanical engineering, École de technologie supérieure
Prof. Simon Joncas, Committee President
Dept. of automated manufacturing engineering, École de technologie supérieure
Prof. François Robitaille, External Examiner
Dept. of mechanical engineering, University of Ottawa
Prof. Martin Viens, Examiner
Dept. of mechanical engineering, École de technologie supérieure
Prof. Minh-Tan Ton-That, Independent Examiner
Dept. Mechanical & Industrial Engineering, Concordia University
THIS THESIS WAS PRENSENTED AND DEFENDED
IN THE PRESENCE OF A BOARD OF EXAMINERS AND PUBLIC ON NOVEMBER 01, 2013
FOREWORD
This thesis is dedicated to people who taught me how to live, how to research.
To
My parents and grandfather-Mohammadmorad Saboktakin Rizi and
Professor Toan Vu-Khanh
for his three decades of strong research activities and
Professor Mahmoud Farzin (Isfahan University of Technology)
In the memory of
Hossein-ali Ghojehi-Rizi (July 7, 1958 – May 6, 1982),
Professor Mahmoud Hessaby (Feb 23, 1903 – Sep 3, 1992) and
ACKNOWLEDGMENTS
First of all, I am tremendously thankful to my adviser Prof. Toan Vu-Khanh for his great supervision. Without his guidance and help this thesis would not have been possible. I am very grateful to my Co-adviser Dr. Nguyen Tri Phuong for his continuous support, guidance and encouragement during my research. I would like to thank my committee chair and members: Prof. Simon Joncas (ETS), Prof. Martin Viens (ETS), Prof. Minh-Tan Ton-That (Concordia Univ.) and Prof. François Robitaille (Ottawa Univ.). Furthermore, special thanks go to the following people: Faculty professors and industry experts including Jesse Garant (Jgarantmc), Fabio Visentin (Jgarantmc), Andrew J. Good (Jgarantmc), Yoann Bonnofen (Composite BHS), Léna Swennen (Composite BHS), J. Haines (Composite BHS), Prof. Stephen Tsai (Stanford Univ.), Dr. Hychem Boukehili, Prof. Nico Declercq (Gatech), Prof. Xavier Maldague (Laval Univ.), Dr. Steven M. Shepard (Thermalwave), Dr. Andre Cocquyt (Grpguru), Dr. Jonathan H. Gosse (Boeing), Prof. Mahmoud Farzin (IUT), Dr. Giuseppe Dell'Anno (Cranfield Univ.), Andreas Hänsch (Trans-Textil GmbH), Dr. Keith Sharp (3TEX), Prof. Peter Middendorf (Stuttgart Univ.), Prof. Roberto Palazzetti (Bologna Univ.), Prof. S. Arivalagan (Dr M.G.R. Univ.), Prof. Karlis Rocens (Riga Tech Univ.), Prof. Alberto Milazzo (Palermo Univ.), Prof. Zauner Gerald (Applied Science Univ.), Dr. P. Palanichamy (Igar), Prof. Jozef Bicerano (Polymerexpert), Prof. Carosena Meola (Bologna Univ.), Prof. Krutikova Lyudmila (Yandex), David.Stresing (Saint-gobain), Steven Kidd (themixplastics), Prof. Carl Zweben (AIAA), Dirk Dusharme (Qualitydigest), Prof. Alberto Milazzo (Palermo Univ.), Davide Micheli (Roma Univ.), Dr. Z. Naeimi (Iasbs), Gangadhara Prusty (NSW Univ.), Piaras Kelly (Auckland Univ.), Prof. Manfred Staat (Aachen Univ.), Christoph Greb (Aachen Univ.), Dr. Hossein Monajati (ETS), Prof. Mohd Rozi Ahmad (Teknologi MARA Univ.), Dr. Olivier Vermeersch (CCTG), Herb Armstrong (EEMS), Lary Etheringt (Eclipse), Prof. Antoine Tahan (ETS), Prof. Gerd Dobmann (Fraunhofer), Minder Christian (Tissa), Dr. Clemente Ibarra Castanedo (Laval Univ.), Aldjia Begriche (CCTG), Prof. Anh D. Ngo (ETS), Prof. Mohammad Jahazi (ETS), Dr. Patricia Dolez (CTTG), Dr. Aidin Delnavaz (ETS) and Heather Uva (TFP), Dr. Carlos Arrieta (ETS), Andre Goyette (ETS) and Technical Staff including Radu Romanesque, Jonathan Levesque, Serge
Plamondon, Mario Corbin, Jean-Guy Gagnon, Hugo Landry and Claude Legault. Last but not least, I am so grateful to my best friends: Saeid Hedaytresa, Mohammad Sleiman, Hamid Habibzadeh, Monzer Daoud, Daniel Fernández, Ali Niknam, Saad-amine Taki, Mahmoud Ghanbari, Mehdi Saboori, Laurent Cormier, Cesar Augusto, Amir ghazi Saeedi, Husain Dibajian, Ehsan Rezaie, Hamid Javani, Sergey Dubinskiy, Hamed Saghafi, Hani Bakhshai, Mohsen Adibi, Mohammad M. Safaei, Louis A. Généreux, Ennouri Triki, Ludwig Vinches, Rachid El Aidani, Marc Grenier, Matthieu Klein, Vahab Akbarzadeh, Pierre-luc Vachon, Adel Ziadi, Wael Ben Larbi, Masoud Jandaghian, Kaveh Azizian, Mohammadreza Motamedi, Behrang Majedi, Yousef Babazadeh, Vahid Sabri, Hani Vahedi, Ahmad Khani, Amèvi Tongne, Majid Rafiei, Nader Aghaesmaeili, Guillermo Quesada, Mojtaba Ghaderi, Esmaeil Arabzadeh, Saeid Jafari, Ali Moazzam, Hossein Safaei, Ehsan Arabnejad and Bouchaib Zazoum.
Finally, I would like to express my sincere appreciation to my family for their endless love and support.
INTEGRITY ASSESSMENT OF PREFORMS AND THICK TEXTILE REINFORCED COMPOSITES FOR AEROSPACE APPLICATIONS
Abbbasali SABOKTAKIN RIZI
ABSTRACT
Three-dimensional (3D) textile composites containing in-plane fibers and fibers oriented in the thickness direction offer some advantages over two-dimensional (2D) textile composites. These advantages include high delamination resistance and improved damage tolerance. Textile composites containing 3D textile preforms have mostly been developed by the aerospace industry for structural applications such as wing panels, landing gear, rocket nozzles, and the Orion capsule, and so forth.
This thesis is devoted to structural integrity assessment of textile composites including 2D and 3D tufted composites by combining destructive and non-destructive techniques. In the first part of the thesis, non-destructive techniques including X-ray computed tomography (CT) and ultrasound-based techniques (UT) were used to detect two significant process-induced defects called fiber breakage and fabric misalignment. The second part focuses on studying of the influence of manufacturing defects introduced during the tufting process on the mechanical properties.
Experimental results proved that X-ray CT facilitates the characterization of those two manufacturing defects as well as the architecture of the textile fabrics. Furthermore, meso-scale modeling of a 2D woven composite was successfully performed for the analysis of the fiber breakage defect influence and fiber architecture on wave propagation.
Experimental results prove that tufting the preform assists in locking and restricting the yarn's movement in the preform. The threads used for tufting have a major influence on tensile strength, as stronger threads may give higher resistance. Tufting increases the compaction force due locking of fiber bundles, therefore, a higher compaction force is needed to obtain a fiber volume of up to 50 percent in comparison to an untufted preform. The drape behaviour of a tufted preform is influenced by tufting so that high drapability is observed for a tufted preform along with local variation of fiber bundle occurred around tufting reinforcements. The variation of preform geometry was achieved by laser scanning.
Furthermore, the CT capability was investigated as a means for recognizing the shapes and locations of voids in composites.
Tufted composites with transverse tufting suffer less reduction in the tensile strength than those with longitudinal tufting. Tufted composites are found to have lower fatigue life ithan untufted composites, while an improved compressive strength and tensile strength at high strain rate are observed.
Tufting improves the mechanical properties of tufted honeycomb composites under local compression and bending loadings. Mostly, the damage initiates from resin-rich regions around the tufting reinforcements.
The acceptance of 3D tufted composites for use in primary aerospace structures is highly dependent on the accuracy and reliability of experimental data to recognize the degree to which tufting reinforcements improve or degrade the mechanical properties. In this thesis, the correlation between the tufted preforms and composite properties and the changes to mechanical properties is discussed for a specific tufting configuration. Experimental data are reported on both the low-rate and high-rate static and fatigue strengths at various stress levels. Microstructural examination is carried out by using the high resolution microscopy and CT techniques. The results of this thesis contribute to the investigation of the integrity and damage tolerance in 3D tufted composites toward certifying purposes for future transport aircraft. Since the certification of tufted composites for aerospace applications is still problematic due to the lack of dependable non-destructive evaluation techniques for their inspection and those manufacturing factors can considerably influence their performance, this is an important problem to tackle in the field of aerospace composite engineering.
.
Keywords: Textile preform, Textile composite, Non-destructive testing, Destructive testing,
INTEGRITY ASSESSMENT OF PREFORMS AND THICK TEXTILE REINFORCED COMPOSITES FOR AEROSPACE APPLICATIONS
ABBBASALI SABOKTAKIN RIZI
RÉSUMÉ
Les composites à renforts textiles 3D, contenant des fibres dans le plan et dans la direction de l'épaisseur, offrent certains avantages par rapport aux composites à renforts textiles 2D. Ces avantages comprennent une grande résistance à la délamination et une meilleure tolérance à l'endommagement. La plupart des textiles 3D ont été développés pour des pièces destinées à l'industrie aérospatiale telles que des panneaux d'ailes, des trains d'atterrissage, des tuyères de fusée et la capsule Orion. Cette thèse vise à évaluer l'intégrité structurelle des textiles composites en combinant des techniques d'inspection destructives et non destructives. Dans la première partie de la thèse, des techniques non destructives, y compris les rayons-X (CT) et des techniques basées sur les ultrasons (UT), ont été développées pour détecter les défauts importants comme la rupture des fibres et le désalignement des tissus. La deuxième partie porte sur l'étude de l'influence des défauts de fabrication qui se produisent dans les processus d’ touffetage sur les performances mécaniques.
Des résultats expérimentaux ont montré que tomographie rayons-X facilite la détection et la caractérisation de ces deux défauts de fabrication, ainsi que de l'architecture des tissus.
En outre, la modélisation méso-échelle d'un composite tissé en 2D a été réalisée avec succès pour l'analyse de l'influence du défaut de rupture des fibres et de l'architecture des fibres de propagation de l'onde. Les résultats expérimentaux montrent que le touffetage des préforme limite ou élimine le mouvement de leurs fils. En plus, la touffetage par des fils de haute résistance à la traction peut améliorer celle de leurs préforme 3D. La touffe d’un préforme fait augmenter la force de compactage des fibres. À cet effet, cette méthode est nécessaire pour augmenter le volume des fibres de plus de 50 % en comparaison d'un préforme non touffeté. La résistance à la déformation d'une préforme est influencée par l’opération de touffetage. En effet, une préforme touffetée est plus résistance à la déformation qu’une préforme non touffetée. La variation de la géométrie de la préforme a été mesurée par balayage laser. En outre, la capacité CT a été étudiée en tant que moyen pour reconnaître les formes et les emplacements des vides dans les matériaux composites. La résistance à la
traction des composites avec un touffetage transversale a eu moins de réduction de que celle avec touffetage longitudinal. Les tests de fatigue à haute vitesse de déformation montrent que les composites touffetés ont une durée de vie inférieure à celle des composite non touffetés. L’opération de touffetage permet d'améliorer les propriétés mécaniques despanneaux sandwichs à noyau en nid d'abeilles sollicités en compression locale et en flexion trois points. Les dommages sont souvent initiés dans les régions riches en résine qui entourent le renfort de touffetage. L'acceptation primaire de l’utilisation des composites touffetés 3D dans les structures aérospatiales est très dépendantes de l'exactitude et de la fiabilité des données expérimentales pour identifier le degré auquel les renforts améliorent ou dégradent les propriétés mécaniques. Dans cette thèse, la corrélation entre les préformes touffues, les propriétés des composites et leurs modifications dues au touffetagesont traités pour une configuration spécifique. Les données expérimentales sont présentées à la fois sur un taux faible et à haut débit statique et des forces de fatigue à différents niveaux de contrainte. L'examen microstructural est effectué en utilisant la microscopie à haute résolution et les techniques de CT. Les résultats de cette thèse contribuent à l'enquête sur la tolérance d'intégrité et de dommage dans les matériaux composites tuftés 3D en vue d'unecertification pour l'utilisation dans les futurs avions de transport. Cependant, la certification des composites tuftés pour les applications aérospatiales est toujours problématique en raison de l'absence de techniques d'évaluation non destructive fiables pour leur inspection et les facteurs de fabrication peuvent influencer considérablement leur performance, il s'agit d'un problème important auquel on doit s’attaquer dans le domaine de composite pour l’aérospatial.
Mots-clés: Préformes textiles, composites à renforts textiles, Essais nonestructifs, Essais
destructifs, Caractéristiques des préformes, Performance des composites, Mécanismes de défaillance
TABLE OF CONTENTS
INTRODUCTION ...1
CHAPTER 1 LITERATURE REVIEW ON 3D TEXTILE COMPOSITES AND NONDESTRUCTIVE TECHNIQUES ...7 1.1 Introduction ...7 1.2 Textile techniques ...8 1.2.1 Weaving ... 8 1.2.2 Stitching ... 9 1.2.3 Braiding... 17 1.2.4 Kniting ... 18 1.3 Preform characteristics ...19 1.4 Textile forming ...22
1.5 Classification of fiber structure ...24
1.6 Textile composite manufacturing process ...25
1.6.1 Dependency of resin flow to fabric structure ... 28
1.6.2 Effect of preform thickness on flow patterns ... 28
1.6.3 Compressibility of textile fabric ... 29
1.6.4 Dependence of permeability in textile fabric ... 31
1.6.5 Mechanical properties ... 31
1.7 Quality issues for the manufacturing of textile composite ...33
1.8 Defects in textile composite and preforms ...35
1.9 Non-destructive testing of 3D textile composite ...40
1.9.1 Preform inspection ... 41
1.9.2 Textile composite inspection ... 42
1.10 Geometry inspection ...59
1.11 Mechanical performance ...60
1.12 Comparisons and future challenges ...63
1.13 Conclusion ...63
CHAPTER 2 CHARACTERIZATION OF 2D TEXTILE COMPOSITES ...65
2.1 Introduction ...65
2.2 Materials and experimental equipment ...66
2.2.1 Composite sample manufacturing with known defects ... 66
2.2.2 Quality control ... 69
2.3 Experimental setup for NDT ...74
2.3.1 Ultrasonic ... 74
2.3.2 Vibration ... 77
2.3.3 X-ray ... 80
2.3.4 Mechanical characterization ... 80
2.4 Results and discussion ...81
2.4.1 Ultrasonic Results ... 81
2.4.2 Vibration Results ... 87
2.4.4 Tension test results ... 91
2.5 Finite element modeling ...93
2.5.1 Wave propagation at meso-scale level ... 93
2.5.2 Vibration modeling ... 98
2.6 Conclusion ...100
CHAPTER 3 3D TEXTILE PREFORM PERFORMANCE ...103
3.1 Introduction ...103
3.2 Materials and experimental equipment ...103
3.2.1 Preform manufacturing ... 103
3.2.2 Quality control ... 105
3.2.3 Specimens and mechanical test procedures ... 106
3.3 Results and discussion ...110
3.3.1 Tension ... 110
3.3.2 Drapability ... 118
3.3.3 Compression ... 120
3.4 Conclusion ...123
CHAPTER 4 MECHANICAL PERFORMANCE OF 3D TUFTED COMPOSITES ...125
4.1 Introduction ...125
4.2 Materials and experimental equipment ...125
4.2.1 Composite panels manufacturing ... 125
4.2.2 Quality control ... 128
4.2.3 Specimens and test procedures ... 134
4.3 Results and discussion ...139
4.3.1 Tufted composite ... 139
4.3.2 Honeycomb composites ... 151
4.4 Conclusion ...155
CHAPTER 5 DAMAGE CHARACTERIZATION OF 3D COMPOSITES ...157
5.1 Introduction ...157
5.2 Materials and experimental equipment ...157
5.3 Results and discussion ...158
5.3.1 2D textile composite ... 158
5.3.2 Tufted composite characterization ... 158
5.4 Conclusion ...170
CONCLUSION…………. ...171
RECOMMENDATIONS ...173
LIST OF TABLES
Page
Table 2.2. Epoxy resin properties ...68
Table 2.4. Impact hammer characteristics ...79
Table 2.5. PCB accelerometer characteristics ...80
Table 2.6. Natural frequency of composite samples ...89
Table 2.7. Tension test results of composite sample with known misalignment defect ...92
Table 3.1. Main tufting parameters of preform samples ...104
Table 3.2. List of specimens and tests for the preform characterization ...106
Table 3.3. Tension test results of untufted preform ...112
Table 3.4. Tension test results of tufted preform loaded in tufting direction ...113
Table 3.5. Tension3 test results of tufted preform loaded in tufting direction ...114
Table 3.6. Test results of preform drapability ...119
Table 3.7. Test results of preform compaction ...121
Table 4.1. List of composite panels. ...126
Table 4.2. List of tests and composite specimens ...135
Table 4.3. Quasi-static tension test results of longitudinal tufted specimens ...140
Table 4.4. Quasi-static tension test results of transverse tufted specimens ...141
Table 4.5. Quasi-static tension test results of untufted specimens ...141
Table 4.6. Test results of high strain tension test ...143
Table 4.7. Compression test results of untufted specimens ...144
Table 4.9. Test results of post fatigue tension tests ...151
Table 5.1. List of the composite samples characterized using microscopy and X-ray computed tomography techniques ...158
LIST OF FIGURES
Page Figure 1.1. The main categories of 3D textile performs (Richard H. A., 2000) ...7 Figure 1.2. (a) 3D weaving process. From lef totight: Schematics of 3D weaving
process, 3D Weaving machine (b) 3D woven composite applications. From left to right: Fuselage, Landing gear, 3D composite I beam (Bogdanovich A.E. and Mohamed M.H., 2009; (Buckley M., 2007;
(Hybridmat, 2006; (Mouritz A., 1997) ...9 Figure 1.3. Manufacturing process of stiffened stitched panel using vacuum infusion
process and its location on the BWB aircraft
(http://www.aeronautics.nasa.gov) ...10 Figure 1.4. Stitching Types (Dell’Anno G. et al., 2007; (Koissin V. et al., 2008;
(Tomek R., 2004) (a) Conventional lock stitch (b) Modified lock
stitch (c) Chain stitch (d) Dual lock stitch (e) Tufting ...11 Figure 1.5. Different types of blind stitch technique developed for composite industry
(http://www.qinetiq.com) ...12 Figure 1.6. (a) Example preform produced by tailored fibre placement (b) Schematic
of embroidery machine (http://www.avantgardetechnologie.de/) ...13 Figure 1.7. (a) Tufting machine (b) An example of tufted fabric (Dell’Anno G. et al.,
2007; (Friedrich K., Fakirov S. and Zhong Z., 2005) ...14 Figure 1.8. Production of complex shape preforms using stitching techniques.
From left to right: wing panel, fuselage, pressure bulkhead, window (http://www.interempresas.net; (Michulitz C., 2007; (Potluri P., Sharif T. and Jetavat D., 2008; (www.compositesworld.com) ...15 Figure 1.9. (a) Production of aircraft door using stitching process (b) Replacing
welding and jointing bolt with stitching process (Neitzel M. and
Mitschang P., 2004; (www.compositesworld.com) ...16 Figure 1.10. Braided fabric and preforms (a) 2D braided (Courtesy of A&P Tech)
(b) 3D braided preforms (Hybridmat, 2006) ...17 Figure 1.12. Multiaxial warp knitted fabric (Jinlian H., 2008) ...19
Figure 1.13. Deformation modes of textile fabric (Paolo E., 2009) (a) shearing (b) straightening (c) wrinkling (d) stretching (e) intra-ply slippage (f) inter ply slippage ...20 Figure 1.14. Schematic image of intera-ply slippage occurring in sharp
corner (Antonio M., 1999) ...21 Figure 1.15. Deformations of fiber bundles: (a) Crossover shear
(b) Inter fiber shearing in direction of fiber tow (c) Inter fiber shearing in transverse direction
(D) Bending and twisting (Long A., 2006) ...21 Figure 1.16. Typical complex shape parts composed of textile fabrics
(Luycker E. et al., 2009; (Mouritz A., 1997; (Uozumi T., Kito A. and Yamamoto T., 2005) ...22 Figure 1.17. (a) Curved surface used for manufacturing pressure bulkhead
(Chen B. and Chou T., 2000; (Hybridmat, 2006) (b) Textile fabrics draped on hemispherical die I) Basket II) Plain
III) Twill IV) 5-harness Satin ...23 Figure 1.18. Comparison of different types of woven fabrics
and their characteristics (Chen B. and Chou T., 2000) ...24 Figure 1.19. Textile fabric characteristic based on drapability and shear stiffness
(Paolo E., 2009) ...25 Figure 1.20. Typical composite manufacturing process
(Simacek P., Advani S.G. and Iobst S.A., 2008) ...26 Figure 1.21. Manufacturing process of a landing arm for helicopter NH-90
(Thuis H., 2004) (a) Braided preform (b) assembling of the
preform into the mould (c) RTM setup to inject resin to the mould
(d) final product ...27 Figure 1.22. Fabrication of pressure bulkhead using vacuum infusion process
(courtesy of Trans-Textil GmbH) ...27 Figure 1.23. Typical example of thin braided and thick woven (100mm)
(Luycker E. et al., 2009; (Tong L., Mouritz A.P. and
Bannister M.K., 2002) ...28 Figure 1.25. Compression pressure relationship of biaxial (BD)
dry and wet fabric. (Andreas E., 2003) ...30 Figure 1.26. Deviation of flow front due to fabric shearing
Figure 1.27. Comparison of strength of laminated and stitched composite
(Sickinger C., Wilmes H. and Herbeck L., 2000) ...32 Figure 1.28. (a) Example images of void in textile composite: marcovoid
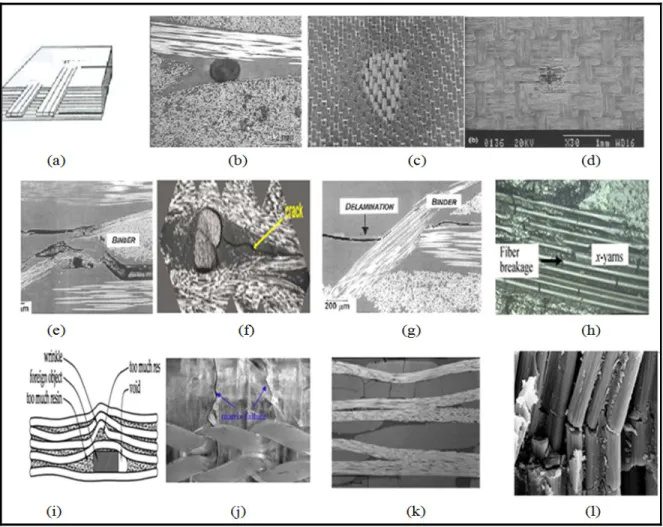
(left) and microvoid (right) (b) Void content vs. capillary number. (Hamidi Y.K., Aktas L. and Altan M. C. , 2009) ...34 Figure 1.29. Example image of major defects in textile composite (Tong L. M., 2002;
(Unnþórsson R., 2004) (a) Edge damage occurring in machining process (b) void between fiber bundle (c) Dry path (d) Micrometroid damage (e) Brocken Z-binder (f) Micro-crack in the stitched composite (g) Delamination in woven composite (h) fiber breakage (i) Inclusion
(j) Matrix crack (k) Matrix crack (l) fiber breakage ...36 Figure 1.30. Comparison of cutting by laser (a) and mechanical machining (b)
(http://www.industrial-lasers.com) ...37 Figure 1.31. Different types of preform defects (Tong L. M., 2002) (a) Misaligned
through the thickness yarn (b) Misalignment of fiber bundle due to stitching (c) Textile fabric misalignment (d) Fiber crimping
(e) Resin rich region (f) Fiber pullout (g-j)fiber breakage ...40 Figure 1.32. (a) Schematic of the principle of laser sectioning system (Andrea M.,
2009) (b) Example image of fiber orientation detection using laser
sectioning system ...41 Figure 1.33. Example of ultrasonic C-scan of aircraft pressure bulkhead
(http://www.airbus.com) ...43 Figure 1.34. Damping factor versus direction for graphic/epoxy composite
(Suarez S. A. et al., 1986) ...47 Figure 1.35. (a) Schematic image of leaky Lamb wave inspection applied
to composite (Yoseph B.-C. and Shyh-Sh. L., 2001)
(b) Wave modes for dry (solid lines) and immersed (dashed lines)
graphite epoxy (Nayfeh A.H., 1995) ...48 Figure 1.36. (a) Dispersion curve of Lamb wave modes
(Yashiro S. and Takatsubo J., 2007) in (b) CFRP cross-ply and its
visualized wave propagation ...50 Figure 1.37. Some results of ultrasonic imaging using Schlieren photography
(Declercq N. F., Teklu A. and Breazeale M., 2005) (a) Ultrasonic beam incident and reflected on an aluminum block (b) Example images of reflected beam pattern to detect fiber orientation ...51
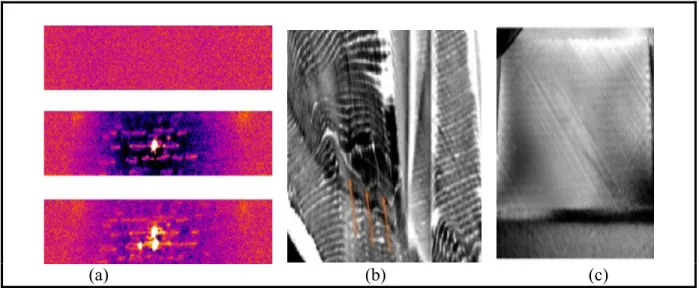
Figure 1.38. Example X-ray images (a) Conventional X-ray (b) X-ray tomosynthesis (c) Micro tomography (Randolf H., Theobald F. and Norman U., 2008;
(Ulf H., Stephan S. and Randolf H., 2007) ...52
Figure 1.39. The blade inspection using shearography technique (courtesy of Edevis Company) ...55
Figure 1.40. (a) Principle of shearography inspection technique (b) Example of fringe pattern (Francis D., Tatam R. P. and Groves R. M., 2010; (Hunga Y. and Hob P., 2005) ...55
Figure 1.41. Eddy current inspection (Mook G. and Koeser R., 2001) (a) Eddy current measurement equipment (b) Eddy current images of CFRP showing the fiber orientation ...57
Figure 1.42. Non-destructive testing of composite by using IR thermographic methods (a) Pulse themography (b & c) Inductive thermography (Swiderski W., Szabra D. and Szudrowicz M., 2008; (Vorgelegt V., 2007) (courtesy of Edeviscompony) ...59
Figure 2.1. Layup sequences for perfect woven composite ...66
Figure 2.2. Fabric layup sequence for defective woven composite sample containing several fiber breakages on 3rd preform layer ...67
Figure 2.3. Fabric layup sequence of defective woven composite samples with angle increments 5o, 10o, 20o of the 3rd preform layer ...68
Figure 2.4. Micrographic images of samples surface (a) Voids at the tow intersection because of lack degassing process (b) Textile preform injected by degassed resin ...70
Figure 2.5. Micrographic images of perfect sample cross-section ...71
Figure 2.6. Experimental setup for CMM scanning of composite sample ...72
Figure 2.7. Graphical image of deviations values for sample I ...73
Figure 2.8. Average thickness deviation for plate I (reference), plate II and plate III ...74
Figure 2.9. Experimental C-scan setup ...75
Figure 2.10. Schematic of pulse echo ultrasonic scanning ...76
Figure 2.12. Image of transducer position for polar C-scanning ...77
Figure 2.13. Experimental setup for vibration based testing ...78
Figure 2.14. Schematic image of impact testing setup ...79
Figure 2.15. C-scan image of reference sample using a 5 MHz flat transducer and 0.5 mm scanning increment ...81
Figure 2.16. A-scan result of reference sample ...82
Figure 2.17. C-scan of sample II ...83
Figure 2.18. B-scan image of sample I (reference plate) ...84
Figure 2.19. Polar C-scan of sample I using 5 MHz flat transducer (a) and corresponding A- Scan (b) ...85
Figure 2.20. Polar scan ultrasonic of an unidirectional composite ...86
Figure 2.21. Stacking sequence of unidirectional composite sample ...86
Figure 2.23. FRFs of misaligned and reference samples ...88
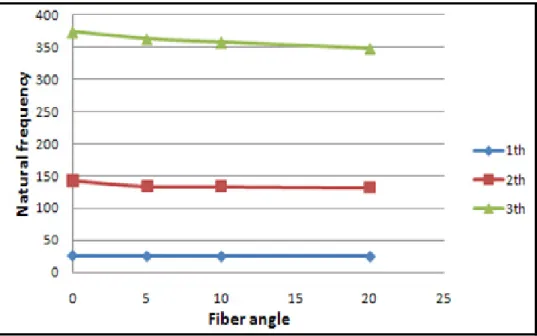
Figure 2.24. Natural frequency of composite samples at second vibration mode ...89
Figure 2.25. Variation of the natural frequencies of the samples as a function of the mid layer angle ...90
Figure 2.26. X-ray CT images of composite plates sectioned in thickness direction to observe mid layer orienataion (a) Sample I (b) Sample III ..91
Figure 2.27. In-plan tensile strength of sample with different mid-layer orientation ....92
Figure 2.28. SEM images of samples ruptured in tension test (a) Fiber pull out (b) Fibers ruptured in shear mode ...93
Figure 2.29. Experimental setup for the laser ultrasonic scanning ...94
Figure 2.30. Model for finite element analysis (a) Fiber (b) Matrix ...94
Figure 2.31. A complete mesh of woven composite at different view ...96
Figure 2.32. (a) Displacement contour of woven composite at meso scale level (b) Received response in back side of composite model ...97
Figure 2.34. Boundary condition applied to the composite model and solid element FE model of composite plate ...99
Figure 2.35. Difference between FRF of intact and defective samples ...100
Figure 3.1. Schematic images of tufting thread arrangement...104
Figure 3.2. Architecture of tufted preform (a) Front-side (b) Back-side ...104
Figure 3.3. Micrographic images of the tufted region using (a) SEM (b) Optical microscopes...105
Figure 3.4. Schematic images of sample for tensile tests (a) Tufted (b) Untufted ...107
Figure 3.5. A tufted sample clamped for in-plan tension test ...107
Figure 3.6. Experimental setup for the drape testing ...108
Figure 3.7. Schematic image of tufted preform for drape test ...109
Figure 3.8. Testing setup for the preform compression ...110
Figure 3.9. Untufted force-displacement results from four specimens loaded in uniaxial tension along the warp (0o) direction ...112
Figure 3.10. Tufted preform force-displacement results from five specimens loaded in uniaxial tension along tufting direction...113
Figure 3.11. Tufted preform force-displacement results from five specimens loaded in uniaxial tension in perpendicular to tufting direction ...114
Figure 3.12. Typical toughness-displacement results from three specimens loaded in tension along the tufting direction, transverse direction and the warp direction. ...115
Figure 3.13. Typical force-displacement curve of tufted preform and four distinct regions ...116
Figure 3.14. Tufted preforms loaded in tension in tufting direction ...117
Figure 3.15. Load vs. deflection curve of tufted and untufted preforms ...118
Figure 3.16. Microscopic image of localized fiber misalignment occurred in drape test ...120
Figure 3.17. Load vs. displacement of specimens loaded in compression ...121
Figure 3.18. Cross-section of uncompacted and compacted tufted preform ...122
Figure 3.20. Deformation of tufting thread during compaction loading ...123
Figure 4.1. Resin impregnation of tufted preform ...127
Figure 4.2. Honeycomb core size parameters ...127
Figure 4.3. Calibration of the laser scanner for the preform scanning ...129
Figure 4.4. Integrated surface constructed from points cloud ...130
Figure 4.5. Optical microscopic image of the tufted composite ...131
Figure 4.6. SEM micrograph of the tufted sample cut through a tufting site ...131
Figure 4.7. Three-dimensional volumetric model of tufted composite sample with dimensions of 25 mm x 20 mm (Note: the tufting threads are rendered invisible) ...132
Figure 4.9. Planar X-ray image of tufted composite with dimensions of 25 mm x 20 mm ...133
Figure 4.10. Fiber distortion due to tufting (a) Schematic image (b) X-ray image ...134
Figure 4.11. Schematic of tension samples and their loading directions (a) Longitudinal tufted (b) Transverse tufed (c) Untufted ...136
Figure 4.12. Tension test specimen and extensometer for fatigue test. ...136
Figure 4.13. Compression testing setup ...137
Figure 4.14. Experimental setup of quasi-static local compression test (note: the circled regions are not void, but appeared by diamond saw in cutting process) ...138
Figure 4.15. Experiment setup of bending testing for honeycomb composites (a) Untufted (b) Tufted ...138
Figure 4.17. Stress-stain curves of specimens with open hole ...142
Figure 4.18. High strain rate tensile test of composite samples ...143
Figure 4.19. Stress-strain curves of samples subjected to compressive loading ...144
Figure 4.20. S–N curve for the tufted composite sample under different stress levels ...146
Figure 4.21. A plot of displacement vs. fatigue loading of tufted
composite depicts two regions, A and B, occurring between
the 300 to 800 cycles, and 8740 to 8770 cycles, respectively ...147
Figure 4.22. Stiffness degradation of tufted composite under fatigue loading ...148
Figure 4.23. Stiffness degradation of untufted composite under fatigue loading ...149
Figure 4.24. The displacement vs. fatigue cycle of tufted composite ...150
Figure 4.25. Post-fatigue tension test results ...151
Figure 4.26. Load-displacement curves of sandwich composites under local compression ...153
Figure 4.27. Load-displacement curves of honeycomb composites under bending load ...154
Figure 5.1. Microscopic images of delamination crack in tufted composite during fatigue (a) Tufted sample (b) Open-hole tufted sample ...159
Figure 5.2. Reconstructed 2D images of fractured specimen in static tension test (a) top surface (b) side view of open-hole sample with dimensions of 20 mm x 25 mm ...160
Figure 5.3. SEM micrograph of fractured tufted composite in tensile test (a) Delamination between tufting thread (b) Delamination arrested in tufted region ...161
Figure 5.4. Transverse matrix crack in tufted composite in tension test ...162
Figure 5.5. Crack originated from resin rich region ...162
Figure 5.6. X-ray side images of sample with dimentions of 20 mm x 25 mm subjected to fatigue loading ...163
Figure 5.7. Optical microscopic image of micro crack inside of tufted composite under fatigue test ...164
Figure 5.8. Delamination crack in tufted composite ...165
Figure 5.9. SEM Images of delamination in tufted composite in fatigue test ...166
Figure 5.10. (a) Top and (b) Side X-ray images of tufted sample ruptured in compression test with dimensions of 20mm x 10mm ...167
Figure 5.11. SEM image of tufted sample ruptured in compression test ...168 Figure 5.12. Images of honycomb composites ruptured in quasi-static compression
(a) Side image (b) Sample cutted from the point under plunger ...169 Figure 5.13. Damage occurring on tufted composite subjected to
three point bending test (a) Core shear (b) Damage intiation
INTRODUCTION
Composite materials have been used for various structural applications due to their high specific strength and stiffness. The first generation of composites is two-dimensional (2D) laminates. Although, these types of composites are known by high in-plane strength and stiffness, they suffer from both the need to use a time-consuming lay-up step during the manufacturing process and poor out-of-plane properties. Over the last two decades, three-dimensional (3D) textile composite structures have been developed to overcome the disadvantages of 2D textile composites. The 3D textile composites have been developed to enhance the mechanical properties in the through-thickness direction, improve damage tolerance, and decrease fabrication costs. The development of 3D textile composites based on 3D preforms has been undertaken mostly by NASA (Dow M. and Benso H., 1997; (Poe C.C. and Dexter H.B., 1997).
Textile processes have reduced the cost for manufacturing many textile composite components and improved important aspects of mechanical performance such as impact damage tolerance. Manufacturing defects introduced during the manufacturing process can degrade the performance of a composite. The extent of performance degradation at which the severity of the defect becomes safety-critical depends on the application and can only be determined by structural integrity assessment.
Research objectives and methodology
This research thesis is devoted to structural integrity assessment of textile composites by the combination of inspection procedures and standard mechanical tests. Therefore, the objectives of the thesis are:
• To select the most suitable NDT techniques to detect major manufacturing defects in 2D textile composites, such as: ply misalignment defect and fibre breakage defect; and extract actual defects parameters such as type, size, shape and location;
• To determine the most convenient inspection method(s) for the inspection of 3D tufted preforms and composites with subsequent experimental validation;
• To measure the influence of defects during static and dynamic loadings.
This thesis explores these research objectives based on the information obtained through a comprehensive literature review and our experimental results. Since each non-destructive method has advantages and disadvantages that influence the choice of inspection method for the textile preform and composite, the success or failure of any technique to detect defects is determined by its limitations. I assess three techniques; namely, ultrasonic, optical methods, and X-ray, as feasible methods for inspecting preforms and textile composites. On the other hand, due to the inhomogeneous structures of textile composites, their inspection is quite different and more complex than those intended for common composite structures. Hence reaching our goals and answering all issues described in this thesis required using more than one non-destructive method.
The combination of the proposed methods is expected to improve the reliability of preforms and final composite structures that is in agreement with our goals.
Understanding the behaviour of defects under mechanical loads and examining of the resistance characteristics of composites to these defects is another goal. This goal is pursued by investigating the influence of defects on composite performance; including an assessment of the static and fatigue performance of composite samples in presence of defects such as fiber breakage, fiber misalignment, etc.
Our approach toward reaching our objectives is to progress systematically from the testing of 2D textile composite specimens to 3D composites, as well as from thin textile composites to thick ones. This systematic approach simplifies the understanding of practical aspects of each NDT technique, their capabilities and limitations, and enables the examination of the suitability of each method towards the structural integrity assessment of textile composites. For all specimens, research is conducted in two phases: (a) inspection of composite specimen, and (b) investigation of the effect of defects on mechanical performance. Below we illustrate how the proposed phases in this thesis related to each other to form an appropriate strategy to achieve our objectives:
The first phase of this work consisted of:
• Identification of state-of-the-art non-destructive evaluation (NDE) technologies that can be used for detecting defects in textile composite;
• Development of the techniques to successfully inspect flat textile composite panels The second phase of this work consisted of:
• Fabrication of composite specimens while controlling important parameters to minimize void formation during the manufacturing process;
• Inspection of specimens containing artificial defects as well as defect-free specimens; • Determination of the influence of defects on the mechanical performance according to the results obtained from different mechanical tests and analysis of the behavior of defective samples under different loading conditions.
Thesis contribution
3D Textile preforms and composites have been used in a large number of aerospace applications such as pressure vessels, rotor blades, external fuel tanks for commercial aircraft and composite fuselages, etc. Because of these advanced applications, there is a high need to investigate the structural integrity in these types of composites. The objectives explained in this thesis are aimed at investigating the inspection of textile composites and finding a correlation between defects and the mechanical performance. Mechanical testing including static and fatigue tests for both textile preform and composites, and a fractographic method combined with NDT methods have been considered to survey the 3D tufted composite performance. Therefore, the contributions in this thesis can be divided into the following sections that are intended to fulfill the research objectives explained above:
• For the first time in this thesis, ultrasonic polar scanning is applied to detect manufacturing defects such as fiber breakage and fiber misalignment in 2D woven composites in addition to X-ray computed tomography for characterizing of 3D tufted composites. The results provide useful information concerning the capabilities of these testing methods to detect micro damage in textile composites.
• Implementation of a finite element method to analyze wave propagation in a woven textile composite at the meso-scale contributes to the detection of small fiber
breakage which opens a new research field on analysis of wave propagation in damaged textile composites in the presence of manufacturing defect.
• The use of laser scanning for measuring preform geometry deviation contributes to the subsequent research on the application of non-contact CMM scanning for 3D preforms.
• Evaluation of tufted preform formability promotes to the manufacturing of complex shaped composite parts.
• Fatigue performance characterization of 3D tufted composite at different stress levels for the present configuration contributes the abilities to predict the fatigue life and to perform comparisons with other tufting configurations.
• Damage growth and stiffness degradation for the 3D tufted textile composite discussed in this thesis help to analyse damage tolerance in 3D tufted composites, a challenge which still needs to be addressed.
• An invaluable collection of SEM fractographs for 3D tufted composite is allowing to correct interpretation and increase accuracy of failure analysis because it is mitigating the previous lack of information.
• Figure 1 displays different levels of mechanical test known as the test pyramid for aerospace structures. Research results achieved at the coupon level in this thesis can be developed for larger structural elements, components, and complete assemblies in the aerospace industry.
Figure 1. Test pyramid for aircraft composite structures.
Thesis outline
This thesis is divided into five major sections: Part I, introduction and literature review; and Parts II-V research results, conclusions, and potential applications of this thesis.
Composite defects, their inspection and influence on composite performance are illustrated in Chapter II. This chapter is intended to apply all research results to the integrity assessment of 3D reinforced composites elaborated in following chapters. In this part, at first, quality issues related to damage detection, manufacturing process and mechanical performance of textile composite are described in detail. These quality issues include microscopic assessment (SEM, optical microscopy) presented in several distinct sections. Moreover, the effect of textile structure complexity on their inspection using NDE techniques is illustrated as well as geometry inspection of composite using a coordinate measuring system. Chapters III and IV are focused on the 3D preforms and composite characteristics which are introduced as major research topics. These chapters assess the impact of initial defects containing fiber breakage
on the mechanical performance. The critical level of the samples containing these defects subjected to static and cyclic loading is examined. The location, size, shape, and distribution of porosity through the composite thickness are investigated using X-ray tomography as well as cross-sectioning analysis of the composite samples for the quality control purposes. Chapter V is devoted to the use of microscopic and X-ray techniques for the detection of a wide range of 3D composites defects as well as for the assessment of which damage modes occur during loading and if the initial damage develops during static and fatigue loading tests.
CHAPTER 1
LITERATURE REVIEW ON 3D TEXTILE COMPOSITES AND NONDESTRUCTIVE TECHNIQUES
1.1 Introduction
3D Composites materials are composed of two main constituents: matrix and fabric. The fabric, termed 3D preform, is an integrated textile architecture having in-plane fibers and fibers oriented through the thickness (Jinlian H., 2008). 3D preform in 3D textile composites may contribute to improve the strength and stiffness in the thickness direction, eliminate the interlaminar surfaces due to integrated structure and present possibilities of designing and manufacturing near-net-shape composite components. A variety of textile processes including 3D weaving, stitching, knitting, and braiding have been used to insert the through-thickness fibres (Richard H. A., 2000). A categorization of 3D fabrics based on the presence of reinforcing fibers oriented in the through-thickness direction is shown in Figure 1.1.
Figure 1.1. The main categories of 3D textile performs (Richard H. A., 2000)
In textile composite structures, failures originate from manufacturing defects or service-induced damage. Manufacturing defects can degrade the performance of textile composites to a point where the composite cannot be used safely for an aircraft structure. The point at which the severity of the defect becomes safety-critical (denote those defects that significantly decrease damage tolerance of aircraft structures and leads to very low mechanical properties) depends on the application and can only be determined by structural integrity assessment. This chapter reviews all the processes used to produce 3D preforms, preform architectures, their specifications and deformation modes. Finally, the chapter discusses those inspection procedures that can be applied to structural integrity assessment of textile composite.
1.2 Textile techniques 1.2.1 Weaving
The weaving process includes the placing of weft yarns between warp yarns. The warp yarns are placed in the direction of the weaving process and weft yarns lie perpendicular to the warp yarns. In addition, the yarns in the through-thickness direction named Z- binders are used to bind several layers of interlaced warps and wefts. Figure 1.2 displays a schematic of weaving process and a weaving loom machine. Jacquard looms are the most popular due to their high degrees of automation and good control of the fiber structures. The benefits of this automation in weaving process are: reducing the manufacturing costs, in-process inspections, and increasing repeatability and quality control. The loom can be used to manufacture integrated and net-shape preforms such as blade stiffened panels (Mouritz A., 1997; (Rudov-C. S., 2007).
(a)
(b)
Figure 1.2. (a) 3D weaving process. From lef totight: Schematics of 3D weaving process, 3D Weaving machine (b) 3D woven composite applications. From left to right: Fuselage, Landing gear, 3D composite I beam (Bogdanovich A.E. and Mohamed M.H., 2009; (Buckley
M., 2007; (Hybridmat, 2006; (Mouritz A., 1997)
1.2.2 Stitching
Over last two decades, a variety of stitching techniques has been used considerably to stitch textile fabric toward manufacturing reinforced composite structures with high damage resistance. The stitching process is carried out using industrial stitching machines. Stitching machines can stitch various kinds of preforms with high performance yarns as stitching threads. For the stitched composite structure, the extent of through-thickness fibers is between 1 to 5%, which is a same extent of through-thickness reinforcement for other type of 3D composites (Herszberg B., 1997; (Tong L., Mouritz A.P. and Bannister M.K., 2002). The stitching process may offer the following advantages: joining composite structures, provide high strength and resistance in through-thickness directions to peel loads, decreasing the manufacturing cost, improving interlaminar fracture toughness, impact resistance and
tolerance, construct 3D complex shapes by stitching several separate preforms together and consequently reduction the need for fasteners, and finally, weight reduction (Weimer C., 2003). Figure 1.3 displays the manufacturing stage of an aircraft composite panel stiffened by stitching process.
Figure 1.3. Manufacturing process of stiffened stitched panel using vacuum infusion process and its location on the BWB aircraft
(http://www.aeronautics.nasa.gov)
Despite these advantages for stitched composites, the following disadvantages can be attributed to the stitching process: reduction in the in-plane properties of composite structures due to fiber breakage occurring in penetrating the needle into fabrics, the performance reduction due to the fabrics crimping. Stitching process causes distortions in the fabric, fiber breakage and resin rich regions in the composite which acting as potential sites for damage
initiation and decreasing the performance of composite. More details on the damage caused during stitching can be found in the next section (Tong L. M., 2002).
Stitching types
The type of stitching has significant effect on the mechanical performance of stitched composites (Karal M., 2005). Lock stitch is one of the most common types of stitching techniques. Mostly, this stitch has been applied in clothing industry and two thread loops is placing between the bobbin and the needle (see Figure 1.4a). The lock stitch requires access to both top and bottom of the stacked fabrics (Herszberg B., 1997; (Tong L. M., 2002). This type of stitching is not appropriate for composites because the thread intersection in the middle of the fabrics causes a stress concentration. Therefore, modified lock stitch shown in Figure 1.4b is typically used in composite industry that allows the needle thread to move on the composite surface instead of the middle of composite (Kimberley D., Caroline B. and Yiu-Wing M., 1994).
Figure 1.4. Stitching Types (Dell’Anno G. et al., 2007; (Koissin V. et al., 2008; (Tomek R., 2004) (a) Conventional lock stitch (b) Modified lock stitch (c) Chain stitch
Moreover, a chain stitch method shown in Figure 1.4c is used in composite industry. This method has similar mechanism to the lock stitch. Other sewing machines can generate two types of stitches; dual-needle stitching (see Figure 1.4d) and tufting (see Figure 1.4e). In addition to conventional stitching techniques which require access to both fabrics sides, there are other techniques that need only one side of fabrics (See Figure 1.5). In these techniques, curved needle or hooked needle has been used. The maximum thickness of preform to be stitched using these techniques is around 20mm.
Figure 1.5. Different types of blind stitch technique developed for composite industry (http://www.qinetiq.com)
The significance of stitching parameters on mechanical performance, in particular ballistic performance and fracture toughness, becomes obvious during preform resin impregnation (Hosur M. V. et al., 2004; (Solaimurugan S. and Velmurugan R., 2008). Large number of variables in stitching techniques has been reported while there are many interactions among these variables. The major parameters of stitching process are as follows: stitching pattern, stitch density, and thread type and diameter as well as manufacturing variables including thread tension, foot pressure, needle type/size, textile fabric, and machine type. These parameters have significant effect on strain distribution and concentration in 3D composite structure (Mitschang P. and Ogale A., 2009; (Ogale A. and Mitschang P., 2004).
Needle diameter dominates the amount of the spreading of the fiber during the penetration process such that it can be said the expansion of needle holes is strongly function of needle
diameter. To reduce the extent of fibre damage, small needle diameter should be considered. Needle deflection depends on needle diameter and preform thickness. Various tests are required to evaluate these effects. Therefore, experimental design techniques play a major role for these types of reinforced preforms.
Tailored fiber placement
Technical embroidery or tailored fibre placement (TFP) mostly have been used to place the reinforcement fibers in directions according to the load requirements (Sickinger C. and Herrmann A., 2001). In this stitching technique shown in Figure 1.6, a reinforcement thread is fed into the stitching path and is stitched onto the preform surface in a zigzag pattern while the machine automatically moves the material corresponding to the pattern defined by software developed for TFP (LayStitch LTD.; (Stuttgart Uni.). Recently, CNC machines have been used to facilitate the placing the reinforcement thread in complex paths to meet the maximum stress distribution in desired directions. The high level of automation in CNC machine makes them able to produce complex shaped preforms with considerable cost saving.
(a) (b)
Figure 1.6. (a) Example preform produced by tailored fibre placement (b) Schematic of embroidery machine
Tufting
As shown in Figure 1.7a, tufting is a one sided stitching technique in which the formation of loops is done by a tension-free stitching thread. Figure 1.7b shows top-side and underside of a tufted preform along with tufting machine. In this technique, the bonding between the matrix and stitching thread is created only after resin injection. However, significant fibre damage occurring in the tufting can reduce in-plane strength of final composite parts (Dell’Anno G. et al., 2007). Based on literature review the knitted fabrics are inappropriate for use with this technique whilst woven fabrics are somewhat easy to tuft due to their interlaced architectures. Furthermore, non-crimped-fibre (NCF) fabrics seem appropriate for tufting process.
(a) (b)
Figure 1.7. (a) Tufting machine (b) An example of tufted fabric (Dell’Anno G. et al., 2007; (Friedrich K., Fakirov S. and Zhong Z., 2005)
Applications of stitched preforms
Many research projects have been carried out to evaluate the applicability of stitched textile preforms for aerospace structures. For instance, in order to fabricate large wing panels, the Boeing developed a specific machine for stitching process (James H. S., Benson H. and Norman J. J., 2003). That machine was intended to decrease the weight by 25% and 20% in costs compared with equivalent aluminum parts (see Figure 1.8). Other example for stitched
preform is shown in Figure 1.8a. Recently, Airbus and its collaborators have moved to stitching techniques for the manufacture of primary structure of aircraft such as passenger door of commercial aircrafts shown in Figure 1.9.
Figure 1.8. Production of complex shape preforms using stitching techniques. From left to right: wing panel, fuselage, pressure bulkhead, window (http://www.interempresas.net;
(Michulitz C., 2007; (Potluri P., Sharif T. and Jetavat D., 2008; (www.compositesworld.com)
Furthermore, the stitching technique has been developed to produce a CFRP stator. These developments of stitching techniques seem promising for the automotive industry to benefit
of the tremendous weight reduction and specific mechanical properties in particular to increase crash performance (Claudia H., 2003).
(a) (b)
Figure 1.9. (a) Production of aircraft door using stitching process (b) Replacing welding and jointing bolt with stitching process
(Neitzel M. and Mitschang P., 2004; (www.compositesworld.com)
Furthermore, stitching can be used to connect several composite parts without the need for mechanical fasteners such as bolts and screws, thus decreasing the manufacturing difficulties. This method distributes the stress received by composite over the joint area and also decreases. Lately, 3D stitching robots have been employed to make the textile preforms in the shape of a desired component (Tong L. M., 2002). The robot can stitch the net-shape preform to improve the strength and weight to meet the end application requirements and also decrease handling and lay-up times. Furthermore, the robotic stitching provides 3D dimensional motion to produce very complex shaped preforms (Michulitz C., 2007). Although the stitching technique using robots has been reliable in its performance, the development of appropriate fixation devices for the production of textile preforms using robots is the main challenge.
1.2.3 Braiding
Figure 1.10 shows typical 2D and 3D braided structures. 2D braided structures (Figure 1.10a) are composed of interweaved fibers oriented in 0°and fibre orientations. 3D braiding preforms, shown in Fig. 1.10b, are the extension of 2D braided fabrics constructed by interlacing in-plane yarns with the through-thickness reinforcements (Jinlian H., 2008). 3D braiding process can be used for producing a near net-shape preforms, for instance, rib stiffened panels, airframe spars, rocket nose cones, fuselage barrels, tail shafts, and rocket engine nozzles (Poe C.C. and Dexter H.B., 1997).
(a)
(b)
Figure 1.10. Braided fabric and preforms (a) 2D braided (Courtesy of A&P Tech) (b) 3D braided preforms (Hybridmat, 2006)
Generally, braided machines have been divided into two categories: rectangular and circular. Tubular braiding shown in Figure 1.11 is other braiding technique established in industry for producing 3-dimensionally shaped preforms of high-performance fibres such as I or T beams. In addition, the braiding yarns can be placed on cores which may be handled by a robot to ensure proper fibre orientation. If necessary, it is possible to remove the core and in a second step form the braiding to get stringer shaped preforms.
Figure 1.11. Robotic braiding of a J-stiffener (Neitzel M. and Mitschang P., 2004)
1.2.4 Kniting
Knitting is widely used for the production of garments. It has received attention from preform manufacturers for producing complex 3D structures. Figure 1.12 shows a 3D knitted structure. Due to the curved structure of yarns, the knitted preform has a very flexible structure. These characteristics permit the preform to be used to produce very complex structures. However the major disadvantage of this process is fiber breakage occurring during the manufacturing of preform in particular for carbon fibers. Other major problem around the knitted reinforcements is the loop structure makes local stress concentrations, so their mechanical properties are generally lower than alternative techniques.
Figure 1.12. Multiaxial warp knitted fabric (Jinlian H., 2008)
1.3 Preform characteristics
The textile fabric structure influence the manufacturing properties such as deformability, porosity and permeability and mechanical properties of final composite parts. The characterisation of local fiber variation occurring during forming, fiber volume fraction and fiber thickness are significant parameters to describe the performance of textile fabrics. During the forming of textile fabrics, the following deformation mode occurs: shearing, straightening, wrinkling, stretching, interply slipping and intera-ply slippage (see Figure 1.12).
Figure 1.13. Deformation modes of textile fabric (Paolo E., 2009) (a) shearing (b) straightening (c) wrinkling (d) stretching
(e) intra-ply slippage (f) interply slippage
If the directions of applied tensile load to textile fabric do not coincide with the fibre tow orientation, fabric shear mode occurs. This deformation mode is subject to high friction in the crossing points depicted in Figure 1.13a. Figure 1.13.b&c depict the shearing modes occurred in transverse or parallel to fiber tow. Fibre curvature changes under tensile and compressive load. The effect of fibre straightening is substantial for knitted fabrics. However, the effect is low for other fabrics with low-undulation structure. Elastic stretching of fiber has minor importance, because the reinforcement textiles used for advanced applications have high tensile moduli. Interply deformations allow the preform layers to slip with respect to each other when the fabric is bent by forming forces. Figure 1.14 displays the presence of high fiber slipping at the corner (Endruweit A. and Ermanni P., 2004).
Figure 1.14. Schematic image of intera-ply slippage occurring in sharp corner (Antonio M., 1999)
Other deformation modes in textile fabrics, bending and torsion modes can be occurred due to friction between the fibre bundles and the compression resulted from forces in perpendicular to the fiber bundles axis. Figure 1.15 represents schematic images of these deformation modes.
(a) (b) (c) (d)
Figure 1.15. Deformations of fiber bundles: (a) Crossover shear (b) Inter fiber shearing in direction of fiber tow (c) Inter fiber shearing in transverse direction (D) Bending and twisting
(Long A., 2006)
Based on the deformation modes demonstrated above, textile mechanics must include a description of their behaviour under combined biaxial tension (Lomov S. V., Boisse P. and Morestin E., 2008), shear and compression loading conditions (Chen B. and Chou T., 2000; (Sozer E.M. et al., 1999), bending and friction tests (Potluri P. and Atkinson J., 2003).
1.4 Textile forming
Complex shaped textile composite needs the formation of textile fabric in tools before resin injection. The draping of textile fabrics on double curved surfaces has received much attention both in 2D and 3D textile structure for description of the textile behaviour for forming (Yu J. Z., Cai Z. and Ko F. K., 1994). For instance, drapability of fabric for manufacturing an aircraft nose cone or blade geometries are the main characteristics that have been investigated for the adaptation of fabric on their tools (see Figure 1.16) (Safran Group Ltd., 2011).
Figure 1.16. Typical complex shape parts composed of textile fabrics (Luycker E. et al., 2009; (Mouritz A., 1997; (Uozumi T., Kito A. and Yamamoto T., 2005)
The drape of textile fabrics can be expressed in terms of shear deformation, local shear angle, and yarn slippage. The wrinkling defect occurs due to compression loading appearing during shear deformation of fabric tows beyond the locking angle (maximum shear angle). This defect results in buckling deformation through the fabric thickness (Long A., 2006). To be clearer, drape test of four different types of textile fabric including a basket, plain, twill and satin weave are depicted in Figure 1.17.
Figure 1.17. (a) Curved surface used for manufacturing pressure bulkhead (Chen B. and Chou T., 2000; (Hybridmat, 2006)
(b) Textile fabrics draped on hemispherical die I) Basket II) Plain III) Twill IV) 5-harness Satin
Plain weave exhibits low shear deformation and the worst drapability due to high level of fiber undulation in compared with other fabrics. It is worth noting that these low shear deformations can result local change of fiber volume fraction.
Shearing of aligned reinforcement results in two effects in the architecture of fabric: changes in fibre orientations and decrease in tow spacing. The decrease of tow spacing causes the density increase and consequently a local change in fibre volume fraction occurs.
Figure 1.18 represents a comparison between several textile woven fabrics based on the deformability and stiffness.
Figure 1.18. Comparison of different types of woven fabrics and their characteristics (Chen B. and Chou T., 2000)
1.5 Classification of fiber structure
Characterisation of the textile fabric based on shear stiffness and drapability is needed for accurate prediction of the fabric forming for 3D-complex shaped composite structure. Figure 1.19 depicts relation between shear stiffness and drapability for different fabrics. It is clearly seen that unidirectional (UD) tape has low drapability and shear stiffness. Since, UD tapes indicate high fixation of the yarns permitting no large shear angles during forming, and the fabric cannot be distorted easily. Knitted preforms have high conformability, however lower in shear stiffness due to curved fibers.
Figure 1.19. Textile fabric characteristic based on drapability and shear stiffness (Paolo E., 2009)
3D woven has high stability and shear stiffness due to reinforcing fiber in the through thickness direction. Braided fiber in compared with other fabrics has low shear resistance, but relatively high drapability. Based on Figure 1.19, it can be conclude that braided preform are more appropriate for complex shapes with varying cross-section such as nozzles and cones (Hybridmat, 2006).
1.6 Textile composite manufacturing process
A wide range of manufacturing processes are available for the textile composite (Baoxing C. and Tsu-Wei C., 1999; (Long A., 2006). The most commonly used process is Resin Transfer Molding (RTM) which enables industry to manufacture net shape parts in closed tooling a shown in Figure 1.20. The main feature of RTM is the injection of the liquid polymer through a dry preform laid in a closed mold. Figure 1.21 depicts an example RTM molding to
produce a complex shaped aerospace structure. The impregnation quality depends on the combination of pressure at which the resin is injected, temperature, resin viscosity, mold cavity shape and preform properties.
Figure 1.20. Typical composite manufacturing process (Simacek P., Advani S.G. and Iobst S.A., 2008)
Many other techniques are derived from this manufacturing method, such as the resin infusion process or Vacuum Assisted Resin Transfer Molding (VARTM) in which resin flows through the mold and impregnates the fibers due to vacuum applied in the outlet. This technique allows the possibility to fabricate various composite components with high performance. As shown in Fig. 1.22, highly complex structures can be produced by using of
VARTM that reducing part-count and off-setting costs with the intermediate assembly stage (Mazumdar S. K., 2002).
(a) (b) (c) (d)
Figure 1.21. Manufacturing process of a landing arm for helicopter NH-90 (Thuis H., 2004) (a) Braided preform (b) assembling of the preform into the mould
(c) RTM setup to inject resin to the mould (d) final product
Figure 1.22. Fabrication of pressure bulkhead using vacuum infusion process (courtesy of Trans-Textil GmbH)
1.6.1 Dependency of resin flow to fabric structure
Prediction of resin flow to produce high quality composite using RTM and VARTM process requires detailed knowledge of preform permeability and the impregnation behavior of the fiber preform materials under compaction.
On the other hand, permeability and flow pattern highly depend on preform structure. Below gives a summary of preform characterisation in terms of thickness, porosity and permeability and their effect on flow pattern.
1.6.2 Effect of preform thickness on flow patterns
During forming process, the fiber volume fraction and the compression applied into the preform are influenced by the preform thickness. Figure 1.23 depicts examples 3D preform with different thickness. Preform thickness has high influence on flow fronts and lag formation (Bekir Y., Murat S. and Murat S., 2009; (Merotte J., Simacek P. and Advani S. G., 2010).
As shown in Figure 1.24, the lag formed in the resin flow front is due to the presence of high permeability on the top surface of the preform. The lag increases with increasing specimen thickness because of the increased volume of resin needed to flow through the thickness and fill greater volume of pores in the preform.
Figure 1.23. Typical example of thin braided and thick woven (100mm) (Luycker E. et al., 2009; (Tong L., Mouritz A.P. and Bannister M.K., 2002)
In order to eliminate the lag phenomena, the infusion process needs to continue until the lagging region is completely impregnated with resin. It should be noted that the flexible vacuum bag in VARTM process and varying pressure inside the mold cavity causes the preform thickness variation and, therefore, the fiber volume fraction of the preform alter during infusion. To produce high quality composite, the permeability of the preform should be examined at varying fiber volume for different case of the variation of compaction pressure.
Figure 1.24. Flow front and formation of resin lag due to high permeability on the preform surface
In the resin transfer molding (RTM) process, the preform architectures, thickness and layup sequence of textile fabrics influence the injection pressure. Occasionally, a small variation in preform thickness can severely influence out of plane permeability and the injection pressure. A reduction in local mold thickness results in local fiber volume fraction increase, which decreases preform permeability, and increasing molding pressure. For instance, a local reduced thickness in a corner of the mold may lead to preform permeability decrease, and consequently, molding pressure increase.
1.6.3 Compressibility of textile fabric
Two phenomena are observed during the preform compaction to achieve high fiber volume and lower porosity. First, the response of dry preform under the compaction loading is not
elastic, and the hysteresis occurs during unloading process. The hysteresis mainly is because of the preform relaxation behavior happened during compression and decompression experiment (Francois R. and Raymond G., 1998). Second, the wet fiber impregnated with resin is compacted more than the dry preform under the identical compression loading due to the effect of resin lubricant.
Before resin impregnation, the dry preform is under vacuum compression. The compression strain highly depends on fibers elastic properties and their slippage at fiber crossover points. After the resin injection, the local pressure applied to the preform drops.
Figure 1.25 represents the typical pressure vs. porosity curve recorded for textile fabric. For dry fabric, there is homogeneous porosity because fabrics are homogeneously compressed. On the contrary, for wet fabric, an inhomogeneous distribution of porosity occurs because of the injection pressure inside the fabric.
Figure 1.25. Compression pressure relationship of biaxial (BD) dry and wet fabric. (Andreas E., 2003)