Article
Effect of Organic Layer Thickness on Black Spruce
Aging Mistakes in Canadian Boreal Forests
Ahmed Laamrani *, Annie DesRochers and Line Blackburn
Institut deR echerche sur les Forêts (IRF), Université du Québec en Abitibi-Témiscamingue (UQAT),
341 Principale N, Amos, QC J9T 2L8, Canada; annie.desrochers@uqat.ca (A.D.); line.blackburn@uqat.ca (L.B.) * Correspondence: ahmed.laamrani@uqat.ca; Tel.: +1-819-732-8809; Fax: +1-819-797-4727
Academic Editor: Timothy A. Martin
Received: 25 November 2015; Accepted: 9 March 2016; Published: 15 March 2016
Abstract: Boreal black spruce (Picea mariana) forests are prone to developing thick organic layers (paludification). Black spruce is adapted to this environment by the continuous development of adventitious roots, masking the root collar and making it difficult to age trees. Ring counts above the root collar underestimate age of trees, but the magnitude of age underestimation of trees in relation to organic layer thickness (OLT) is unknown. This age underestimation is required to produce appropriate age-correction tools to be used in land resource management. The goal of this study was to assess aging errors that are done with standard ring counts of trees growing in sites with different degrees of paludification (OLT; 0–25 cm, 26–65 cm, >65 cm). Age of 81 trees sampled at three geographical locations was determined by ring counts at ground level and at 1 m height, and real age of trees was determined by cross-dating growth rings down to the root collar (root/shoot interface). Ring counts at 1 m height underestimated age of trees by a mean of 22 years (range 13–49) and 52 years (range 14–112) in null to low vs. moderately to highly paludified stands, respectively. The percentage of aging-error explained by our linear model was relatively high (R2adj= 0.71) and showed that OLT class and age at 0-m could be used to predict total aging-error while neither DBH nor geographic location could. The resulting model has important implications for forest management to accurately estimate productivity of these forests.
Keywords: Picea mariana; aging error; adventitious root; cross-dating; paludification; Clay Belt
1. Introduction
Northern Canadian boreal forests provide a broad range of ecosystem services including carbon sequestration, habitat and biodiversity, air and water purification, and regional and global climate regulation. These forests also provide numerous resources for the Forest Industry in Canada such as black spruce (Picea mariana (Mill.) BSP.) wood products, one of the dominant species [1]. Boreal northern black spruce forests are characterized by the development of thick organic layers in regions prone to paludification such as the interior of Alaska, the Canadian Hudson Bay-James Bay lowlands, and Labrador. Paludification is a natural process where organic material accumulates on the ground surface over time, resulting in higher soil moisture levels and elevated water tables [2,3]. These conditions alter forest succession dynamics and favor the invasion of Sphagnum moss species [4–6].
Black spruce trees are well adapted to paludified sites because of the development of an adventitious root system, i.e., the continuous upward development of roots at the base of the stem [7,8]. This capacity of developing adventitious roots constitutes an advantage for the species, allowing it to grow in wet environments since roots damaged by flooding can be replaced by new roots growing near the surface of the organic layer upwards on the stem in drier and more favourable conditions. At maturity, the root system of black spruce trees is often exclusively adventitious [7,8], which means that initial roots fail to develop and disappear with time. Because of this continuous
Forests 2016, 7, 69 2 of 13
development of adventitious roots, it is rather difficult to obtain a tree’s true age, since the root collar of trees (root/shoot interface) and initial growth rings are located under the roots and sometimes even completely missing [7]. This phenomenon has also been observed in white spruce (Picea glauca (Moench) Voss; [9,10], balsam fir (Abies balsamea (L.) Mill.; [11]) and Norway spruce (Picea abies (L.) Karst.; [12]).
From the perspective of sustainable forest management, erroneous age determination can lead to incorrect interpretations of forest dynamics [13–17]. For instance, natural disturbance studies relating pulses of tree establishment to specific events or climate variables need accurate tree ages to correctly interpret data [18,19]. A recent study done in northern Quebec’s black spruce forests showed that 80% of naturally-established commercial stands had been misclassified (underestimated) in terms of age classes, a fundamental indicator of sustainable forest management in Canada [15]. Age underestimation leads to overestimation of forest productivity [20], which is traditionally estimated using the site index (SI) and is the average height of dominant and co-dominant trees at reference age, usually 50 years [21]. SI is widely used in empirical growth and yield models to calculate sustainable allowable harvest levels of commercial species (e.g., [22]). To correctly illustrate the productive potential of a site, suppressed trees or periods of very slow initial growth need to be avoided for SI measurement; this is why age at breast height or at 1 m, it is usually taken as the zero height level [21,22]. Age-correction index can then be used to estimate the time needed for trees to reach breast height or 1 m [22]. Problems in stand dynamics interpretations occur when age adjustments wrongly assume that variability between trees is small, that specific site conditions have little effect on early growth rates, or that growth rates of seedlings are a good reflection of early growth rates of mature trees (sapling method) [23]. For example, the age correction for black spruce from Pothier and Savard [22] would be up to seven years, while DesRochers and Gagnon [7], Vasiliauskas and Chen [20] and Parisien et al. [24] found age underestimations up to 19, 18, and 26 years, respectively. Unlike Pothier and Savard [22] that used the sapling method, the other three studies [7,20,24] evaluated the actual time it took trees to reach 1 m. Moreover, because adventitious roots continue developing over time with the continuous accumulation of organic matter and growth of mosses [8], age underestimation of black spruce trees probably increases with the organic layer thickness (OLT). This would require specific age correction indices for sites with different OLT [24]. However, it is difficult to build age correction tools when the extent of the age under-estimation is unknown. The objective of this study was thus to estimate aging errors that are done with standard ring counts (at 1 m or at ground level) of black spruce trees in relation to the organic layer thickness. We hypothesized that age underestimations would increase with the thickness of the organic layer. Aging error was evaluated on 81 trees growing in sites with different levels of organic matter accumulation by aging trees at 1 m and ground level (0 m), and comparing it to real age by cross-dating growth rings down into the stump to the root collar (root/shoot interface). To our knowledge, no previous study has examined the effect of OLT on aging error of black spruce trees. 2. Methods and Materials
2.1. Study Area
This study was conducted within the western black spruce-feather moss bioclimatic domain [25] in the northwestern boreal forest of Quebec, within the Clay Belt region (Figure1A). The latter is generally characterized by flat plains, which were generated by extensive and thick glaciolacustrine clay deposits that were left behind by pro-glacial Lake Ojibway [26]. Three major soil types are found in the study area, Luvisols, Gleysols, and Organic soils [27]; the mineral soil beneath the organic layer is variable, ranging in composition from clay to till [28–30]. The underlying bedrock is a complex mixture of Precambrian granitic rock types that occasionally appears at the ground surface and form scattered gentle hills across the landscape.
Forests 2016, 7, 69 3 of 13
Forests 2016, 7, 69 3 of 13
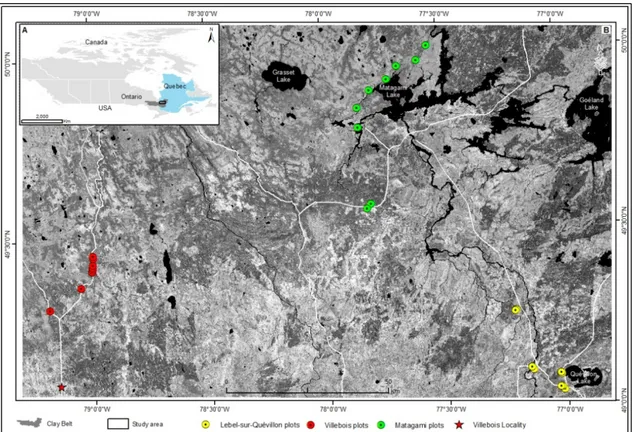
Figure 1. (A) study area in the Clay Belt region; (B) sampling plots sites along three locations Matagami (green dots), Lebel‐sur‐Quévillon (yellow dots), and Villebois (red dots) on a black and white Landsat satellite image that covers the investigated area.
Black spruce is the most dominant species in the studied area, followed by jack pine (Pinus banksiana Lamb.). Other species such as eastern larch or tamarack (Larix laricina (Du Roi) K. Koch), balsam fir and trembling aspen (Populus tremuloides Michx.) cover a small portion of the studied area. The understory is mainly composed of Sphagnum spp., feather mosses (principally
Pleurozium schreberi [Brid.] Mitten), and shrubs (mainly ericaceous species) with variable coverage.
Fire is the most important natural disturbance in the investigated area [31]. The climate is characterized by long cold winters (November–April) and short rainy summers. Mean annual temperature is −0.7 C, and total annual precipitation is about 906 mm [32].
2.2. Site Selection
Sites were selected in three general locations (Matagami, Lebel‐sur‐Quévillon; and Villebois; Figure 1B), dispersed along a west‐east gradient within forest of the western black spruce‐feather moss bioclimatic domain. These three locations will henceforth be referred to in this study as M, Q and V, for Matagami, Lebel‐sur‐Quévillon; and Villebois, respectively (Table 1). In each location, measurements from three replicate plots were done in each of three stands having different OLT corresponding to one of three categories of increasing paludification: null to low (0–25 cm); low to moderate (26–65 cm); and high (>65 cm); this classification scheme was inspired by previous studies over the Clay Belt region [28,29,33]. These three classes (0–25 cm; 26–65 cm; and >65 cm) are thereafter referred to as OLT classes A, B and C, respectively. Nine circular sampling plots of 400 m2 were thus established in each of the three locations (M, Q and V), for a total of twenty‐seven plots (Table 1). The latter were chosen on the basis of their fire origin, accessibility to roads (maximum of 100 m from roads), their black spruce dominated overstory (>75% in composition), their feather moss or Sphagnum understory dominated, and their clayey mineral soil composition. Positions of each central plot location were recorded using GPS with metric level positioning accuracy.
Figure 1.(A) study area in the Clay Belt region; (B) sampling plots sites along three locations Matagami (green dots), Lebel-sur-Quévillon (yellow dots), and Villebois (red dots) on a black and white Landsat satellite image that covers the investigated area.
Black spruce is the most dominant species in the studied area, followed by jack pine (Pinus banksiana Lamb.). Other species such as eastern larch or tamarack (Larix laricina (Du Roi) K. Koch), balsam fir and trembling aspen (Populus tremuloides Michx.) cover a small portion of the studied area. The understory is mainly composed of Sphagnum spp., feather mosses (principally Pleurozium schreberi [Brid.] Mitten), and shrubs (mainly ericaceous species) with variable coverage. Fire is the most important natural disturbance in the investigated area [31]. The climate is characterized by long cold winters (November–April) and short rainy summers. Mean annual temperature is ´0.70C, and total annual precipitation is about 906 mm [32].
2.2. Site Selection
Sites were selected in three general locations (Matagami, Lebel-sur-Quévillon; and Villebois; Figure1B), dispersed along a west-east gradient within forest of the western black spruce-feather moss bioclimatic domain. These three locations will henceforth be referred to in this study as M, Q and V, for Matagami, Lebel-sur-Quévillon; and Villebois, respectively (Table1). In each location, measurements from three replicate plots were done in each of three stands having different OLT corresponding to one of three categories of increasing paludification: null to low (0–25 cm); low to moderate (26–65 cm); and high (>65 cm); this classification scheme was inspired by previous studies over the Clay Belt region [28,29,33]. These three classes (0–25 cm; 26–65 cm; and >65 cm) are thereafter referred to as OLT classes A, B and C, respectively. Nine circular sampling plots of 400 m2were thus established in each of the three locations (M, Q and V), for a total of twenty-seven plots (Table1). The latter were chosen on the basis of their fire origin, accessibility to roads (maximum of 100 m from roads), their black spruce dominated overstory (>75% in composition), their feather moss or Sphagnum understory dominated, and their clayey mineral soil composition. Positions of each central plot location were recorded using GPS with metric level positioning accuracy.
Forests 2016, 7, 69 4 of 13
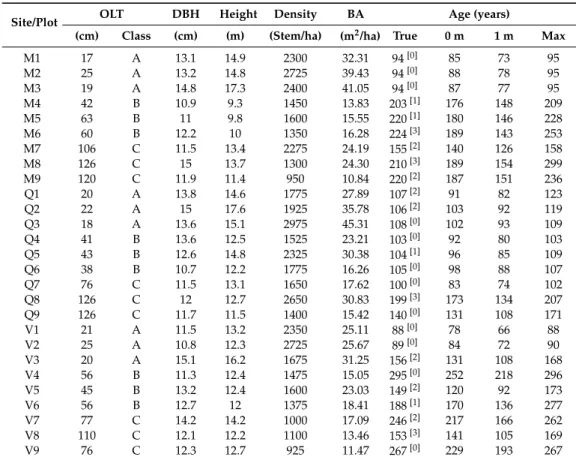
Table 1.Summary of measured and estimated variables within each of the investigated plots.
Site/Plot OLT DBH Height Density BA Age (years)
(cm) Class (cm) (m) (Stem/ha) (m2/ha) True 0 m 1 m Max
M1 17 A 13.1 14.9 2300 32.31 94[0] 85 73 95 M2 25 A 13.2 14.8 2725 39.43 94[0] 88 78 95 M3 19 A 14.8 17.3 2400 41.05 94[0] 87 77 95 M4 42 B 10.9 9.3 1450 13.83 203[1] 176 148 209 M5 63 B 11 9.8 1600 15.55 220[1] 180 146 228 M6 60 B 12.2 10 1350 16.28 224[3] 189 143 253 M7 106 C 11.5 13.4 2275 24.19 155[2] 140 126 158 M8 126 C 15 13.7 1300 24.30 210[3] 189 154 299 M9 120 C 11.9 11.4 950 10.84 220[2] 187 151 236 Q1 20 A 13.8 14.6 1775 27.89 107[2] 91 82 123 Q2 22 A 15 17.6 1925 35.78 106[2] 103 92 119 Q3 18 A 13.6 15.1 2975 45.31 108[0] 102 93 109 Q4 41 B 13.6 12.5 1525 23.21 103[0] 92 80 103 Q5 43 B 12.6 14.8 2325 30.38 104[1] 96 85 109 Q6 38 B 10.7 12.2 1775 16.26 105[0] 98 88 107 Q7 76 C 11.5 13.1 1650 17.62 100[0] 83 74 102 Q8 126 C 12 12.7 2650 30.83 199[3] 173 134 207 Q9 126 C 11.7 11.5 1400 15.42 140[0] 131 108 171 V1 21 A 11.5 13.2 2350 25.11 88[0] 78 66 88 V2 25 A 10.8 12.3 2725 25.67 89[0] 84 72 90 V3 20 A 15.1 16.2 1675 31.25 156[2] 131 108 168 V4 56 B 11.3 12.4 1475 15.05 295[0] 252 218 296 V5 45 B 13.2 12.4 1600 23.03 149[2] 120 92 173 V6 56 B 12.7 12 1375 18.41 188[1] 170 136 277 V7 77 C 14.2 14.2 1000 17.09 246[2] 217 166 262 V8 110 C 12.1 12.2 1100 13.46 153[3] 141 105 169 V9 76 C 12.3 12.7 925 11.47 267[0] 229 193 267
M1-9, Q1-9 and V1-9 = 9 sampling plots of each location: Matagami, Quévillon, and Villebois. DBH = diameter at the breast height, measured for each tree with a diameter >9 cm within each plot, and then a mean DBH was calculated for each plot. Height and Agertrue, 0m, 1msare the respective average of the three selected trees within each plot. True age = the root collar age (if found) or the oldest growth ring found from the stump. The number in brackets is the number of trees with missing root collars within plots. For instance, the superscripted markers[0]indicates that none of the three selected trees of plot is missing root collar. OLT classes = A: 26–65 cm; B: 0–25 cm; C: >65 cm. Density = the number of trees measured per plot, and converted to stems/ha. BA = total basal area of all the trees of each plot, divided by the plot area and converted to m2/ha.
2.3. Field Measurements and Sample Processing
In each plot, mean OLT was measured by probing with an auger within a 1 m2quadrat located in each cardinal direction and in the plot center. OLT measurements from the five locations were then averaged to provide a single OLT measure per sampling plot. Thickness of the organic material was taken as the distance between the organic layer surface and mineral soil interface. In most cases, the transition between organic layer and mineral soil was clearly marked by an obvious change in colour and texture, as shown in Laamrani et al. [30]; Figure2. Organic layers from the same area [30] were classified into one of the three different horizons (Of, Om, and Oh) based on the Canadian system of soil classification [30]. The authors [30] found that the Of, Om and Oh horizons were present in all the investigated soil pits in varying amounts, and that most Of thicknesses ranged between 10 to 15 cm in low-moderately paludified sites and greater than 20 cm in highly paludified sites.
In each plot, a set of vegetation variables were recorded following forest inventory guidelines of the Quebec Ministry of Natural Resources (MRNQ; [34]). Diameter at breast height (DBH, 1.3 m), status (alive or dead), and species were recorded for each tree with a diameter >9 cm. Subsets of three live black spruce trees (dominant and co-dominant trees) per plot were selected for age and total height measurement (Figure3A). Tree selection was done in such way that the first tree was chosen among the four largest living trees of each plot; the second was chosen to be representative of the average DBH tree recorded within each plot; and the third was selected from all the listed trees within each plot using the quadratic mean, which was calculated by dividing the total number of trees in each plot
Forests 2016, 7, 69 5 of 13
by two. The result was then rounded to the nearest whole number and was considered the rank of the tree. A total of 81 selected trees were cut down with a chain saw in a way that the stump was lifted out of the ground by the weight of the falling stem by first cutting off the main lateral roots that provide most of the structural support (Figure3B,C) and pushing down on the stem (Figure3D). Total height (m) of each selected tree was then measured using a tape measure.
Forests 2016, 7, 69 7 of 13
inflation factors), normality of the data (Shapiro–Wilk test), and equal error variance (homoscedasticity, Levene’s test) of the linear models were satisfied. All statistical analyses were performed using R [40]. 3. Results True age of sampled trees varied from 87 to 299 years, while age measured at 1 m ranged 62–218 years (Table 2), which resulted in an average age difference of 44 years (range 13–112) between the true age (at the root collar) and the reference age (at 1 m). This age difference could be considered conservative since the root collar was missing from the stump of 30 trees out of the 81 sampled (37%). In these cases, the age from the last fire or the oldest growth ring found were used as true age even if it was known that they were older than that for the oldest growth ring. Overall, trees growing on thicker organic layers (OLT classes B and C), had greater aging errors than trees on shallower organic layers (OLT class A; Table 2). For OLT class A, mean total aging error (22 ± 3.5 years; mean ± SE) significantly differed from the other two classes (Tukey’s HSD, p < 0.001; Figure 3), while mean total aging error for OLT classes B and C were similar (Tukey’s HSD; 54 ± 3.4 years, mean (B+C) ± SE; p > 0.05; Figure 3). Mean organic layer thickness collected across all plot varied between 17 and 126 cm (Table 1). Measured values of OLT at each sampling plot were log transformed to evaluate the effect of OLT on mean total aging error (Figure 4). OLT was significantly positively correlated (r = 0.60, R2 = 0.36,
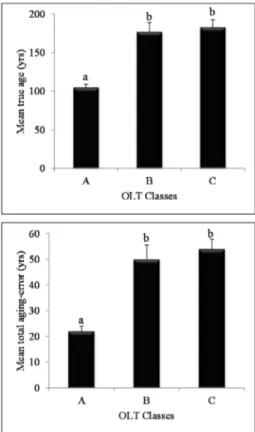
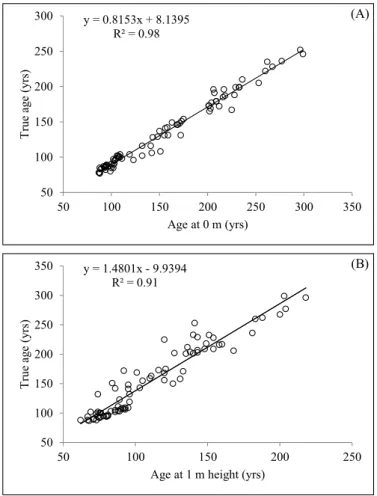
p < 0.001) to total aging error. True age of trees was highly correlated to age at 0 m or 1 m height (R2 = 0.98 and R2 = 0.91, respectively; Figure 5a,b). DBH of the sampled trees ranged 9.1–233.6 cm, whereas height varied from 9.2 to 18.8 m (Table 2). Mean DBH and height of trees were larger for Class A (15.5 ± 0.7 cm and 15.1 ± 0.4 m, respectively), even though they were younger on average (Table 2). Figure 3. Mean true age (upper graph) and total aging error (lower graph) for the three organic layer thickness classes ((A) ≤ 25 cm; (B) = 26–65 cm; (C) >65 cm). Error bars indicate the standard error of the mean; different letters designate statistically significant (p < 0.05) differences using Tukey tests.
Figure 2.Mean true age (upper graph) and total aging error (lower graph) for the three organic layer thickness classes ((A) ď 25 cm; (B) = 26–65 cm; (C) >65 cm). Error bars indicate the standard error of the mean; different letters designate statistically significant (p < 0.05) differences using Tukey tests.
Cross-sections were collected at 0 m (ground level) and 1 m height. Cross-sections of the stumps were made at 2 cm intervals [7] with a Wood-Mizer ™ portable sawmill (Figure3E,F) in order to allow cross-dating and retracing the root collar (interface root/stem) to obtain the real age of trees. Cross sections were finely sanded until xylem cells were visible under a binocular microscope. The root collar was identified by the shift from the presence of a pith (stem) to a central vascular cylinder (root) [35]. The visibility of very tight rings was increased by cutting the surface of the wood with a sharp razor blade and applying white chalk to increase the contrast of wood cells. Because of the high likelihood of missing rings beneath ground level, stump cross-sections were visually cross-dated using the skeleton plot method [36,37], starting from the ground level section to the deepest section underground until the root collar was found. When the root collar was missing, we used a proxy for true age which was age of the last forest fire +1 year, since black spruce establishes rapidly after fire [18]. If the age of the last fire was not known, the age of the oldest tree in the plot was used under the assumption that the trees are older than the age indicated by last ring measured from the oldest tree. Both oldest ring and last fire ages are thereafter referred to as true age or root collar age.
Forests 2016, 7, 69 6 of 13
Forests 2016, 7, 69 6 of 13
were summed and converted to provide an estimate of total merchantable wood volume per hectare (m3∙ha−1).
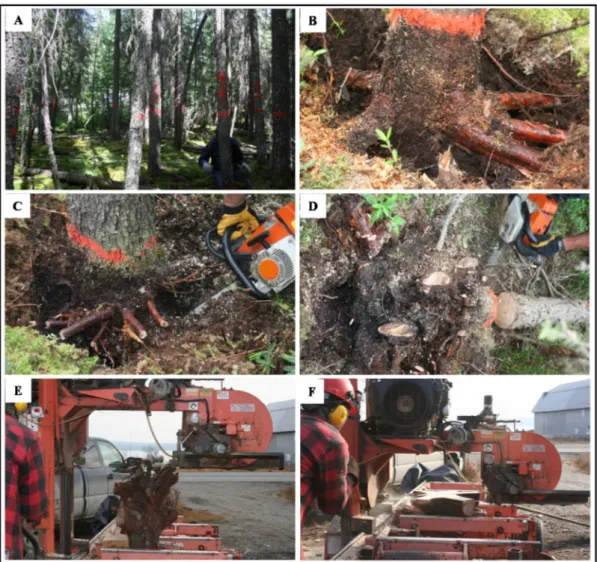
Figure 2. Photographs of the study area and sample processing. At each sampled plot, dominant and co‐dominant trees were selected; (A) the main lateral roots that provide most of the structural support were cut off (B,C), pushing down on them, so that the stump gets lifted out of the ground by the weight of the falling stem (D); and cross‐sections of the stumps were made at each 2 cm with a Wood‐Mizer ™ portable sawmill for cross‐dating and retracing the root collar (interface root/stem) (E,F).
2.4. Statistical Analysis
A linear model was fitted with aging error as response and subsets of the available data as potential predictor variables. A linear model fit was performed using the l m function [39] to evaluate the relationship between aging error and a set of explanatory variables such as organic layer thickness, age at 0 and 1 m height, sampling location, DBH and tree height. Organic layer thickness (OLT) was first used in the model as a continuous variable. In a second step, relationship between aging error and OLT class were explored. Post hoc Tukey Honest Significant Difference (HSD) tests were carried out to compare means when a significant ANOVA main effect or interaction was encountered for a given variable. Statistical significance of the selected predictor variables and the whole model were evaluated and declared significant at a level of α = 0.05. Pearson product moment correlations (r) were used to explore the strength of the relationship between total aging error and OLT. Adjusted R‐squared (R2adj) was also used to evaluate how well the model was able to predict total aging error. The use of R2adj is intended to partially compensate for a model overfit, and it is always lower than R2. Assumptions regarding the lack of multicollinearity (variance
Figure 3.Photographs of the study area and sample processing. At each sampled plot, dominant and co-dominant trees were selected; (A) the main lateral roots that provide most of the structural support were cut off (B,C), pushing down on them, so that the stump gets lifted out of the ground by the weight of the falling stem (D); and cross-sections of the stumps were made at each 2 cm with a Wood-Mizer ™ portable sawmill for cross-dating and retracing the root collar (interface root/stem) (E,F).
Once age at the root collar was determined, it was used to calculate total aging-error values. The latter was calculated as the root collar age (represents the true age of a specific tree; [7]) minus the age obtained at 1 m tree height (reference age in productivity equations; i.e., [22]). In addition to total aging-error (∆ Age[Total]; Table2), error aging at 0 m (∆ Age[0m]; Table2) was also calculated by subtracting total age (age at collar) from that found at ground level (age at 0 m).
Other stand variables such as stand density, basal area, and volume were also calculated. Density was calculated as the number of stems per plot, then converted to stem per hectare (stems ha´1). Total basal area of each plot was calculated by adding the basal areas of all the measured trees within a 400 m2area (plot) and converting to m2¨ha´1. Merchantable volume of each individual tree was calculated using its DBH and height values according to a local standardized merchantable volume that was found in published tariff tables [38]. Tree merchantable volumes from the same plot were summed and converted to provide an estimate of total merchantable wood volume per hectare (m3¨ha´1).
Forests 2016, 7, 69 7 of 13
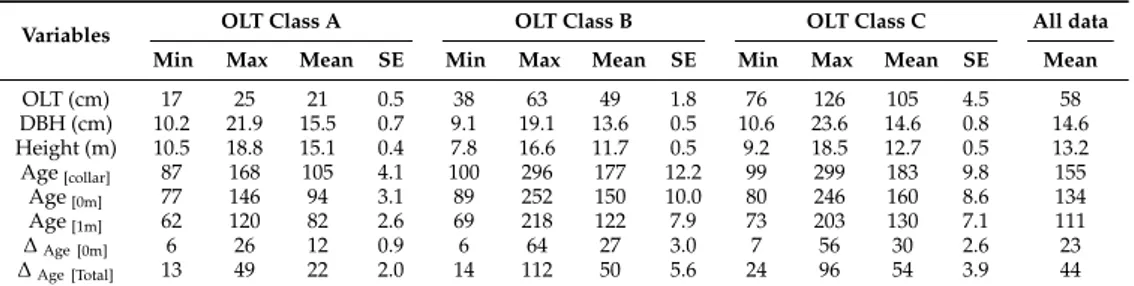
Table 2.Summary statistics for the variables measured or calculated in this study.
Variables OLT Class A OLT Class B OLT Class C All data
Min Max Mean SE Min Max Mean SE Min Max Mean SE Mean
OLT (cm) 17 25 21 0.5 38 63 49 1.8 76 126 105 4.5 58 DBH (cm) 10.2 21.9 15.5 0.7 9.1 19.1 13.6 0.5 10.6 23.6 14.6 0.8 14.6 Height (m) 10.5 18.8 15.1 0.4 7.8 16.6 11.7 0.5 9.2 18.5 12.7 0.5 13.2 Age[collar] 87 168 105 4.1 100 296 177 12.2 99 299 183 9.8 155 Age[0m] 77 146 94 3.1 89 252 150 10.0 80 246 160 8.6 134 Age[1m] 62 120 82 2.6 69 218 122 7.9 73 203 130 7.1 111 ∆Age [0m] 6 26 12 0.9 6 64 27 3.0 7 56 30 2.6 23 ∆Age [Total] 13 49 22 2.0 14 112 50 5.6 24 96 54 3.9 44
Notes: All data (n = 81). SE refers to standard error. OLT: organic layer thickness. OLT Class: A (0–25 cm), B (26–65 cm), and C (>65 cm). DBH: diameter at breast height (1.3 m). Age[collar, 0m]: age estimated at collar and 0 m (ground level), respectively.∆Age [Total, 0m]refers to total aging-error and aging-error at 0 m tree height, respectively; values were calculated as the ages measured at root collar and at 0 m (ground level) minus that calculated at 1 m, respectively.
2.4. Statistical Analysis
A linear model was fitted with aging error as response and subsets of the available data as potential predictor variables. A linear model fit was performed using the l m function [39] to evaluate the relationship between aging error and a set of explanatory variables such as organic layer thickness, age at 0 and 1 m height, sampling location, DBH and tree height. Organic layer thickness (OLT) was first used in the model as a continuous variable. In a second step, relationship between aging error and OLT class were explored. Post hoc Tukey Honest Significant Difference (HSD) tests were carried out to compare means when a significant ANOVA main effect or interaction was encountered for a given variable. Statistical significance of the selected predictor variables and the whole model were evaluated and declared significant at a level of α = 0.05. Pearson product moment correlations (r) were used to explore the strength of the relationship between total aging error and OLT. Adjusted R-squared (R2adj) was also used to evaluate how well the model was able to predict total aging error. The use of R2adjis intended to partially compensate for a model overfit, and it is always lower than R2. Assumptions regarding the lack of multicollinearity (variance inflation factors), normality of the data (Shapiro–Wilk test), and equal error variance (homoscedasticity, Levene’s test) of the linear models were satisfied. All statistical analyses were performed using R [40].
3. Results
True age of sampled trees varied from 87 to 299 years, while age measured at 1 m ranged 62–218 years (Table2), which resulted in an average age difference of 44 years (range 13–112) between the true age (at the root collar) and the reference age (at 1 m). This age difference could be considered conservative since the root collar was missing from the stump of 30 trees out of the 81 sampled (37%). In these cases, the age from the last fire or the oldest growth ring found were used as true age even if it was known that they were older than that for the oldest growth ring. Overall, trees growing on thicker organic layers (OLT classes B and C), had greater aging errors than trees on shallower organic layers (OLT class A; Table2). For OLT class A, mean total aging error (22 ˘ 3.5 years; mean ˘ SE) significantly differed from the other two classes (Tukey’s HSD, p < 0.001; Figure2), while mean total aging error for OLT classes B and C were similar (Tukey’s HSD; 54 ˘ 3.4 years, mean (B+C) ˘ SE; p > 0.05; Figure2).
Mean organic layer thickness collected across all plot varied between 17 and 126 cm (Table1). Measured values of OLT at each sampling plot were log transformed to evaluate the effect of OLT on mean total aging error (Figure4). OLT was significantly positively correlated (r = 0.60, R2 = 0.36, p < 0.001) to total aging error. True age of trees was highly correlated to age at 0 m or 1 m height (R2= 0.98 and R2 = 0.91, respectively; Figure 5a,b). DBH of the sampled trees ranged 9.1–233.6 cm, whereas height varied from 9.2 to 18.8 m (Table2). Mean DBH and height of trees were
Forests 2016, 7, 69 8 of 13
larger for Class A (15.5 ˘ 0.7 cm and 15.1 ˘ 0.4 m, respectively), even though they were younger on average (Table2).
Forests 2016, 7, 69 8 of 13
Figure 4. Relationship between total aging error and organic layer thickness. Blue, red and green dots represent OLT classes A, B, and C, respectively.
Figure 5. Relationship between true age (root collar age) and ages obtained at 0 m (A) and at 1 m (B) tree height. R‐squared values and equations are displayed on each graph. 3.1. Using Linear Models to Predict Total Aging Error The selected linear model to predict total aging error included total aging error (ErrTot) as the response variable and OLT, age at 0 m (Age0m) and their interaction, DBH and geographic location (GeoLoc) as potential predictor variables. Tree height was not included in the selected model because it was found highly correlated to DBH. The percentage of total aging error explained by our model (ErrTot ~ OLT + Age0m + OLT: Age0m + DBH + GeoLoc) was relatively high (R2adj = 0.71). Neither DBH nor geographic location could explain aging error (p > 0.05). When tree height was
0 20 40 60 80 100 120 1.00 1.20 1.40 1.60 1.80 2.00 2.20 T ota l a gin g er ro r (y rs ) Log (OLT) R2= 0.36 y = 0.8153x + 8.1395 R² = 0.98 50 100 150 200 250 300 50 100 150 200 250 300 350 Tr ue a ge ( yr s) Age at 0 m (yrs) y = 1.4801x - 9.9394 R² = 0.91 50 100 150 200 250 300 350 50 100 150 200 250 Tr ue a ge (y rs )
Age at 1 m height (yrs)
(A)
(B)
Figure 4.Relationship between total aging error and organic layer thickness. Blue, red and green dots represent OLT classes A, B, and C, respectively.
Forests 2016, 7, 69 8 of 13
Figure 4. Relationship between total aging error and organic layer thickness. Blue, red and green dots represent OLT classes A, B, and C, respectively.
Figure 5. Relationship between true age (root collar age) and ages obtained at 0 m (A) and at 1 m (B) tree height. R‐squared values and equations are displayed on each graph. 3.1. Using Linear Models to Predict Total Aging Error The selected linear model to predict total aging error included total aging error (ErrTot) as the response variable and OLT, age at 0 m (Age0m) and their interaction, DBH and geographic location (GeoLoc) as potential predictor variables. Tree height was not included in the selected model because it was found highly correlated to DBH. The percentage of total aging error explained by our model (ErrTot ~ OLT + Age0m + OLT: Age0m + DBH + GeoLoc) was relatively high (R2adj = 0.71). Neither DBH nor geographic location could explain aging error (p > 0.05). When tree height was
0 20 40 60 80 100 120 1.00 1.20 1.40 1.60 1.80 2.00 2.20 T ota l a gin g er ro r (y rs ) Log (OLT) R2= 0.36 y = 0.8153x + 8.1395 R² = 0.98 50 100 150 200 250 300 50 100 150 200 250 300 350 Tr ue a ge ( yr s) Age at 0 m (yrs) y = 1.4801x - 9.9394 R² = 0.91 50 100 150 200 250 300 350 50 100 150 200 250 Tr ue a ge (y rs )
Age at 1 m height (yrs)
(A)
(B)
Figure 5.Relationship between true age (root collar age) and ages obtained at 0 m (A) and at 1 m (B) tree height. R-squared values and equations are displayed on each graph.
Using Linear Models to Predict Total Aging Error
The selected linear model to predict total aging error included total aging error (ErrTot) as the response variable and OLT, age at 0 m (Age0m) and their interaction, DBH and geographic location
Forests 2016, 7, 69 9 of 13
(GeoLoc) as potential predictor variables. Tree height was not included in the selected model because it was found highly correlated to DBH. The percentage of total aging error explained by our model (ErrTot ~ OLT + Age0m + OLT: Age0m + DBH + GeoLoc) was relatively high (R2adj= 0.71). Neither DBH nor geographic location could explain aging error (p > 0.05). When tree height was used in the selected model instead of DBH, the same trend was observed, showing that tree height had no effect on aging error (p = 0.4). On the other hand, results showed that OLT and age at 0 m significantly affected total aging error. Consequently, a final linear model that includes only OLT and Age 0m and their interaction as predictor variables (ErrTot ~ OLT + Age0m + OLT: Age0m) was fitted (p < 0.001; Table3a). This model showed that sites with the greatest OLT (highly paludified sites) had the oldest trees. The following regression equation was estimated for our final model: YErrTot= ´36.765 + 0.441 XOLT+ 0.601XAge0m´0.003 XOLT* XAge0m.
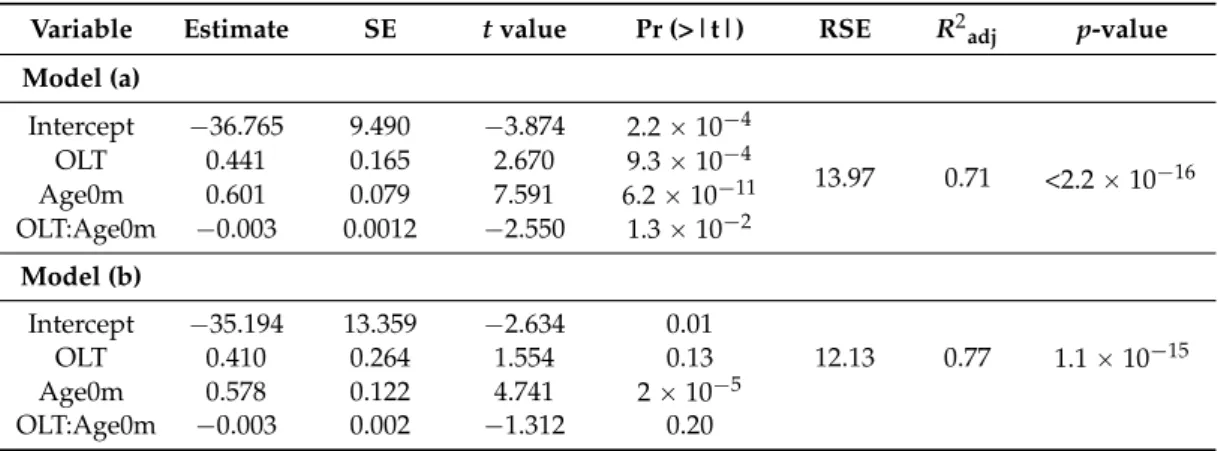
Table 3.Linear regression model analyses used to predict total aging error for (a) the entire dataset and (b) only for trees with an identified root collar.
Variable Estimate SE t value Pr (>|t|) RSE R2adj p-value
Model (a) Intercept ´36.765 9.490 ´3.874 2.2 ˆ 10´4 13.97 0.71 <2.2 ˆ 10´16 OLT 0.441 0.165 2.670 9.3 ˆ 10´4 Age0m 0.601 0.079 7.591 6.2 ˆ 10´11 OLT:Age0m ´0.003 0.0012 ´2.550 1.3 ˆ 10´2 Model (b) Intercept ´35.194 13.359 ´2.634 0.01 OLT 0.410 0.264 1.554 0.13 12.13 0.77 1.1 ˆ 10´15 Age0m 0.578 0.122 4.741 2 ˆ 10´5 OLT:Age0m ´0.003 0.002 ´1.312 0.20
Linear model expression: ErrTot ~ OLT + Age0m + OLT: Age0m. Model (a) equation: YErrTot = ´36.765 + 0.441 XOLT+ 0.601XAge0m´0.003 XOLT* XAge0m. ErrTot = total aging error. Age0m = age at 0 m. OLT: Age0m = interaction between OLT and Age0 m. SE = Standard error. RSE: Residual standard error. R2
adj: Adjusted R-squared. Sample size n = 81 and n = 51 for models (a) and (b), respectively.
Since age of trees was somewhat amalgamated with OLT, we tested the same model using only trees with comparable ages from the three OLT (87–111 years; n = 34), which showed that OLT still had a significant effect on total aging error (p < 0.001). We also tested the final model with only trees that had had their root collar identified (n = 51). This slightly improved the coefficient of determination value (R2adj= 0.77; Table3b); however, because trees missing the root collar were mostly in the oldest sites with thicker OLT, this reduced the variability in OLT thickness which then became non-significant. The relationship between total aging error and age at 0 m for the entire dataset or for the dataset only containing trees with identified root collars are shown in Figure6a,b, respectively.
There was a significant interaction between OLT and age at 0 m (Table3), suggesting that age at 0 m effect on aging error might differ for each OLT class. The effect of age at 0 m on total aging error was thus evaluated for each OLT class by plotting total aging error against age at 0 m and comparing slopes of the regression lines (Classes A vs. B, A vs. C, and B vs. C). Results are presented in Table4 and show that slopes were equal for the three OLT classes (p = 0.82 for A vs. B; p = 0.63 for A vs. C; and p = 0.28 for B vs. C). Therefore, we concluded that the biological significance of this interaction was negligible.
Forests 2016, 7, 69 10 of 13
Forests 2016, 7, 69 10 of 13
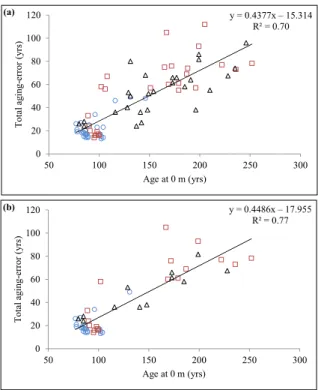
Figure 6. Relationship between total aging error and age at 0 m with (a) all sampled trees (n = 81) and
(b) only trees with root collar present (n = 51). Blue circle, red square, and black triangle symbols represent data belonging to OLT classes A, B, and C (representing the three paludification classes), respectively.
Table 4. Comparison of slopes for the total aging error and age at 0 m for three organic layer
thickness (OLT) Classes.
Class OLT Slopes Test Statistic
Std. Error t‐Value df α t‐Crit p‐Value
A vs B 0.115 0.202 50 0.05 2.009 0.84
A vs C 0.118 0.480 50 0.05 2.011 0.63
B vs C 0.094 1.091 50 0.05 2.009 0.28
Note: Std. error = standard error of the difference in slopes. df = degrees of freedom. t = t‐value. t‐crit = critical t‐value. Significance level at a level of α = 0.05. 4. Discussion Results of this study demonstrated that the age of black spruce trees growing on the Clay Belt was considerably underestimated by a ring count at 1 m or at ground level (0 m). An average aging error of 22 years (representing the difference between the true age and age at 1 m) was located below 1 m height and under the organic layer in no‐ to low‐paludified plots (OLT < 25 cm), while aging error averaged 52 years for moderately or highly paludified sites (mean OLT of 49 and 106 cm, respectively), up to a 112 year difference between true age and age at 1 m height. These results for the non paludified sites are consistent with [7], who found age underestimations of up to 20 years in black spruce. Thus, age of black spruce cannot be accurately obtained by sampling trees at ground level (or higher up the stem) and age is further underestimated at sites where there has been significant organic matter accumulation. For instance, there was an up to 64 year difference between true age and that obtained at ground level in the highly paludified sites (OLT, class C), with the difference probably greater since most of the 30 stumps where the root collar was absent were found among the trees growing in these sites. New wood layers (growth rings) do not form on buried parts y = 0.4377x – 15.314 R² = 0.70 0 20 40 60 80 100 120 50 100 150 200 250 300 T ota l ag ing -e rror (y rs ) Age at 0 m (yrs) y = 0.4486x – 17.955 R² = 0.77 0 20 40 60 80 100 120 50 100 150 200 250 300 Tota l a ging -e rror (y rs) Age at 0 m (yrs) (a) (b)
Figure 6. Relationship between total aging error and age at 0 m with (a) all sampled trees (n = 81) and (b) only trees with root collar present (n = 51). Blue circle, red square, and black triangle symbols represent data belonging to OLT classes A, B, and C (representing the three paludification classes), respectively.
Table 4.Comparison of slopes for the total aging error and age at 0 m for three organic layer thickness (OLT) Classes.
Class OLT Slopes Test Statistic
Std. Error t-Value df α t-Crit p-Value
A vs B 0.115 0.202 50 0.05 2.009 0.84
A vs C 0.118 0.480 50 0.05 2.011 0.63
B vs C 0.094 1.091 50 0.05 2.009 0.28
Note: Std. error = standard error of the difference in slopes. df = degrees of freedom. t = t-value. t-crit = critical t-value. Significance level at a level of α = 0.05.
4. Discussion
Results of this study demonstrated that the age of black spruce trees growing on the Clay Belt was considerably underestimated by a ring count at 1 m or at ground level (0 m). An average aging error of 22 years (representing the difference between the true age and age at 1 m) was located below 1 m height and under the organic layer in no- to low-paludified plots (OLT < 25 cm), while aging error averaged 52 years for moderately or highly paludified sites (mean OLT of 49 and 106 cm, respectively), up to a 112 year difference between true age and age at 1 m height. These results for the non paludified sites are consistent with [7], who found age underestimations of up to 20 years in black spruce. Thus, age of black spruce cannot be accurately obtained by sampling trees at ground level (or higher up the stem) and age is further underestimated at sites where there has been significant organic matter accumulation. For instance, there was an up to 64 year difference between true age and that obtained at ground level in the highly paludified sites (OLT, class C), with the difference probably greater since most of the 30 stumps where the root collar was absent were found among the trees growing in these sites. New wood layers (growth rings) do not form on buried parts of stems [7], which probably make them prone to rotting and results in the root collar being missing from the stump wood.
Forests 2016, 7, 69 11 of 13
Age underestimations with ring counts at ground level or at 1 m height have also been found for other species forming adventitious roots such as white spruce [9,10], balsam fir [11], and Norway spruce [12]. These authors found age underestimations up to 37, 13, 20, and 26 and years, respectively.
Mean age underestimations from this study (22, 50, and 54 years for OLT classes A, B, and C, respectively) are much greater than age corrections proposed by [22] as standard correction factors (one to seven years, in richest to poorest sites, respectively) for the province of Quebec. These values were estimated from the average time that seedlings reach 1 m height in a plantation (sapling method; [17]). However, this method does not consider the fact that the development of adventitious roots at the base of trees [8] with the accumulation of organic matter with time and/or paludification, growth rings (years) that are concealed in the stump wood of mature trees [7,41] must also be added. When the age of trees is then used to estimate productivity (SI; Site Index), such a gap between true age and estimated age may lead to grossly biased forest management decisions [15] and misinterpretation of stand dynamics [17]. Since annual allowable cuts are based on how long trees take to grow to a certain size [22], age underestimation automatically leads to overestimation of available volumes in the future and overexploitation of the resource. Uncorrected mean tree age is thus a misleading indicator of ecological and economical sustainability [15].
Determination of true age was impossible for 37% of trees due to the fact that they had missing root collars. The model fitted without these 30 trees had an improved power (R2adj= 0.77), but because these trees were mostly in the oldest sites with thicker OLTs, it reduced the range in OLT thicknesses which became a non-significant factor to explain aging error. A better way would have been to assign the fire age to the trees with missing root collars, since black spruce establishes rapidly after fire (1–3 years) [18]. However, established fire maps were not available for the entire study area.
We showed that the use of tree size (DBH or height) was not a good predictor of true age or aging error; such that one cannot assume that large trees are less likely to have underestimated ages or that they are older than smaller trees. The gain in DBH and height of trees from class A OLT was most likely caused by site conditions (i.e., non-paludified class A vs. paludified classes B and C). Although often used as a proxy for age, it is not uncommon that age and tree size are uncorrelated [42]. Since geographical location was not a significant factor in the model predicting aging error, results of this study are applicable to the whole area within the Clay Belt.
5. Conclusions
In conclusion, this study demonstrated that significant aging errors introduced using ring counts at ground level (often considered as the root collar) or 1 m height for black spruce trees growing in null to highly paludified sites. This is the first study showing that aging error increased with the degree of paludification. Determination of true age as described provided more accurate tree age measurements than ring counts at ground level or 1 m height and will allow better estimation of productivity of black spruce forests. True age can be obtained using equations from this study or by adding the average age difference between true age and age at 1 m height for low paludified and moderate to highly paludified sites. This study also highlighted the need to adjust empirical growth and yield models (based on age at 1 m or breast height) to calculate sustainable allowable harvest levels of commercial species forming adventitious roots such as black and white spruces, balsam fir, and Norway spruce. Acknowledgments: This research was supported by the Natural Sciences and Engineering Research Council of Canada (NSERC), and the NSERC-UQAT-Université du Québec à Montréal (UQAM) Chair in Sustainable Forest Management, Tembec Incorporated, and the Regional Conference of Elected Representatives of James Bay through the Programme de participation régionale à la mise en valeur des forêts-Quebec Ministry of Natural Resources. The authors gratefully acknowledge all the people who assisted with fieldwork, Marc Mazerolle from the UQAT and Centre d’étude de la forêt (CEF) for constructive discussions about the statistical analyses, and Natalie Feisthauer from Agriculture and Agri-Food Canada, Science and Technology Branch, who revised the English and helped to improve the quality of this manuscript. The authors are grateful to the editor and three anonymous reviewers for their helpful comments, which greatly improved an earlier version of the manuscript.
Forests 2016, 7, 69 12 of 13
Author Contributions: All authors contributed substantially to the work reported here. The three authors participated in the conception and design of the study. Ahmed Laamrani participated in the field data acquisition, analyzed the data and wrote the manuscript. Annie DesRochers provided substantial contributions in the collection, analyses, or interpretation of data and to the written manuscript. Line Blackburn performed the sample collection, tree ring analysis; analysis of data and provided feedback and contributions to the written manuscript. Conflicts of Interest:The authors declare no conflict of interest.
References
1. Koubaa, A.; Isabel, N.; Zhang, S.Y.; Beaulieu, J.; Bousquet, J. Transition from juvenile to mature wood in black spruce (Picea mariana (Mill.) B.S.P.). Wood Fiber Sci. 2005, 37, 445–455.
2. Crawford, R.M.M.; Jeffree, C.E.; Rees, W.G. Paludification and forest retreat in northern oceanic environments. Ann. Bot. Lond. 2003, 91, 213–226. [CrossRef]
3. Vygodskaya, N.N.; Groisman, P.Y.; Tchebakova, N.M.; Kurbatova, J.A.; Panfyorov, O.; Parfenova, E.I.; Sogachev, A.F. Ecosystems and climate interactions in the boreal zone of northern Eurasia. Environ. Res. Lett. 2007, 2, 045033. [CrossRef]
4. Fenton, N.; Lecomte, N.; Légaré, S.; Bergeron, Y. Paludification in black spruce (Picea mariana) forests of eastern Canada: Potential factors and management implications. For. Ecol. Manag. 2005, 213, 151–159. [CrossRef]
5. Fenton, N.J.; Bergeron, Y. Sphagnum spore availability in boreal forests. Bryologist 2006, 109, 173–181. [CrossRef]
6. Fenton, N.J.; Bergeron, Y. Sphagnum community change after partial harvest in black spruce boreal forests. For. Ecol. Manag. 2007, 242, 24–33. [CrossRef]
7. DesRochers, A.; Gagnon, R. Is ring count at ground level a good estimation of black spruce age? Can. J. For. Res. 1997, 27, 263–1267.
8. Krause, C.; Morin, H. Adventive-root development in mature black spruce and balsam fir in the boreal forests of Quebec, Canada. Can. J. For. Res. 2005, 35, 2642–2654. [CrossRef]
9. Peters, V.S.; Macdonald, S.E.; Dale, M.R.T. Aging discrepancies of white spruce affect the interpretation of static age structure in boreal mixedwoods. Can. J. For. Res. 2002, 32, 1496–1501. [CrossRef]
10. Gutsell, S.L.; Johnson, E.A. Accurately ageing trees and examining their height-growth rates: Implications for interpreting forest dynamics. J. Ecol. 2002, 90, 153–166. [CrossRef]
11. Parent, S.; Morin, H.; Messier, C. Effects of adventitious roots on age determination in Balsam fir (Abies balsamea) regeneration. Can. J. For. Res. 2000, 30, 513–518.
12. Niklasson, M. A comparison of three age determination methods for suppressed Norway spruce: Implications for age structure analysis. For. Ecol. Manag. 2002, 161, 279–288. [CrossRef]
13. Groot, A.; Horton, B.J. Age and size structure of natural and second-growth peatland Picea mariana stands. Can. J. For. Res. 1994, 24, 225–233. [CrossRef]
14. Lieffers, V.J.; Stadt, K.J.; Stan, N. Age structure and growth of understory white spruce under aspen. Can. J. For. Res. 1996, 26, 1002–1007. [CrossRef]
15. Garet, J.; Raulier, F.; Pothier, D.; Cumming, S.G. Forest age class structures as indicators of sustainability in boreal forest: Are we measuring them correctly? Ecol. Indic. 2012, 23, 202–210. [CrossRef]
16. Wilmking, M.; Hallinger, M.; Van Bogaert, R.; Kyncl, T.; Babst, F.; Hahne, W.; Juday, G.P.; De Luis, M.; Novak, K.; Völlm, C. Continuously missing outer rings in woody plants at their distributional margins. Dendrochronologia 2012, 30, 213–222. [CrossRef]
17. Wong, C.M.; Lertzman, K.P. Errors in estimating tree age: Implications for studies of stand dynamics. Can. J. For. Res. 2001, 31, 1262–1271. [CrossRef]
18. St-Pierre, H.; Gagnon, R.; Bellefleur, P. Post-fire regeneration of black spruce Picea mariana and jack pine Pinus banksiana in the boreal forest, Quebec. Can. J. For. Res. 1992, 22, 474–481. [CrossRef]
19. Oliver, C.; Larson, B. Forest Stand Dynamics; Wiley & Sons: New York, NY, USA, 1996; p. 509.
20. Vasiliauskas, S.; Chen, H.Y.H. How long do trees take to reach breast height after fire in northeastern Ontario? Can. J. For. Res. 2002, 32, 1889–1892. [CrossRef]
21. Smith, D.M.; Larson, B.C.; Kelty, M.J.; Ashton, P.M.S. The Practice of Silviculture: Applied Forest Ecology, 9th ed.; Wiley & Sons: New York, NY, USA, 1997; pp. 1–537.
Forests 2016, 7, 69 13 of 13
22. Pothier, D.; Savard, F. Actualisation des Tables de Production Pour les Principales Espèces Forestières du Québec; Ministère des Ressources Naturelles du Québec, Direction de la Recherche Forestière: Québec, QC, Canada, 1998; pp. 1–183.
23. Fraver, S.; Bradford, J.B.; Palik, B.J. Improving tree age estimates derived from increment cores: A case study of red pine. For. Sci. 2011, 57, 164–70.
24. Parisien, M.-A.; Sirois, L.; Parent, S. Landscape-level variability in the age underestimation of understory black spruce in the northern boreal forest of Quebec. Can. J. For. Res. 2005, 35, 633–642. [CrossRef]
25. Robitaille, A.; Saucier, J.-P. Paysages Régionaux du Quebec Méridional; Les Publications du Québec: Sainte-Foy, QC, Canada, 1998; pp. 1–213.
26. Veillette, J.J. Evolution and paleohydrology of glacial Lakes Barlow and Ojibway. Quat. Sci. Rev. 1994, 13, 945–971. [CrossRef]
27. Soil Classification Working Group. The Canadian System of Soil Classification, 3rd ed.; Agriculture and Agri-Food Canad, Publication: Ottawa, ON, Canada, 1998.
28. Laamrani, A.; Valeria, O.; Cheng, L.Z.; Bergeron, Y.; Camerlynck, C. The use of ground penetrating radar for remote sensing the organic layer—Mineral soil interface in paludified boreal forests. Can. J. Remote Sens. 2013, 39, 74–88. [CrossRef]
29. Laamrani, A.; Valeria, O.; Fenton, N.; Bergeron, Y. Landscape-scale influence of topography on organic layer accumulation in paludified boreal forests. For. Sci. 2014, 60, 579–590.
30. Laamrani, A.; Valeria, O.; Fenton, N.; Bergeron, Y.; Cheng, L.Z. The role of mineral soil topography on the spatial distribution of organic layer thickness in a paludified boreal landscape. Geoderma 2014, 221–222, 70–81. [CrossRef]
31. Bergeron, Y.; Gauthier, S.; Kafka, V.; Lefort, P.; Lesieur, D. Natural fire frequency for the eastern Canadian boreal forest: Consequences for sustainable forestry. Can. J. For. Res. 2001, 31, 384–391. [CrossRef]
32. Environment Canada. Canadian Climate Normals 1971–2000. Matagami Weather Station. Available online: http://climate.weather.gc.ca/climate_normals/ (accessed on 15 November 2015).
33. Simard, M.; Bernier, P.Y.; Bergeron, Y.; Paré, D.; Guérine, L. Paludification dynamics in the boreal forest of the James Bay Lowlands: Effect of time since fire and topography. Can. J. For. Res. 2009, 39, 546–552. [CrossRef] 34. MRNQ. Norme D’inventaire Écoforestier; Placettes–Échantillons Permanents, Edition 2013; Ministère des Ressources Naturelles du Québec, Direction des Inventaires Forestiers, Secteur des Forêts: Québec, QC, Canada, 2013; p. 213.
35. Telewski, F.W.; Lynch, A.M. Measuring growth and development of stems. In Techniques and Approaches in Forest Tree Ecophysiology; Lassoie, J.P., Hinckley, T.M., Eds.; CRC Press Inc.: Boston, MA, USA, 1991; pp. 503–555.
36. Swetnam, T.W.; Thompson, M.A.; Kennedy Sutherland, E. Using Dendrochronology to Measure Radial Growth of Defoliated Trees; Agriculture Handbook. USDA Forest Service: Washington, DC, USA, 1985; pp. 1–39. 37. Schweingruber, F.H. Tree Rings: Basics and Applications of Dendrochronology, 1st ed.; Kluwer Academic
Publishers: Dordrecht, The Netherlands, 1988; pp. 1–276.
38. Perron, J.-Y. Tarif de Cubage Général-Volume Marchand Brut; Ministère des Ressources Naturelles du Québec: Québec, QC, Canada, 1983; p. 52.
39. Chambers, J.M. Linear Models. In Statistical Models in S; Chapter 4; Chambers, J.M., Hastie, T.J., Eds.; Wadsworth & Brooks/Cole: Pacific Grove, CA, USA, 1992; pp. 95–144.
40. R Development Core Team-2011. Language and Environment for Statistical Computing. R Foundation for Statistical Computing: Vienna, Austria. Available online: http://www.R-project.org/ (accessed on 15 November 2015).
41. Fayle, D.C.F. Radial Growth in Tree Roots; Technical Report No.9; Faculty of Forestry, University Toronto: Toronto, ON, Canada, 1968; pp. 1–183.
42. McCarthy, J.W.; Weetman, G. Age and size structure of gap-dynamic, old-growth boreal forest stands in Newfoundland. Silv. Fenn. 2006, 40, 209–230. [CrossRef]
© 2016 by the authors; licensee MDPI, Basel, Switzerland. This article is an open access article distributed under the terms and conditions of the Creative Commons by Attribution (CC-BY) license (http://creativecommons.org/licenses/by/4.0/).