Université de Montréal
Development and studies of electrochromic and electrofluorochromic
organic materials
Par
Chengzhang Yao
Département de Chimie, Université de Montréal
Faculté des Arts et des Sciences
Mémoire présenté à la Faculté des Arts et des Sciences
en vue de l’obtention du grade de Maitre en Chimie
Avril, 2020
Résumé:
Les matériaux électrochromiques organiques ont été un domaine de recherche novateur au cours des dernières décennies. Ces composés qui répondent à un potentiel appliqué par un changement de couleur sont dits électrochromes. Leur intérêt est principalement dû à leur synthèse facile, à haut rendement et à leur aspect écologique par rapport à leurs homologues inorganiques. En règle générale, ces composés ne changent de couleur qu’avec un potentiel appliqué. Développer des composés qui changent à la fois leur couleur et leur fluorescence avec un potentiel appliqué pour une utilisation dans des dispositifs électrofluorescents reste un défi majeur.
Dans cette étude, une série de composés contenant de la triphénylamine (TPA) et du benzothiadiazole (BZT) ont été évalués. Ils ont été couplés à différents groupes terminaux pour moduler les propriétés photophysiques et électrochimiques. Ces composés ont été entièrement caractérisés par spectroscopie d'absorption, spectroscopie de fluorescence, voltammétrie cyclique, spectroélectrochimie et diffraction des rayons X. Cela nous a permis d'examiner l'influence de leur structure sur les propriétés. Cela nous a également permis d'identifier les composés d'intérêt idéaux pour une utilisation dans des appareils fonctionnels.
Les dispositifs contenant du TPA et du BZT sont idéalement employée pour la fabrication de « fenêtre intelligente ». Cela est dû à l'activité électrochimique du TPA ainsi qu'à la fluorescence à l'état solide du noyau BZT. Pour améliorer encore les propriétés des dispositifs, un système passif était le but ultime. Cela contraste avec les dispositifs actifs où un potentiel doit être appliqué en continu pour que la couleur induite soit cohérente.
Dans ce but, des couches cathodiques ont été préparées et étudiées dans un dispositif et leur utilisation comme réservoir d'ions dans un dispositif électrochromique / électrofluorescent passif a été testée. Les résultats préliminaires ont montré que les dérivés d'anthraquinone avaient des propriétés idéales pour les couches cathodiques.
Mots clés: électrochromisme, triphénylamine, benzothiadiazole, anthraquinone, fenêtre intelligente.
Abstract:
Organic electrochromic materials have been a hot area of research during the past decades. These compounds that respond to an applied potential with a color change are said to be electrochromic. Their interest is mainly because of the easy synthesis, convenient mass production, and eco-friendly preparation compared to their inorganic counterparts. Typically, these compounds change only their color with an applied potential. To develop compounds that change both their color and their fluorescence with a potential applied for use in electrofluorescent devices remains a major challenge.
In this study, a series of compounds containing triphenylamine (TPA) and benzothiadiazole (BZT) were evaluated. They were coupled with different end groups to tune the photophysical and electrochemical properties. These compounds were fully characterized by absorption spectroscopy, fluorescence spectroscopy, cyclic voltammetry, spectroelectrochemistry, and X-ray diffraction along with other techniques. This allowed us to examine the influence of their structure on the properties. It also allowed us to identify the ideal compounds of interest for use in functioning devices.
The devices containing TPA and BZT are ideally ‘smart window’ applications. This is due to the electrochemical activity by TPA as well as the solid state fluorescence of the BZT core. To further improve the properties of devices, a passive device was the ultimate goal. This is in contrast to active devices where a potential must be applied continuously for the induced color to be consistent.
Towards this goal, cathodic layers were prepared and investigated in a device and their use as an ion reservoir in a passive electrochromic / electrofluorescent device was tested. Preliminary results, showed that anthraquinone derivatives had ideal properties for the cathodic layers.
Table des matières
Résumé: ...2
Abstract:...3
Table des matières...4
Liste des figures...6
Liste des tableux... 13
Remerciements...13 1. Introduction...15 1.1 Electrochromic materials...15 1.1.1. Prussian Blue... 15 1.1.2. PEDOT: Poly(3,4-ethylenedioxythiophene)... 17 1.1.3. Viologen...18
1.1.4. Triphenylamine based chromophores...19
1.1.5. Polymer chromophores containing TPA... 21
1.2 Surface immobilization: from small molecules to devices... 24
1.2.1 Direct arylation polymerization...25
1.2.2 Electropolymerization... 26
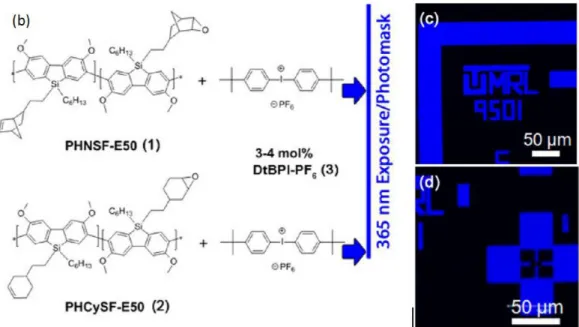
1.2.3 Photochemical cross-linking polymerization...28
1.3 Electroluminochromic materials... 31
1.3.1 Benzothiadiazole as core... 31
1.3.2 Extension of TPA...32
1.4 Aggregation induced emission effect... 33
1.5 Jablonski diagram...34
1.6 Problems to be solved...35
1.7 Objectives... 37
2. Experimental Methods...42
2.1. Spectroscopy, electrochemistry, spectroelectrochemistry measurements...42
2.2 Device fabrication...42
2.3 Other characterizations...43
2.4 Quantum yield... 44
2.5 Coloration efficiency... 44
3. Study of a red emissive fluorophore which has dual role in both electrochromic and electrofluorochromic...46
3.1 Abstract... 48
3.2 Introduction...49
3.3 Results and Discussion... 51
3.4 Conclusion... 58
3.6 Experimental Details... 62
3.7 Supporting information...64
4. Study of a series of red chromophores... 87
4.1 Introduction...91
4.2 Results and Discussion... 93
4.3 Conclusion... 105
4.4 Experimental...105
4.5 Supporting information...113
5. Study of anthraquinone based derivatives:...148
attempt for reduction layer...148
5.1. Introduction...149
5.2. Results and discussion...151
Experimental section... 156
5.3. Conclusion... 157
5.4. Supporting information...157
Liste des figures
Figure 1.1 : Cyclic voltammogram of Prussian Blue. Reprinted with permission from [5].
Copyright (2001) WILEY-VCH...16
Figure 1.2 : Structure of PEDOT...17
Figure 1.3 : Photos of EDOT-based polymers with different bandgaps. Reprinted with permission from[8]. Copyright (2000) WILEY-VCH... 18
Figure 1.4 : Structure of methyl viologen... 18
Figure 1.5 : Viologen species accessible by reversible electrochemical reduction.13...19
Figure 1.6 : Isomeric structures of extended viologen derivatives.14...19
Figure 1.7 : Structure of TPA based small molecules investigate by Audebert’s group...20
Figure 1.8 : TPA-Anthraquinone derivatives explained by Li’s group...20
Figure 1.9 : TPA-chalcone structures... 21
Figure 1.10 : First report of TPA-polyimides. Reprinted with permission from [18]. Copyright (2005) American Chemical Society...22
Figure 1.11 : TPA-polyimides examples.18-20... 23
Figure 1.12 : Example of TPA-polyamides, electrochromism properties and stability.22... 23
Figure 1.13 : Poly(amine−1,3,4-oxadiazole)s structure and electrochromic properties. Reprinted with permission from[23]. Copyright (2006) American Chemical Society... 24
Figure 1.14 : P3HT polymerization by Lemair et al.9...25
Figure 1.15 : Ozawa’s synthetic route of P3HT.10...26
Figure 1.16 : Rudenko et al. synthesis of P3HT with different types of carboxylic acids.28 ...26
Figure 1.17 : Electrochromism mechanism of P(DTP-PNA) and P(DTP-PTA-DTP). Reproduced with permission from29. Copyright (2017), Elsevier...27
Figure 1.18 : Structure of P(DTF-TPA-CBZ) and electrochromic color of its three states. Reproduced with permission from30. Copyright (2017), Elsevier... 27
Figure 1.19 : Structure of P(TTPA-co-DIT) and P(TTPA-co-BDTA) and their corresponding colors at different potentials.31copyrights (open access)...28
Figure 1.20 . Photochemically mediated mechanism of photoacid generation... 28
Figure 1.21 . Mechanism of acid mediated oxetane ring opening polymerization. ...29
Figure 1.22 . Oxiranes used by Mcdowell(left) and the blue photoluminescence pattern (right). Adapted with permission from33. Copyright (2014) American Chemical Society... 30
Figure 1.23 . The structure of inverted solar cells and the materials used for in situ cross-linking and doping of electron transporting materials. Reprinted with permission from [34]. Copyright (2011) WILEY-VCH... 30
Figure 1.24 . Structure of benzothiadiazole (BZT) derivatives... 32
Figure 1.25 . Color tuned properties by different potentials. Reproduced with permission from37. Copyright (2017), Elsevier... 32
Figure 1.27 . Structure of 1-methyl-1,2,3,4,5-pentaphenylsilole...34 Figure 1.28 . Structure of AIE TPA derivatives demonstrated by Liou.44... 34
Figure 1.29 . Energy states for a single molecule. Reprinted with permission from46. Copyright
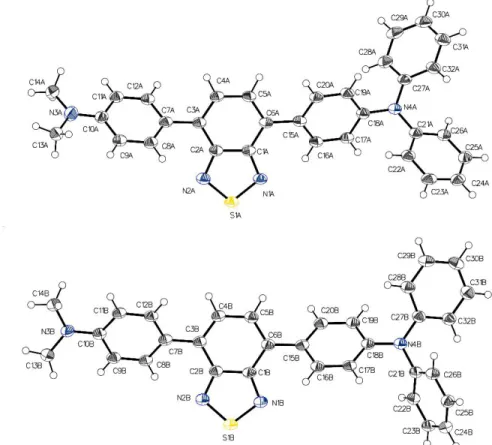
(2006), Springer... 35 Figure 2.1 . Sandwich structure for fabricating electrochromic device...42 Figure 3.1 . Fluorophore examined for use as a dual role electroactive material...50 Figure 3.2 . ORTEP diagram of the two distinct molecules of 1 resolved in the unit cell along with their corresponding atom numbering... 51 Figure 3.3 . Normalized emission spectra of 1 in anhydrous solvents exciting at the maximum
red-shifted absorption: diethyl ether (■), toluene (●), THF (▲), dichloromethane (▼), acetonitrile (♦), and DMF (◄). Insert: picture of 1 in vials of diethyl ether, toluene, THF, acetonitrile, and DMF (from left to right) when irradiated with a hand-held UV lamp at 365 nm. ... 53 Figure 3.4 . Change in absorbance spectra of 1 with applied potential of 1.3 V measured at 10
sec internals in anhydrous and deaerated dichloromethane with 0.1 M TBAPF6. After 90 sec,
a negative potential of -0.1 V was applied for 3.5 min (○)...55 Figure 3.5 . A) Change in percent transmittance of 1 measured at 1400 nm in anhydrous and
deaerated dichloromethane with 0.1 M TBAPF6 with applied potentials of +0.95 V for 30
sec, and then -0.1 V for 2 min intervals. B) Change in emission intensity of 1 in anhydrous and nitrogen purged dichloromethane with 0.1 M TBAPF6 excited at 465 nm and
monitored at 695 nm with applying potential of +1.3 V for 30 sec, and then -0.1 V for 6 min, respectively... 56 Figure 3.6 . Spectroelectrofluorescence of the operating device prepared with 1 by exciting at
460 nm and monitoring at 650 nm when switching between -0.1 V for 5 min and +1.9 V at 30 sec. intervals. Inset: photographs of an electrochromic device prepared from 1 patterned with a smiling face in the neutral (left) and oxidized (middle) states along with 1 spin coated on a glass substrate irradiated with a hand-held UV lamp (right)...58 Figure 3.7 . Normalized absorbance spectra of 1 in different anhydrous solvent: diethyl ether (■),
THF (●), toluene (▲), acetonitrile (▼), DMF (♦), and dichloromethane ( )...65 Figure 3.8 . Concentration dependent absorption of 1 sequentially diluted from a 1 mM stock
solution in THF... 66 Figure 3.9 . Concentration dependent emission of 1 in THF, exciting at 465 nm with the various
solutions from... 66 Figure 3.10 . Temperature dependent emission of 1 in 2-methyltetrahydrofuran between -160o
and 20oC, exciting at 465 nm. The temperature was equilibrated for a least 5 min. at each
temperature: 20o(▬), -10o(▬), -40o(▬), -70o(▬), -100o(▬), -130o(▬), 160oC (▬)...66
Figure 3.11 . Emission spectra of 1 in various vol.% of water in THF. Inset: photograph of 1 in vials irradiated with a handheld UV lamp with vol.% water of 0%, 20%, 40%, 60%, 80%, and 90% (from left to right) in THF... 67 Figure 3.12 . Singlet excited state kinetic decay of 1 (▬) and the instrument response frequency
Figure 3.13 . Calculated absorption spectra of the neutral (black), dication (blue), and radical cation (red) of 1 by DFT-TD means with CAM-B3LYP with the 6-311G*(d,p) basis set...68
Figure 3.14 . HOMO (left) and LUMO (right) from the natural transition orbital analysis calculated from the first singlet transition by TD-DFT of the neutral (A), -radical cation orbital (B), -radical cation orbital (C), the dication (D), and the spin density (E) of 1...69 Figure 3.15 . Cyclic voltammogram of 1 measured at 100 mV/sec in anhydrous and degassed
dichloromethane with 0.1 M TBAPF6...70
Figure 3.16 . Cyclic voltammogram of 1 measured at 100 mV/sec in anhydrous and degassed dichloromethane with 0.1 M TBAPF6and equimolar ferrocene added an internal reference.70
Figure 3.17 . Square wave voltammogram of 1 measured in anhydrous and degassed dichloromethane with 0.1 M TBAPF6. Inset: mathematically deconvoluted experimental
square wave voltammogram with baseline correction into two constitutional components (red and blue) along with the refitted peak (green) of two deconvoluted gaussian peaks.... 71 Figure 3.18 . Change in absorption spectra of 1 with applied potential of 0.95 V between 10 and
100 sec in anhydrous and deaerated dichloromethane with 0.1 M TBAPF6... 71
Figure 3.19 . Change in percent transmittance of 1 at 715 nm measured in anhydrous and deaerated dichloromethane with 0.1 M TBAPF6 with applied potential switching between
+1.3 and -0.1 V at 30 sec. intervals... 72 Figure 3.20 . Calculated contrast ratio of 1 in anhydrous and degassed dichloromethane with 0.1
M TBAPF6at 715 nm derived by measuring the percent transmittance with different pulse
durations... 72 Figure 3.21 . Variation of percent transmittance of 1 in anhydrous and degassed dichloromethane
with 0.1 M TBAPF6 monitored at 715 nm with switching the applied potential between
+1.3 and -0.1 V six times per given switching interval: 1, 2, 5, 10, 15, 20, 25, 30, and 35 sec. ...73 Figure 3.22 . Contrast ratio of 1 in anhydrous and degassed dichloromethane with 0.1 M
TBAPF6monitored at 715 nm: experimental (▬) and theoretically (▬) fitted curves... 73
Figure 3.23 . Calculated contrast ratio of 1 in anhydrous and degassed dichloromethane with 0.1 M TBAPF6 at 1400 nm derived from measuring the percent transmittance with different
pulse durations...74 Figure 3.24 . Variation of percent transmittance of 1 in anhydrous and degassed dichloromethane
with 0.1 M TBAPF6 monitored at 1400 nm with switching the applied potential between
+0.95 and -0.1 V six times per switching interval: 1, 2, 5, 10, 15, 20, 25, 30, 35, 40, 45, 50, and 60 sec... 74 Figure 3.25 . Contrast ratio of 1 in anhydrous and degassed dichloromethane with 0.1 M
TBAPF6monitored at 1400 nm: experimental (▬) and theoretically (▬) fitted curves. ... 75
Figure 3.26 . Photograph of the operating dual electrochromic and electofluorochromic operating sandwich device prepared from 1...75 Figure 3.27 . Change in absorption spectra of the operating device prepared from 1 with
increasing applied potential from 0 to 2.5 V measured at 2 min. intervals... 76 Figure 3.28 . Change in absorption spectra of the device prepared from 1 with applied potential
of 1.9 V measured at 15 sec. intervals. ...76 Figure 3.29 . Emission spectrum of the assembled operating dual electrochromic electrofluorochromic sandwich device prepared from 1 when excited at 460 nm...77 Figure 3.30 .1H NMR spectrum of 1 recorded in CDCl3... 84
Figure 3.31 .13C NMR spectrum of 1 recorded in CDCl3... 85
Figure 4.1 . Resolved X-ray crystallographic structure of 3: A) illustrated as the ORTEP diagram with the ellipsoids drawn at 50% probability and the atom numbering; B) unit cell packing, C) supramolecular 2S–2N square dimer, D) herringbone packing structure shown along the a*-axis, and E) extended solid-state packing shown along the c-axis. The hydrogens have
been omitted (B, D, and E) for clarity with the supramolecular contacts shown as blue lines (B)... 95 Figure 4.2 . Normalized emission spectra of 1 in hexane (black), toluene (red), diethyl ether
(blue), dichloromethane (green), ethyl acetate (wine), acetonitrile (navy blue), and DMSO (orange) irradiated at the most red-shifted absorbance. Inset: photograph of vials of 1 irradiated with a handheld UV lamp at 365 nm in hexane, toluene, chloroform, dichloromethane, diethyl ether, ethyl acetate, THF, acetone, acetonitrile, methanol, and DMSO (left to right)...97 Figure 4.3 . Cyclic voltammograms of 2 (black) and 1 (red) in 0.1 TBAPF6 and degassed
anhydrous dichloromethane measured at 100 mV/sec vs. the reversible ferrocene/ferrocenium redox couple... 101 Figure 4.4 . A) Change in absorption of 1 with an applied potential of +1.15 V in 0.1 M TBAPF6
in degassed and anhydrous dichloromethane measured at 30 sec. intervals. Inset: photographs of the honeycomb working of 1 in the neutral (left) and oxidized states (right). B) Transmittance % change of 1 in anhydrous and degassed dichloromethane monitored at 917 nm with applied potentials between +1.3 and -0.1 V switched at 30 sec intervals. C) Change in fluorescence intensity of 1 excited at 450 nm and monitored at 690 nm in 0.1 M TBAPF6in degassed dichloromethane with applied potentials of +1.35 and -0.1 V for 30 s
for 1, respectively...102 Figure 4.5 . Change in emission intensity of the operating electrofluorochromic device prepared
with 1 as the active layer with applied potential switching between + 2.0 V for 90 s and -1.5 V for 130 s in the region delimited by the dashed lines. Excited at 470 nm and monitored 645 nm. Inset: photographs of 1 spray coated on a glass slide and irradiated under ambient light (left) and a UV handheld lamp (middle) along with a fully assembled electrofluorochromic device prepared with 1 as the active layer (right)... 104 Figure 4.6 . Intermolecular contacts (blue lines) of 3 in the resolved crystal structure. The
molecules are bleached in color to focus attention on the central structure and its contacts.113 Figure 4.7 . Normalized absorbance spectra of 1 in various solvents...114 Figure 4.8 . Normalized emission spectra of 1 in THF (black), chloroform (red), acetone (blue),
and methanol (wine)... 114 Figure 4.9 . Normalized absorbance spectra of 2 in various solvents...115 Figure 4.10 . Normalized emission spectra of 2 in hexane (black), toluene (red), diethyl ether
(blue), dichloromethane (green), THF (wine), methanol (navy blue), and DMSO (orange).115 Figure 4.11 . Normalized emission spectra of 2 in ethyl acetate (black), chloroform (red), acetone
(green), and acetonitrile (wine)... 116 Figure 4.12 . Normalized excitation spectra of 3 in various solvents monitored at the most red
shifted emission... 116 Figure 4.13 . Normalized absorption (dotted line) and emission (solid line) spectra of 3 (blue) as
a thin film on glass cover slips... 117 Figure 4.14 . Normalized emission spectra of 3 in hexane (black), toluene, (red), chloroform
(blue), dichloromethane (olive), diethyl ether (wine), THF (orange), acetone (light green), and acetonitrile (navy blue) irradiated at the most red shifted absorbance. Inset: photograph of cuvettes of 1 irradiated with a handheld UV lamp in hexane, toluene, chloroform, dichloromethane, diethyl ether, ethyl acetate, THF, acetone, acetonitrile, methanol, and DMSO (left to right)... 117 Figure 4.15 . Normalized emission spectra of 3 in ethyl acetate (brown), methanol, (orange),
DMSO (blue) irradiated at the most red-shifted absorbance... 118 Figure 4.16 . Absorbance of 3 in various acetonitrile/water volume % mixtures...118 Figure 4.17 . Change in emission of 1 with various vol% water in THF: 100, 80, 60, 40, 20, 10% THF... 119 Figure 4.18 . Emission of 3 in various volume % of acetonitrile/water mixtures... 119 Figure 4.19 . Excited state kinetics of 2 (blue), 1 (red), and IRF (black) measured in anhydrous and degassed THF excited at 405 nm with a ps-LED. Inset: photograph of 2 (left series) and 1 (right series) deposited on a 60 μL well slide under ambient light (left) and irradiated with a handheld UV lamp (right)...121 Figure 4.20 . Excited lifetime kinetics of 3 in toluene (black; 6.15 ns), THF (red; 7.02 ns),
acetone (blue; 2.71 ns), and acetonitrile (olive; 1.29 ns) excited with a 405 nm ps-LED. Inset: photograph of 3 deposited on a 60 L well slide under ambient light (left) and irradiated with a handheld UV lamp (right)...121 Figure 4.21 . Temperature dependent emission of 2 measured in degassed 2-methyltetrahydrofuran and excited at 445 nm... 122 Figure 4.22 . Temperature dependent emission of 1 measured in degassed 2-methyltetrahydrofuran and excited at 450 nm... 122 Figure 4.23 . Temperature dependent emission of 3 in degassed 2-methyltetrahydrofuran...123 Figure 4.24 . Change in absorption (left) and emission (right) spectra of 3 in toluene with the
addition of various amounts of aniline. Inset: Stern-Volmer plot of 3 with aniline in toluene.123 Figure 4.25 . Cyclic voltammetry of 3 (1 mM) in TBAPF6(0.2 M) in propylene carbonate with
ferrocene as internal reference measured at 100 mV/s... 124 Figure 4.26 . Change in absorption of 2 with an applied at potential of +1.5 V in 0.1 M TBAPF6
and degassed dichloromethane measured at 30 sec. intervals. ... 124 Figure 4.27 . Change in transmittance intensity of 2 (top) and 1 (bottom) monitored at 917 nm. in
0.1 M TBAPF6 and degassed dichloromethane with pplied potentials of + 0.9 V and -0 V
Figure 4.28 . Change in fluorescence intensity of 2 excited at 450 nm and monitored at 670 nm in 0.1 M TBAPF6 and degassed dichloromethane with applied potentials of + 1.1 V and -0
V for 30 s. ... 125
Figure 4.29 . Spectroelectrochemistry of 3 (0.5 mM) in TBAPF6 (0.1 M) anhydrous and degassed dichloromethane with applied potential of +1.3 V from 0 (black line) to 210 sec measured at 30 sec intervals and a final potential of -0.1 V after 300 sec (maroon line)... 126
Figure 4.30 . Change in transmittance of 3 (0.5 mM) in TBAPF6 (0.1 M) anhydrous and degassed dichloromethane monitored at 888 nm switching with applied potentials of +1.3 and -0.1 V at 90 sec intervals... 126
Figure 4.31 . Change in fluorescence intensity of 3. Excited at 445 nm and monitored on 690 nm in 0.1 M TBAPF6and degassed dichloromethane with applied potentials of + 1.1 V and -0.1 V to reach the second oxidation state for 30 s...127
Figure 4.32 . Change in fluorescence intensity of 3. Excited at 445 nm and monitored on 690 nm in 0.1 M TBAPF6and degassed dichloromethane with applied potentials of + 0.8 V and -0.1 V for 30 s. Inset: photographs of 3 deposited on a glass slide and irradiated under ambient light (left) and a handheld UV lamp (right)... 127
Figure 4.33 . Change in emission intensity of the operating electrofluorochromic device prepared with 2 as the active layer with applied potential switching between + 1.5 V for 5 min and -0.3 V for 9 min. in the region delimited by the dashed lines. Excited at 470 nm and monitored at 645 nm. Inset: photographs of the 2 spray coated on a glass slide under ambient light (left) and irradiated with UV handheld lamp (middle). Fully assembled electrofluorochromic device prepared with 2 (right)... 128
Figure 4.34 . Frontier orbtials calculated with the Natural Transition Orbitals by CAM-DFT with the 6-311g+(d,p) basis set of the HOMO (top) and LUMO (bottom) of the radical cation (left) and dication (right) of 2 (A), 1 (B), and 3 (C)...130
Figure 4.35 . Calculated epsilon values by CAM-DFT/TD-DFT with the 6-311g+(d,p) basis set for the 2 (black), 1 (red), and 3 (blue) for the neutral state (square), radical cation (circle), and dication (triangle)...130
Figure 4.36 .1H NMR spectra of 1 measured in CDCl3... 144
Figure 4.37 .13C NMR spectra of 1 measured in CDCl3... 145
Figure 4.38 .1H NMR spectra of 2 measured in CDCl3... 145
Figure 4.39 .13C NMR spectra of 2 measured in CDCl3... 146
Figure 4.40 .1H NMR spectra of 3 measured in CDCl3... 147
Figure 5.1 . Structure of anthraquinone derivatives investigated by Wan’s group...149
Figure 5.2 . Cyclic voltammograms of anthraquinone derivatives. Reprinted with permission from[3]. Copyright (2008) American Chemical Society... 150
Figure 5.3 . Structures of polyimides investigated by Liou’s group...151
Figure 5.4 . Cyclic voltammogram of 1 in anhydrous dichloromethane with 0.1 M TBAPF6 measure at 100 mV/s calibrated versus the reversible ferrocene/ferrocenium couple... 152
Figure 5.5 . Square wave voltammogram of 1 in anhydrous dichloromethane with 0.1 M TBAPF6calibrated versus the reversible ferrocene/ferrocenium couple...152
Figure 5.6 . Spectroelectrochemistry of 1 in dichloromethane with 0.1 M TBAPF6...153
Figure 5.7 . Change in transmittance (%) of 1 monitored at 545 nm (A) and 301 nm (B). Applied potential switch between -1.2 V and +0.1V at 30 seconds intervals... 154
Figure 5.8 . Cyclic voltammogram of the co-polymer of 1 and cross-linker in acetonitrile with 0.1 M TBAPF6. Insert: electrochemically mediated color change on the ITO coated surface.155 Figure 5.9 . Synthesis route of targets 1 and 2... 156
Figure 5.10 .1H NMR of compound 1...157
Figure 5.11 . Mass spectrum of compound 1... 158
Figure 5.12 .1H NMR of compound 2...159
Figure 5.13 . Mass spectrum of compound 2... 159
Liste des tableux
Table 1 . Spectroscopic properties of 1 contingent on solvent...52
Table S2 . Emission wavelength and emission yield of 1 as a function of various vol% water in THF... 67
Table S3 . Coordinates of the optimized geometry of the neutral 1 calculated by CAM-B3LYP with the 6-311+G(d,p) basis set...77
Table S4 . Coordinates of the optimized geometry of the radical cation of 1 calculated by CAM-B3LYP with the 6-311+G(d,p) basis set... 79
Table S5 . Coordinates of the optimized geometry of the dication of 1 calculated by CAM-B3LYP with the 6-311+G(d,p) basis set... 80
Table S6 . Crystallographic data of 1... 82
Table S7 . Selected dihedral angles and bond lengths from the X-ray crystallographic data of 1 and the optimized structures calculated by theoretical means.1...83
Table 8 . Photophysical properties of the fluorochromes in various solvents... 100
Table S9 . Emission and emission yield contingent on water content 1 in degassed THF... 119
Remerciements
This thesis is impossible to finish without the people below whom I sincerely thank for their encouragement and support during my master studies at the Universite de Montreal. I am sorry that I cannot include everyone in the chapter but all your kindness are deeply remembered and I will never forget them.
First and foremost, I would like to thank Professor William Skene for all his help he provided during my master time. From the training program back in summer, 2017, I had the chance to work in Prof. Skene’s lab where I first learned how to do chemistry experiments as a real researcher. Thanks for his patience and encouragement as well as the dedication for chemistry, which promoted my enthusiasm in the field of chemistry. It is also a great honor to be one of Prof. Skene’s master students. The essential materials used for experiments were readily achievable in the lab, along with his guidance, patience, and comprehension. The numerous versions of manuscripts for both publications and my memoire.
I will not forget all the support from Michael Lerond, who helped me a lot in both labs and in daily life. Thanks for his thoughtful plan for taking care of the labs we used every day. I learned a lot of details for carrying out experiments from him. He is one of the most important friends during my master life.
Great thanks to those who also helped me throughout master study, Yohan Gautier, Alex Malinge, Al Ahmad Abdel, Olivier Schott, Dr. Lei Hu, Dr. Hu Zhang, Dr. Daniel Chartrand and Dr. Maris Thierry. Also thanks to our trainees, Raj Shekhar, Nacer Belkessa and Jasper Pantratz who joined us during the summer time in 2019.
Thanks to my friends for the company during two yeas in Canada. Yang Li, Arunprabaharan Subramanian who helped me get out from the depressed emotions when I faced difficulties.
Various scholarships supported my master study, most importantly, MITACS scholarships, which supported me all the way from training time to master study. Thanks to the department for the multiple funding. A special thanks to Marguerite-Jacques-Lemay for your kind scholarship that supported my hard time living in Canada.
Last, I would like to thank all my family members in China for being my strong supporting team. Without them, I cannot complete this study.
1.Introduction
During the last few decades, many conductive organic electronics have been invented to provide human beings with a better life, for example, Organic Light-Emitting Diode (OLED), Organic Photovoltaics (OPVs), Organic field-effect transistors (OFETs) and so on. These materials can undergo a redox process with external applied stimulus and they show different applications in our daily life.1
1.1 Electrochromic materials
Electrochromic materials, known as chromophores, affect the optical color or opacity of a surface when a voltage is applied.2 First appeared in the inorganic field, WO3, is the most
performaning electrochromic material. It has octahedral structures of oxygen that surround a central metal atom and they are joined together at the corners. This arrangement results in a three-dimensional nanoporous structure with "tunnels" between individual octahedral segments. It can change color from dark blue to nearly transparent with an applied external voltage as shown in the equation below:
WO3+ n(H++ e−) → HnWO3.
The inorganic electronics such as WO3 shown above can be easily single crystalline, fast
processed by heating and very stable, but these materials usually have low flexibility which reduce the applications of these materials into biochemistry or ‘smart’ devices. However, the organic materials can mantain low temperature and have higher flexibility at the same time. Although organic electronics face the problem of less stability and lower carrier mobility, they are still competiable with inorganic electronics.3Typical organic electrochromic materials can be
classified as small chromophores, polymer chromophores and metal complexes chromophores. The most studied molecules are outlined below.
1.1.1.Prussian Blue
Prussian blue is a dark blue pigment produced by the oxidation of ferrous ferrocyanide salts. It has the chemical formula FeIII4[FeII(CN)6]3.4It was used by European artists as painting pigment.
Chemists used it as a chromophore in electrochromic devices due to its reversible electrochemistry:
Figure 1.1: Cyclic voltammogram of Prussian Blue. Reprinted with permission from [5].
Copyright (2001) WILEY-VCH.
From the cyclic voltammogram above, we can clearly see that Prussian Blue can change from Prussian White to Berlin Green reversibly. The transfer of electrons is compensated by the entrapment of cations in the film. According to the equation below, reversible Prussian Blue to Prussian White redox process according to:
FeIII4[FeII(CN)6]3+4e-+ 4 K+ K4FeII4[FeII(CN)6]3
At high anodic potentials, Prussian Blue converts to its fully-oxidized form as is clearly seen in cyclic voltammograms due to the presence of the corresponding set of peaks (Figure 1.1). The fully-oxidized redox state is denoted as Berlin Green, or in some cases, as Prussian Yellow, as per the equation showed blow:
FeIII4[FeII(CN)6]3- 3e-+ 3A+ K4FeIII4[FeIII(CN)6A]3
Prussian Blue based chromophores, have been used in biosensors and bioanalytical devices involving hydrogen peroxide producing oxidases.6, 7
1.1.2.PEDOT: Poly(3,4-ethylenedioxythiophene)
Poly(3,4-ethylenedioxythiophene) as known as PEDOT, has the advantages of optical transparency in its conducting state, high stability, moderate band gaps and low redox potential. It is used for fabricating transparent electrodes because of these properties. For commercial purposes, the polymerization is done in the presence of polystyrene sulfonate (PSS) to increase its solubility. The resulting polymer is known as PEDOT:PSS. This material is of important in the organic electronics area, being used in over 10,000 papers.8This polymer was initially developed
to give a soluble conducting polymer that lacked undesired α,β- and β,β-couplings within the polymer backbone. These undesired couplings were major problems with the first generation semiconductor: P3HT, prepared via direct arylation polymerization( DArP).9, 10 While the
PEDOT is not water soluble, it can be dispersed in water as the PEDOT:PSS copolymer. The water-soluble polyelectrolyte system has good film-forming properties, high conductivity, high visible light transmissivity, and excellent stability.11 The neutral state of PEDOT exhibits an
electronic bandgap, defined as the on-set of the -* absorption, of 1.6-1.7 eV and a maxof 610
nm, making it deep blue in color. It can reversibly change from deep blue to pale blue with a low applied voltage. More interestingly, the color of neutral state of PEDOT can be tuned by controlling the band-gap. To demonstrate bandgap control, a few of the examples reported include spacers of vinylene (Eg = 1.4 eV), 2,5-dialkoxyphenylene (Eg = 1.75 to 2.0 eV), biphenyl (Eg =2.3 eV), dialkylfluorene (Eg = 2.3 eV), and carbazole (Eg =2.5 eV).12In general,
the electronic band-gap of a conjugated chain is controlled by varying the degree of -overlap along the backbone via steric interactions, and by controlling the electronic character of the electron-donating or accepting substituents. This provides the means to modulate the color with a wide range of colors being accessible (Figure 1.3). The applications of PEDOT and its derivatives can be expanded into antistatic agentrs, electrode materials, electrochromic windows and so on.
Figure 1.3: Photos of EDOT-based polymers with different bandgaps. Reprinted with permission from[8]. Copyright (2000) WILEY-VCH.
1.1.3.Viologen
Viologens are organic compounds with the formula of (C5H4NR)2n+. The most common viologen
is when the R group is a methyl, and it is widely used as herbicide.
Figure 1.4:Structure of methyl viologen.
Viologens, in their dicationic form, typically undergo two one-electron reductions. The first reduction affords the deeply colored radical cation:
[V]2++ e- [V]+
This is followed by a second reduction. The radical cations of 4,4'-viologens are blue and those of 2,2'-derivatives are green. The second reduction yields a yellow quinoid compound with the overall reversibly electron transfer represented below and inFigure 1.5:
Figure 1.5:Viologen species accessible by reversible electrochemical reduction.13
To further development the family of viologens, their backbones can be extended leading to higher conductivities as well as stronger reducing properties.
Figure 1.6:Isomeric structures of extended viologen derivatives.14
1.1.4.Triphenylamine based chromophores
The triphenylamine (TPA) has become a promising optoelectronic molecule for emergent electronic applications owing to its good thermal and morphological stability for electrochromic materials. It has been studied for over a decade and it still has great potential. It undergoes a reversible redox process with applied the positive voltage, leading to a color change from white to blue.
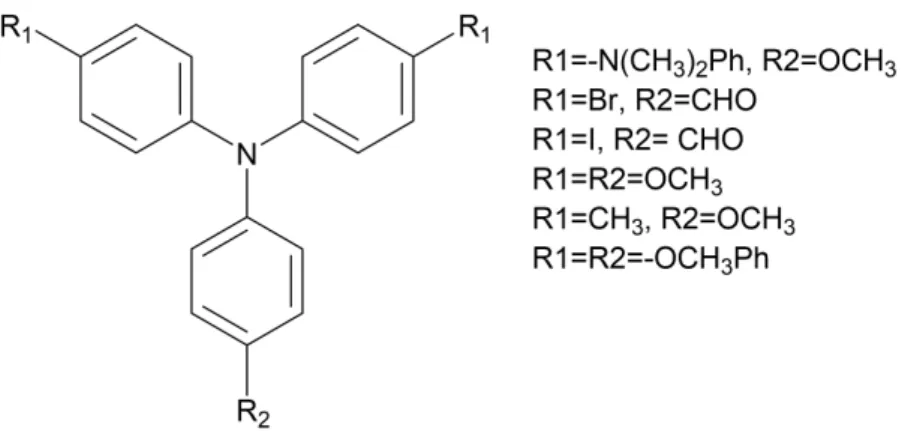
In 2014, the Audebert group prepared a series of TPA derivatives by changing the substituents with a strong donating group -OCH3, or a weak withdrawing group, -CHO. These compounds
were synthesized by cross‐coupling reactions and then studied by cyclic voltammetry, UV/Vis spectroscopy, and fluorescence spectroscopy. By applying different potentials, four unique colored states (colorless, yellow, green, and blue) and three different emissions (non emissive, purple, and green fluorescent) were shown.15
Figure 1.7:Structure of TPA based small molecules investigate by Audebert’s group.
The TPA structure can also be modified by coupling the TPA core with various functional groups. In 2017, anthraquinone was coupled to the TPA block for use as super capacitors owing to two reversible reduction processes.16Surprisingly, the emission of the TPA-antraquinone derivatives
were highly sensitive to solvents. As such, its emission could be tuned with large red-shifts up to 138 and 192 nm in non-polar or less polar solvents, respectively. Overall, it emitted rich colors. This study showed multifunctional chromophores could both emit with emissions in the visible region. Anthraquinone derivatives will be further developed in chapter 4.
Figure 1.8:TPA-Anthraquinone derivatives explained by Li’s group.
TPA was also coupled to chalcones via an Aldol reaction.17Six novel electrochromic compounds
containing TPA and chalcone units were synthesized and they showed fast spectroelectrochemical response (change in absorption spectrum with applied potential) and high durability. They could switch between yellow and blue colors. By this token, chalcone-containing TPA moiety is an alternative approach for tuning the electrochromic behaviors.
Figure 1.9:TPA-chalcone structures.
1.1.5.Polymer chromophores containing TPA
The triphenylamine (TPA) core can be incorporated into polymers and maintain its reversible one-electron oxidation. TPA based polymers for electrochromic use have been studied over the last decade, mostly as polyimides, polyamides as well as poly(hydrazide)s and poly(oxadiazole)s. TPA-polyimides were first reported by Liou’s group,18 by coupling diamine with various
tetracarboxylic dianhydrides(Figure 1.10). The polyimides were moderately soluble in several organic solvents, and they could be cast into flexible, tough, and transparent films. The thermally stable polyimides films exhibited two well-defined oxidation redox couples (at 0.78 and 1.14 V versus Ag/AgCl) with distinct color changes from pale yellowish to green and then blue during oxidative scanning. Afterwards, Liou and Hsiao continuously reported a large variety of TPA-polyimides. Most of the polyimides were organo-processable, thermally stable, had excellent adhesion to indium tin oxide (ITO)-coated glass electrodes, and had good electrochemical stability. For adhesion process, spin coating or spray coating was chosen. The adhesion process has great influence on the device performance due to the layers’ morphology. By attaching the two layers of different materials, the diffusion between the phases will lead to the change of performance via the electron doping processs for example. The TPA-polyimides also revealed electrochromic properties when applying positive potentials. They are considered as ideal anodic electrochromic materials due to their reversible oxidation potentials, electrochemical stability, and thin film formation. Representative examples of TPA-polyimides are shown inFigure 1.11, namely N-phenylcarbazole19, adamantylphenoxy20, viologen21.
Figure 1.10: First report of TPA-polyimides. Reprinted with permission from [18]. Copyright
Figure 1.11:TPA-polyimides examples.18-20
Similarly, polyamides showed high levels of thermal stability and high glass-transition temperatures as well as high char yields. Some of the TPA-polyamides thin films revealed reversible electrochemistry with electrochromic high contrast ratio in the visible range or NIR region, high coloration efficiency, low switching time, and high stability for long-term electrochromic operation. A polyamide example from Hsiao’s group exhibited excellent reversible electrochromic stability with good green coloration efficiency and high contrast of optical transmittance change up to 85%. Even after over 1000 cyclic switches, the polymer films exhibited excellent reversibility of electrochromic characteristics due to the para-substituted methoxy groups shown inFigure 1.12.22
Figure 1.12:Example of TPA-polyamides, electrochromism properties and stability.22
Poly(oxadiazole)s are a well-known class of chemically and thermally stable heterocyclic polymers. However, there are infusible and are insoluble, as well as they have the tendency to be brittle. Also, polyoxadiazoles with an aromatic segments have limited processability. To overcome the process limitation of polyhydrazides, the precursors of polyoxadiazoles can be modified. Liou and Hsiao groups put significant effort into synthesizing soluble aromatic polyhydrazides and polyoxadiazoles containing TPA units in the main chain.23, 24 The primary
reason for their use was for high photoluminescence (PL) quantum yield as well as visible electrochromism, combined with the advantage of simple processability for obtaining flexible and mechanically robust films or thin film layers.25, 26 This polymer exhibited pale to green
visible electrochromism as well as a considerably high PL quantum yield.27(Figure 1.13.)
Figure 1.13: Poly(amine−1,3,4-oxadiazole)s structure and electrochromic properties. Reprinted with permission from[23]. Copyright (2006) American Chemical Society.
Despite numerous efforts for preparing non-conjugated polymers, they have problems including precursor insolubility, are difficult to print, and so on. Their extended electroluminochromic study being the sustainability of emission switching with applied potential has not been reported. Their stability in devices remains a problem. The challenge with polymers is their preparation along with their corresponding monomers that are time-consuming to prepare from thermal, photochemical, or electrochemical means.
1.2 Surface immobilization: from small molecules to devices
In working organic device, the first and foremost step is the immobilization of the materials on the electrode substrate. This is required to prevent their migration to the opposite electrode during device operation. The electrochrome mobility reduces the transmission % difference overtime, resulting in reduced coloration efficiency. The latter is a key performance metric of electrochromic devices. The electrochrome immobilization is therefore need to maintain device performance, and in turn, eliminate undesired memory effects. In the solid state, small molecules
are easily dissolved. When the layer is deposited on top, the challenge is how to resist their delamination with subsequent layer deposition, especially the required electrolytic gel. A straightforward option is to polymerize small molecules directly on the surface either via co-polymerization or functionalization of end groups.
1.2.1 Direct arylation polymerization
Traditional direct arylation polymerization (DArP) utilizes the successive coupling of conjugated monomers, whereby the activation of a C−H bond of one monomer reacts with a typically electrophilic functionality, such as an aryl halide, on another monomer. This is commonly used to prepare ‘P3HT’. The first problem to solve was polythiophene’s regioselectivity. Lemair et al. tried to address this by polymerizing 2-iodo-3-alkylthiophenes using a Heck-type reaction with Pd(OAc)2/NBu4Br as catalyst. This led to the expected functionalized oligomers in good yields,
but with low polymer molecular weight and regioregularities.9The regioregularity was shown to
be solvent dependent, suggesting that the solubility of the polymer and the solvent polarity might influence the reaction pathways, where side reactions such as homo-coupling can occur (Figure 1.14) Then, Ozawa’s group improved the polymerization with Pd ligands and Cs2CO3as a base
in refluxing THF. They obtained regioregular head-to-tail poly(3-hexylthiophene) (HT-P3HT) with high molecular weights (Mn= 30 600 g/mol, Mw/Mn= 1.60), and high regioregularity (98%)
in almost quantitative yield (99%) by using Ligand 5 with o-Me2N substituents as catalyst
precursors (Figure 1.15).10 To further simplify the reaction conditions and use more
environmentally ‘green’ tools, carboxylic acid could be used as a proton shuttle to increase the reactivity.28Rudenko demonstrated the effect of acid pKa, steric bulk, and backbone cyclization
on the reactivity of the DArP catalytic system. The pKa did not correlate with the DArP reactivity in the pKa range of 4.76−5.05. Increasing the acid size in the classes of linear, secondary, and tertiary acids led to a continuous increase in both the reaction yield and polymer molecular weight, However, for the case of cyclic secondary acids, the trend was reversed and a decrease of acid size led to an increase in the polymer yield and the molecular weight in an alternating fashion, depending on whether the acid contained an even or odd number of carbons. In the end, they reached an extremely high PDI value (10.7) in the case of bicyclic acids(Figure 1.16).
Figure 1.15:Ozawa’s synthetic route of P3HT.10
Figure 1.16:Rudenko et al. synthesis of P3HT with different types of carboxylic acids.28
1.2.2 Electropolymerization
As mentioned above, DArP is a promising way for making conjugated polymers, oxidative DArP can also be used for preparing donor−acceptor type materials, which are important for use in organic electronic applications. In short, this approach is environmentally friendly and it is an economic method for replacing traditional polymerizations methods such as Stille and Suzuki couplings.
To accelerate the immobilization process, Liou and Hsiao introduced electron-donating species as protecting groups to triarylamine moieties. These efficiently prevented the tail-to-tail coupling. The coupling reaction could be done with electropolymerizable monomers by attaching two or more unsubstituted TPA or carbazole units onto an electron-withdrawing core. In addition, the TPA core could also be fused to thiophenes, ethylenedioxythiophenes (EDOT), dithienylpyrroles, and chalcogenophenes (Se, Te) derivatives via an electrochemical process. Wang’s group29
reported a series of 2,5-dithienylpyrrole(DTP) derivatives with different triarylamines that underwent excellent transmittance change with applied potentials (Figure 1.17). Of interest, P(DTP-PNA) and P(DTP-PTA-DTP), which underwent more than two mediated colors from bright yellow to violet. Deng’s group also reported a conducting polymer film based on dithiafulvenyl-triphenylamine-di(N-carbazole).30
Figure 1.17: Electrochromism mechanism of P(DTP-PNA) and P(DTP-PTA-DTP). Reproduced with permission from29. Copyright (2017), Elsevier.
As shown inFigure 1.18, the TPA substituted with a strong dithiafulvenyl (DTF) acceptor was introduced at N-position of carbazole (CBZ), leading to a DTF-TPA-CBZ monomer. The polymer had three different color states with applied potential of -0.4 V, 1.2 V and 1.8 V, being light yellow, green and blue grey, respectively. Unfortunately, the coloration efficiency (see Section2.5) of this polymer was low, less than 30 cm2C-1. This was because of the polymer’s
electrochemical instability.30
Figure 1.18: Structure of P(DTF-TPA-CBZ) and electrochromic color of its three states. Reproduced with permission from30. Copyright (2017), Elsevier.
Wu and Chung improved the coloration efficiency and stability of the electrochromic polymers by copolymerizing TPA and DTP monomers.31 The resulting P(TTPA-co-DIT) and
P(TTPA-co-BDTA) films had distinct electrochromic behaviors, from neutral state (yellow) to the oxidized state (blue), upon applying various potentials. In addition, the stabilities for the
color-bleached switching of the electrochromic device at the 100th cycle were higher than those
of the copolymer films in an ionic liquid solution. The ∆T and coloration efficiency of P(TTPA-co-BDTA) and PProDOT-Et2 in an electrochromic device with an applied potential of
-1.0 V was 48.1% and 649.4 cm2C-1 at 588 nm, respectively. These values are consisted with
commercialized electrochromic compounds inFigure 1.19.
Figure 1.19: Structure of P(TTPA-co-DIT) and P(TTPA-co-BDTA) and their corresponding colors at different potentials.31copyrights (open access).
Despite the relative convenience of electrochemical polymerization of conducting polymers, both the cost and scalability limitations of this method cannot be ignored. Typically, only small scales of polymers can be prepared by this route. Moreover, the cost of using a large area platinum mesh electrode is high.
1.2.3 Photochemical cross-linking polymerization
A straightforward method for immobilization on surfaces is by the thermal polymerization monomers. However, this usually requires prolonged reaction times and high temperatures. To overcome these disadvantages, photochemical cross-linking polymerization can be done. The key advantage is that the polymerization can be patterned with a mask on the monomer surface. After irradiation and polymerization, the unreacted monomers can be rinsed from the surface. Usually a photoacid generator (PAG) is required.
Multiple strategies have been used for photo-polymerization, The most common ones will be introduced herein. Meerholz et al.32 developed oxetane-functionalized organic semiconductors,
for fabricatin multilayer OLEDs/PLEDs photo-lithographyically. In this approach, insoluble polymers are formed from the cationic ring opening polymerization (CROP) of oxetanes that is initiated by a photoacid generator, according to Figure 1.20. Using this approach. a full-color polymer organic light-emitting diode (OLED) display was fabricated by a direct photolithography process, that is, a process that allows direct structuring of the electroluminescent layer of the OLED by exposure to UV light. They attached oxetane side groups to the backbone of red-, green-, and blue-light emitting polymers and irradiated with a UV lamp for a short time and then spin-rising to remove the unreacted monomers. This allowed the use of photolithography to selectively cross-link thin films of these polymers. Temperatures around 60 ℃ gave the best resolution. The fabricated display was 200 × 600 μm2 in size, and it
exhibited good efficiency and color saturation.
Figure 1.21. Mechanism of acid mediated oxetane ring opening polymerization.
However, there still remains a problem, even when using 25 wt % of PAG. Only 84% of the polymer film was cross-linked. The large amount of PAG used was problematic as it can potentially lead to increased amounts of unreactive cations. Another approach is to use oxiranes as cross-linkers. These are similar to oxetanes, but they have the advantages of shorter curing time and less harsh conditions. McDowell et al.33 presented a protocol for photopatterning
derivatives of poly(3,6-dimethoxy- 9,9-dialkylsilafluorenes) with resolutions exceeding 10 μm. The oxirane undergoes CROP by a simple photoacid and patterns were achieved by using photomasks with only 1 s of UV exposure. Curing at 90 ℃, and subsequent submersion in toluene for 30 s to remove non-cross-linked material gave good resolutions. The resulting cross-linked material possess blue photoluminescence with high solid state quantum yields (>80%) inFigure 1.21.
Figure 1.22. Oxiranes used by Mcdowell(left) and the blue photoluminescence pattern (right). Adapted with permission from33. Copyright (2014) American Chemical Society.
An alternate route is the pre-fuctionalization of conjugated polymers in organic semiconductors by diazides. These liberate singlet nitrenes and extrude nitrogen upon photolysis. Cho and co-workers34 pursued this approach and they used bis(perfluorephenyl)-azide (bis-PFPA) as a
cross-linker to form a robust solvent-resistant film. This prevented solvent-induced erosion during subsequent solution based device processing. These n-doping (N-NMBI) of semiconducting polymers improved the power conversion efficiency (PCE) of solar cells from 0.69% to 3.42%. The resulting devices showed good air stability, along with another important step towards efficient solution processed OPVs.
Figure 1.23.The structure of inverted solar cells and the materials used for in situ cross-linking and doping of electron transporting materials. Reprinted with permission from [34]. Copyright
(2011) WILEY-VCH.
Introducing cross-linking diazidesto alkylated polymer has its advantages. Mostly, the products can be synthesized without additional functional cross-linkable groups or reagents. The process is fast and it is compatible with any alkyl-substituted host. By optimizing the crosslinker structure, undesired side-reactions such as aromatic C-H-insertions can be suppressed. The polymers’ core can also be photo-activated, for example with an anthraquinone core. Although this core undergoes a reversible reduction process, it can self-polymerize by irradiating at 254 nm and 360 nm. The redox property was however destroyed during the photochemical process. And, most of the photoinitiators are expensive and they are environmentally deleterious. Much improvement of this method is required for it to become eco-friendly.
1.3 Electroluminochromic materials
Electroluminochromic materials, defined similarly to electrochromic materials, undergo reversible changes in photoluminenscence with an applied external charge. This property is of great importance in optoelectronics applications, like phones’ screens. These changes can either be emission wavelength or emission intensity. Unlike electrochromic materials, their electroluminochromic counterparts and their applications such as smart windows, smart optoelectronic displays, military camouflage coatings and sensing probesare comparatively fewer in quantity and they are less established.35The emissions of these materials are bleached when they
are either electrochemically oxidized or reduced. In some cases, their emission wavelength shifts, thus giving a new emission color that is ideal for signal applications. A material that can be both electrochromic and electroluminochromic in the visible region is of interest. However, sustained reversible florescence quenching remains a challenge with small molecules and they have poor durability. Polymers on the other hand, are advantageous because they are electrochemically more robust on the device surface. Comparing to small molecules, polymers are less likely to delamination, they have better film homogeneity. Via non-conjugated structural linkages or groups onto the fluorophore moieties, there is lesser electronic communication between them. However, their emission intensity is usually decreased due to their tangled structure and narrowing of their energy gap. One possible pathway is to design and synthesis of novel organic materials with multi-fluorochromic states by coupling different fluorophore moieties, i.e., switching between two or more different emission colors (instead of quenching) via control of the external electrical voltage applied. Or, another possible way is to improve the device fabrication process as to make more homogeneous layers for example by using vacuum evaporator.
1.3.1 Benzothiadiazole as core
fluorophores.36 These compounds were found to exhibit solvochchromism, electrochromic and
electrofluorochromic properties. For the cynao derivative, it changed from yellow to mauve in color by applying +1.3 V potential for 30s in an electrolyte solution. For the nitro derivative, it changed from yellow to pale violet and its fluorescence colour changed from grey-green to green, while undergoing the oxidation process. Tailoring the UV-visible color and emission wavelength are possible by modifying the electronic group of the BZT core. The application of push-pull chromophores will be explored in this master thesis.
Figure 1.24.Structure of benzothiadiazole (BZT) derivatives.
1.3.2 Extension of TPA
An indolo[3,2-b]carbazole derivative bearing two diphenylamine termini has been synthesized by Liu’s group in 2017. They extended the TPA group to a carbazole, leading to good electrochemical and photoluminescence properties.37 By applying different potentials, a
completely reversible conversion among three different colors (light-yellow, red, and blue) was possible. Moreover, a reversible turn-off and turn-on of its luminescence could also be tuned by electrochemical oxidation and reduction, respectively. This study extended the electroluminochromic materials into NIR region, as the oxidized species showed strong absorptions in the NIR region.
Figure 1.25. Color tuned properties by different potentials. Reproduced with permission from37.
Copyright (2017), Elsevier.
azomethine bonds.38 With electrochemical oxidation, the compound’s absorbance changed from
yellow to blue, while its photoluminescence intensity decreased sharply. Both molecules exhibited solvatochromism and they were also found to be aggregation induced emission (AIE, vide infra) active, which is of significance for its use in solid state devices.
Figure 1.26. Structure of two azomethines.
From these two categories, it is evident that electro-active emitters are possible by combining the TPA core with conventional fluorophores. The remaining challenge is to maintain a high degree of emission in the solid state. This will be further demonstrated in chapter 2.
1.4 Aggregation induced emission effect
Typically, organic compounds that are aggregation induced emission (AIE) active have planar structures and they have higher photoemission efficiencies in solid state than in the solution. This is referred to as aggregation caused quenching. However, some fluorophores remain emissive when they are either aggregated or in the crystallized state.39The mechanism can be summarized
along the following. According to fundamental physics, any movement, micro and macroscopic alike, consume energy. The intramolecular rotations of aromatics in AIE compounds that are active in solution serve as relaxation channels for its excitons to non-radiatively decay. In contrast in the aggregate state, the intramolecular rotations are restricted due to the physical constraint. The non-radiative pathways are blocked, leading to an increase in the solid state emission. This theory is referred to as restriction of intramolecular rotations (RIR).
The first AIE compound was reported by Tang et al (Figure 1.27).40 The emission of the
compound increased two orders of magnitude as the water fraction in the mixture solution increased.
Figure 1.27.Structure of 1-methyl-1,2,3,4,5-pentaphenylsilole.
Since Tang’s discovery, the area has become a hot field of interest because AIE could be used in various applications, including, biosensors,41 organic perovskites,42 OLEDs 43 and so on. Not
surprisingly, the TPA group continues to play an important role in AIE based organic electronics. Liou’s group took advantage of TPA and viologen groups to build a series of electrochromic materials.44 These materials can undergo reversible oxidation, resulting in quenching of the
original yellow emission. Fusing these two functional groups lowered the working potentials, shortened the switching response times, and increased the photoluminescence on/off contrast ratios.
Figure 1.28.Structure of AIE TPA derivatives demonstrated by Liou.44
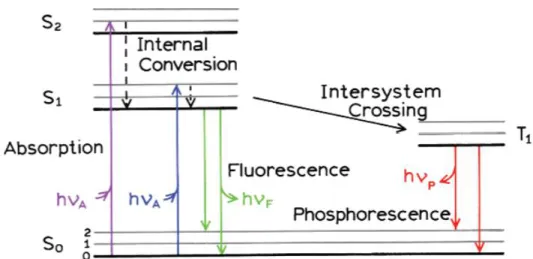
1.5 Jablonski diagram.
The Jablonski diagram is a diagram that illustrates the electronic states of a molecule and the transitions between them.45 It shows both radiative and non-radiative transitions. From the
ground state S0to excited singlet states S1, S2....Sn, and undergo intersystem crossing to the triplet
excited state T1, T2...Tn. In a system with two spin -1/2 particles for example, the proton and
electron in the ground state of hydrogen, measured on a given axis, each particle can be either spin up or spin down so the system has four basis states in all. For the triplet states, there are three states with a total spin angular momentum 1. While for singlet states, there is only one state with total spin angular momentum 0, which leads to 25 % of singlet states and 75% of triplet states. Taking S2 as an example, the excited state can relax to the first excited state via internal
conversion, followed by non-radiative process such as molecular vibration. From S1 to S0, the
process can be radiative resulting in fluorescence. It is fast and often occurs within nanoseconds. If the energy gap between the S1 and T1 states is sufficiently small, intersystem crossing can
occur. This leads to another form of radiative decay, which is phosphorescence. This process is usually longer than the fluorescence decay.
Figure 1.29. Energy states for a single molecule. Reprinted with permission from46. Copyright
(2006), Springer.
1.6 Problems to be solved
From the literature survey described above, it is apparent that a win-win solution is possible with organic molecules in that they can be both electrochromic and electroluminochromic. This is addition to their many advantages compared to their inorganic counterparts such as an extensive palette of colors in visible and NIR region, better processability and compatible with flexible substrates. Unfortunately, organic materials lag in applications compared to the inorganic counterparts. For example, inorganic electrochromic materials have been commercially used in ‘smart’ windows, such as the Boeing 787 Dreamliner’s window.47 Organic molecules further
suffer from poor durability as the electrochromic layer can undergo self-bleaching in a short period time. However, for further eco-friendly requirements, the trend to replace inorganic materials with organic materials is inevitable. The challenge remains to design organic molecules that perform better than their inorganic counterparts such as color changes in the visible region, reversible fluorescence quenching, extend electrochemical durability and consistent emission color and wavelength with applied potentials. Nowadays, we can have organic electrochromic materials that change colors in the visible region or electrofluorochromic materials that change the emission color either by ‘on-off’ or by shfting the emission wavelength. However, to combine this two properties together, we have to design materials that remain high emission yield in solid state while still have the electrochromic abilities. Thus, AIE effect comes up to our mind that can design the compound with high emission yield in solid state. By attaching the electrochromic groups with the AIE core could solve this problem. Moreover, most of the studies have focused on the area of active layer in the operating device. The device has to be continously applying potential to maintain the colors. For energy saving aspect, it is better to make passive devices which means with once potential applied, it can remain the color for a longer time until a reversible potential applied to switch the color back. Thus, a complementary opposite layer in the operating device can be applied.
1.7 Objectives
To date, most materials are exclusively electrochromic. They therefore change colors in the visible spectrum with applied potential with limited fluorescence change. There are limited examples of materials capable of undertaking a dual chromic role; being electrochromic and electrofluorochromic.48, 49 Towards this end, it is of interest to develop materials whose
electrochemically mediated property changes include both reversible color changes and emission quenching in the visible region. To date, how to remain the emission yield in the solid state is a major problem for electrofluorochromic devices due to the self quenching. One possible way is to take advantages of AIE effect. Benzothiadiazole is one of the famous compound which can have great emission yield both in solution and solid state. To make the compound also electrochromic, TPA group can be introduced in to the design. This two process lead to the compound which has both electrochromic and electrofluorochromic potentials. By coupling with different end groups, electron-withdrawing or electron-donating. The compounds can be either ‘push-pull’ or ‘push-push’ to have different electron properties which can tune the spectrum range of absorption or emission. Towards these ends, benzothiadiazole fluorophores were investigated as potential dual-role materials. The effect of various electron withdrawing groups of a series of benzothiadiazole fluorophores on the key properties for their dual-role use in operating devices were evaluated. While people are putting great efforts on the active devices which a continuous potential has to be applied to keep the color switching, the new generation device-passive device can save a lot of energy due to the color memory effect. Anthraquinone derivatives were chosen due to the capacity of the core which can provide the memory effect. Further polymerize it on the surface can extend the stability and durability of this layer.
References
1. Klauk, H., Organic electronics: materials, manufacturing, and applications. John Wiley & Sons: 2006.
2. Granqvist, C. G., Handbook of inorganic electrochromic materials. Elsevier: 1995.
3. Akimoto, K., Semiconductor device including zinc oxide containing semiconductor film. Google Patents: 2012.
4. Dunbar, K. R.; Heintz, R. A., Chemistry of transition metal cyanide compounds: Modern perspectives.
Progress in Inorganic Chemistry1997, 45, 283-392.
5. Karyakin, A. A., Prussian blue and its analogues: electrochemistry and analytical applications.
Electroanalysis: An International Journal Devoted to Fundamental and Practical Aspects of Electroanalysis2001, 13 (10), 813-819.
6. Zloczewska, A.; Celebanska, A.; Szot, K.; Tomaszewska, D.; Opallo, M.; Jönsson-Niedziolka, M., Self-powered biosensor for ascorbic acid with a Prussian blue electrochromic display. Biosensors and
Bioelectronics2014, 54, 455-461.
7. Itaya, K.; Shibayama, K.; Akahoshi, H.; Toshima, S., Prussian‐blue‐modified electrodes: An application for a stable electrochromic display device. Journal of Applied Physics1982, 53 (1), 804-805.
8. Groenendaal, L.; Jonas, F.; Freitag, D.; Pielartzik, H.; Reynolds, J. R., Poly (3, 4‐ethylenedioxythiophene) and its derivatives: past, present, and future. Advanced materials2000, 12 (7),
481-494.
9. Se, M.; Papillon, J.; Schulz, E.; Lemaire, M., New synthetic method for the polymerization of alkylthiophenes. Tetrahedron letters1999, 40 (32), 5873-5876.
10. Wang, Q.; Takita, R.; Kikuzaki, Y.; Ozawa, F., Palladium-catalyzed dehydrohalogenative polycondensation of 2-bromo-3-hexylthiophene: an efficient approach to head-to-tail poly (3-hexylthiophene). Journal of the American Chemical Society2010, 132 (33), 11420-11421.
11. Jonas, F.; Krafft, W.; Muys, B. In Poly (3, 4‐ethylenedioxythiophene): Conductive coatings,
technical applications and properties, Macromolecular Symposia, Wiley Online Library: 1995; pp
169-173.
12. Dietrich, M.; Heinze, J.; Heywang, G.; Jonas, F., Electrochemical and spectroscopic characterization of polyalkylenedioxythiophenes. Journal of Electroanalytical Chemistry1994, 369 (1-2),
87-92.
13. Bockman, T.; Kochi, J., Isolation and oxidation-reduction of methylviologen cation radicals. Novel disproportionation in charge-transfer salts by X-ray crystallography. The Journal of Organic Chemistry
1990, 55 (13), 4127-4135.
14. Porter, W. W.; Vaid, T. P.; Rheingold, A. L., Synthesis and Characterization of a Highly Reducing Neutral “Extended Viologen” and the Isostructural Hydrocarbon 4, 4 ‘‘‘‘-Di-n-octyl-p-quaterphenyl.
Journal of the American Chemical Society2005, 127 (47), 16559-16566.
15. Quinton, C.; Alain‐Rizzo, V.; Dumas‐Verdes, C.; Miomandre, F.; Clavier, G.; Audebert, P., Redox‐and protonation‐induced fluorescence switch in a new triphenylamine with six stable active or non‐active forms. Chemistry–A European Journal2015, 21 (5), 2230-2240.
![Figure 1.1: Cyclic voltammogram of Prussian Blue. Reprinted with permission from [5]](https://thumb-eu.123doks.com/thumbv2/123doknet/7657513.238151/16.914.159.739.130.556/figure-cyclic-voltammogram-prussian-blue-reprinted-permission.webp)
![Figure 1.3: Photos of EDOT-based polymers with different bandgaps. Reprinted with permission from [8]](https://thumb-eu.123doks.com/thumbv2/123doknet/7657513.238151/18.914.164.722.108.353/figure-photos-edot-polymers-different-bandgaps-reprinted-permission.webp)

![Figure 1.10: First report of TPA-polyimides. Reprinted with permission from [18] . Copyright (2005) American Chemical Society.](https://thumb-eu.123doks.com/thumbv2/123doknet/7657513.238151/22.914.134.628.120.329/figure-polyimides-reprinted-permission-copyright-american-chemical-society.webp)