Drag and crosswind sensitivity of rounded fastback
vehicle
Giacomo Rossitto
∗1,2, Christophe Sicot
2, Val´
erie Ferrand
3, Jacques Bor´
ee
2and Fabien
Harambat
11
PSA Peugeot Citro¨
en, Velizy-Villacoublay, France.
2
Institut Pprime, UPR-3346 CNRS, ENSMA, Universit´
e de Poitiers, France
3Institut Sup´
erieur de l’A´
eronautique et de l’Espace (ISAE-SUPAERO), Universit´
e de
Toulouse, France.
1
Problem Statement
For the last decades car manufacturers have been facing the challenging task of reducing fuel consumption and
CO2 emissions. In response to that, optimization algorithms have been applied to generate new vehicle shapes
minimizing the aerodynamic drag. Since the obtained optimum shapes has no brand differentiating details, stylists are nowadays trying to give back a brand signature by proposing ”non-conventional” shapes. In that framework, important rear pillar rounding becomes a differentiation strategy. The current study proposes to qualify the influence of such afterbody rounding on the flow field and on drag development over a fastback vehicle.
Very few papers have addressed the question of rear edges curvature in aerodynamic performances. Thacker et al. [1] showed that rounding the edge between the roof and the rear slant on the Ahmed body [2] results in a 10% drag reduction. Authors attributed this reduction to the fully attached flow over the backlight and the downstream shift of the structures developing in the near wake. Fuller et al. [3] analyzed the benefits of rounding the rear pillar geometry on the Davis model. They observed that rounded edges generate a different wake structure dominated by an interaction between the longitudinal vortices and the separated region, resulting in a drag reduction of 11%.
From the literature review, it appears that rounding afterbodies affects considerably aerodynamic loads and flow fields, but systematic investigation into the effects of changing radii of side backlight edges was not reported. In complement to the recent study proposed by the same authors (Rossitto et al.[4]) over a simplified car model (Ahmed body), the present study addresses this question on a realistic car model equipped with various rear pillar curvatures. Special care is given to understand how the modified flow on the backlight interacts with the near wake and promotes drag changes.
Four rear ends are analyzed combining S-PIV to balance and wall pressure measurements to fully characterize the flow structures and the associated aerodynamic forces. The zero yaw configuration is first explored before focusing on crosswind effects. Complementary numerical simulations are systematically applied to complete the experimental data and help physical analysis.
2
Results and discussion
The model and its relevant dimensions are reported in figure 1. Four different rear ends, differing by their side pillar curvature are tested. The curvature radius is given as a percentage of the model span, i.e. 300mm. The model equipped with sharp pillars having 0% radius is referred as S0 and it is considered as the reference case. The others models are S8, S20and S40. All the rear ends have the same curvature at the end of the roof to avoid any flow separation. The corresponding radius is chosen to maximize the room for the rear passengers for a fixed backlight angle of 23◦. The horizontal projection of the slanted surface, i.e. 440mm, will be used as reference length. Starred spatial coordinates are normalized by the reference length while starred velocities are normalized by the free stream velocity.
Numerical simulations are computed with the commercial code P owerF LOW c developed by Exa based on
lattice Boltzmann method. The size of the model for the numerical simulation corresponds to a real vehicle. At Reynolds 1.04 e7, 324000 time-steps are computed (3 seconds of real time). In the following, temporally averaged velocity and pressure fields will be present. These averages are computed over approximately 25 convective time scales L/U0where L is the length of the body and U0 the external velocity.
The experimental results reported in this work were acquired from tests conducted in the PSA Peugeot Citro¨en
wind tunnel of La Ferte Vidame. All data were gained at 40m/s corresponding to a Reynolds number based on the length of the model of 2.6e6. A 6 components balance was used to measure the aerodynamic forces acting
on the model. Static wall pressure coefficients were recorded by 35 pressure probes over the vertical surface of the rear end. Furthermore, PIV and S-PIV measurements were performed in the wake of the model.
300mm 105 0mm 440mm z x y
Figure 1: Fastback vehicle model and location of the rounded edge
Table 1 reports the variation of aerodynamic coefficients and averaged base pressure relative to the reference case. Increasing the side radius generates a small reduction of the drag and a significant reduction of the lift.
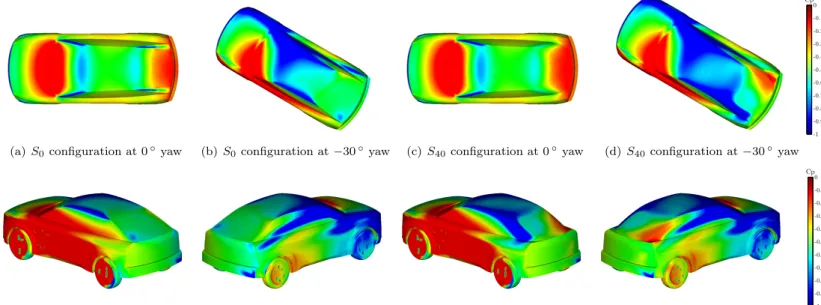
For the S0 model, most of the lift is generated over the rear end by the low value of pressure over the curved
roof of the model and from the low pressure footprint of the longitudinal vortices, figure 7(a). These structures are generated by the interaction of the flow coming from the side of model and the flow over the rear window [4]. For a moderate value of C-pillar rounding, it will be shown that the origin of the longitudinal vortices is displaced toward the base of the body along the C-pillar. For larger rounding, three-dimensional flow separation does not occur anymore on the side of the model. Therefore, C-pillar rounding has a very strong effect on the way the longitudinal vorticity is distributed in the near wake [4]. For sharp pillars, the longitudinal vorticity is concentrated in the so called C-pillar vortices. For round pillars, such structures are weak or even canceled while longitudinal vorticity is shed and recirculates in the near wake. The weakening of the C-pillar vortices allows a pressure recovery over the rear window reducing its contribution to drag and lift. However, the variation of the average base pressure over the vertical surface, reported in table 1 and figure 2, gives evidence that the pressure acting over the vertical base is reduced when the radius of curvature is increased. This counter-balances the local drag reduction of the rear window, and can explain the weak effect of pillar rounding on the global drag (table 1), resulting in a small drag reduction compared to the sharp pillar model.
∆Cd ∆Cl ∆Cp Base
S0 - -
-S8 0% -13% -12%
S20 -1.5% -18% -15%
S40 -2% -27% -17%
Table 1: Variation of aerodynamic coefficients and averaged base pressure relative to S0.
(a) S0 (b) S8 (c) S20 (d) S40 -0.1 -0.09 -0.08 -0.07 -0.06 -0.05 -0.04 Cp
Figure 2: Wall Pressure measurement
Mean Velocity Fields
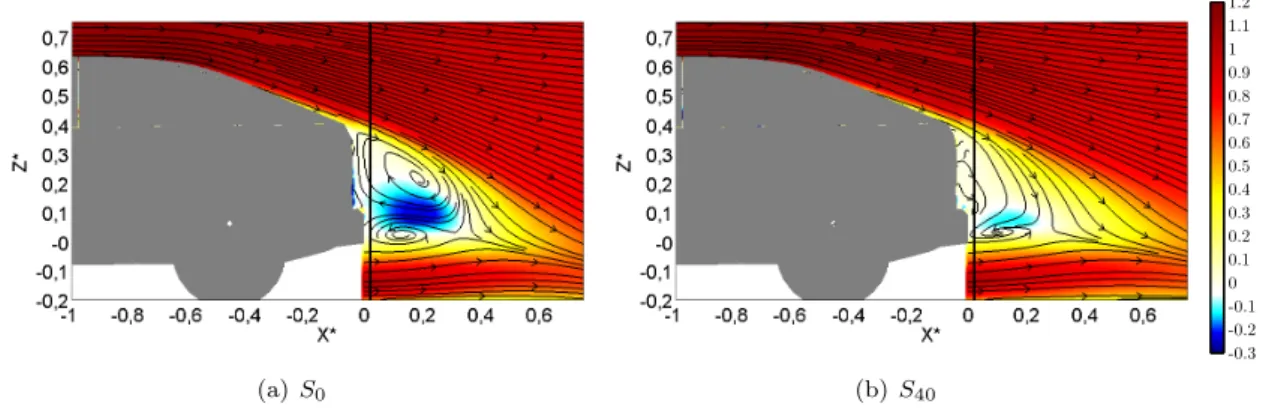
The mean velocity fields in the symmetry plane of the model are reported in figure 3. It was chosen not to report the intermediate configurations, i.e. S8and S20, to focus on the main differences between the most rounded rear pillar S40 and the sharpest one, S0. The symmetry plane is far to be sufficient to describe the entire topology of the tridimensional near wake, nevertheless it is very useful to get a first hint of the changes made by the
side rounding. For S0, the average separated zone in the close wake is characterized by two counterrotating
structures. The mean recirculating length can be identified by the saddle point of the 2D mean streamlines. Adding pillar curvature reduces this length and modifies the topology of the enclosed structures. To understand the complex involved mechanism, a cross-flow plane from numerical simulations is displayed in figure 5. For
the S0 configuration, the earlier mentioned C-pillar vortex is visible on the mean streamwise vorticity figure
4. For the S40 configuration, the flow does not roll-up anymore over the C-pillar, but penetrates towards the
center-line of the backlight, figures 5(a) and 5(b). The effects of the different organization of the flow caused by the elimination of the C-pillar vortex is analyzed in detail in the work of Rossitto et al. [4]. The authors explain the cause of the downwash in the near wake for the round model and the consequent tridimensional organization of the near wake.
(a) S0 (b) S40 -0.3 -0.2 -0.1 0 0.1 0.2 0.3 0.4 0.5 0.6 0.7 0.8 0.9 1 1.1 1.2 U∗
Figure 3: Time averaged streamlines and mean streamwise velocity U* at Y*=0. Solid dark lines represent the
location of the S-PIV plane
S0 S40 −0.1 0 0 .1 0 .2 0 .3 0 .4 0 .5 0 .6 0 .7 −0.6 −0.4 −0.2 0 0.2 0.4 0.6 Y* Z* -10 -8 -6 -4 -2 0 2 4 6 8 10 Ω∗ X
Figure 4: Mean streamwise vorticity at X*=
0.03. Left S0, Right S40. (a) S0 (b) S40 -0.8 -0.7 -0.6 -0.5 -0.4 -0.3 -0.2 -0.1 0 0.1 Cp
Figure 5: Time averaged streamlines from numerical simula-tions. In figures (a) and (b) the streamlines and the surface of the body are colored by the pressure coefficient Cp
Crosswind
To gain further insight on the influence of the afterbody rounding on the aerodynamic characteristics of the
model, crosswind tests were performed. Figures 6 reports experimental aerodynamic coefficients in [−30◦; 0◦]
yaw angles. −0.2 −0.04 0.12 0.28 0.44 0.6 −30 −20 −10 0 Degrees CYrear S0 S8 S20 S40 0 0.08 0.16 0.24 0.32 0.4 −30 −20 −10 0 Degrees Clrear S0 S8 S20 S40 −0.3 −0.22 −0.14 −0.06 0.02 0.1 −30 −20 −10 0 Degrees C MZ S0 S8 S20 S40
Figure 6: Aerodynamic coefficients. Left: Cyrear, Center: Clrear, Right: CMZ
As a general trend the absolute value of the yawing moment CMZ, growths with an increasing C-pillar
radius. If CYf ront, not shown here, does not have important differences among the four rear ends, on the
contrary, CYrearexperiences significant changes. It is important to notice that CYrearacts as a counter-rotating force to the yawing moment. This means that increasing the side rear force induces yawing moment reduction. The rear lift in [−10◦; 0◦] is alike 0◦ yaw angle: the S0has stronger rear lift compared to S40due to the C-pillar vortices and their induced flow over the rear window. Interesting inversion of the behavior appears for yaw angles
smaller than −15◦. The S40 model experiences a sudden growth of rear lift due to the flow acceleration around
the rounded rear pillar towards the backlight, creating a strong suction on the side of the model. For the S0
model at β = −30◦, the pillar vortex disappeared, due to the flow separation over the rear window, resulting in moderate growths of rear lift compared to the rounded model.
The differences in the yawing moment could be explained therefore by the different pressure distributions over the rear window and over the leeward side, figure 7. First, on the windward side, the suction over the C-pillar of the S40model reduces the intensity of the side force. Furthermore, on the leeward side, the more intense pressure foot-print of the C vortex of the S0 model respect to the S40 one, helps to increase the side force and thus to reduce the yawing moment.
(a) S0configuration at 0◦yaw (b) S0configuration at −30◦yaw (c) S40configuration at 0◦yaw (d) S40configuration at −30◦yaw
-1 -0.9 -0.8 -0.7 -0.6 -0.5 -0.4 -0.3 -0.2 -0.1 0 Cp
(e) S0 configuration at −30◦yaw, windward side (f) S0 configuration at −30◦yaw, leeward side (g) S40configuration at −30◦yaw, windward side (h) S40configuration at −30◦yaw, leeward side -1 -0.9 -0.8 -0.7 -0.6 -0.5 -0.4 -0.3 -0.2 -0.1 0 Cp
Figure 7: Pressure wall visualization, numerical simulations. This work has been performed in the framework of the ”OpenLab Fluidics” @Poitiers.
References
[1] Adrien Thacker, S Aubrun, A Leroy, and Philippe Devinant. Effects of suppressing the 3d separation on the rear slant on the flow structures around an ahmed body. Journal of Wind Engineering and Industrial Aerodynamics, 107:237–243, 2012.
[2] SR Ahmed, G Ramm, and G Faitin. Some salient features of the time-averaged ground vehicle wake. Technical report, Society of Automotive Engineers, Inc., Warrendale, PA, 1984.
[3] Joshua Fuller and Martin A Passmore. The importance of rear pillar geometry on fastback wake structures. Journal of Wind Engineering and Industrial Aerodynamics, 125:111–120, 2014.
[4] G. Rossitto, C. Sicot, V. Ferrand, J. Bor´ee, and F. Harambat. Influence of afterbody rounding on the pressure distribution over a fastback vehicle. Experiments in Fluids, 2016.