OATAO is an open access repository that collects the work of Toulouse
researchers and makes it freely available over the web where possible
Any correspondence concerning this service should be sent
to the repository administrator:
[email protected]
This is an author’s version published in: http://oatao.univ-toulouse.fr/21999
To cite this version:
Sarih, Houda
and Tchangani, Ayeley
and Medjaher, Kamal
and Péré, Eric Critical components identification based on
experience feedback data in the framework of PHM. (2018) In: 16th
IFAC symposium on information control problems in manufacturing
- INCOM 2018, 11 June 2018 - 13 June 2018 (Bergame, Italy).
Critical components identification based on experience
feedback data in the framework of PHM
Houda SARIH*, Ayeley TCHANGANI*, Kamal MEDJAHER* Eric PERE**
* Ecole Nationale d'Ingénieur de Tarbes, Laboratoire Génie de Production (e-mail: houda.sarih, kamal.medjaher, [email protected]) ** WorldCast Systems, Mérignac (e-mail: [email protected])
Abstract: Preventive maintenance is recognized nowadays as a way of addressing adequately industrial
systems or assets health management problem. To this end, approaches such as prognostics and health management (PHM) are being developed by researchers to support making predictive maintenance decisions by relaying on quantitative indicators such as remaining useful life (RUL); that is basically the projected time to failure of a given system. In general, an industrial system is composed of many components which failure may lead to the failure of the system; so that identification of such components which are referred to as critical components, constitute therefore an important stake. The process of identifying such components is based on many methods encountered in the literature among which experience feedback is drawing more and more attention of researchers because of, among other reasons, the fact that companies dispose nowadays of huge amount of functioning data of their systems. The aim of this paper is to develop a methodology based on experience feedback to identify critical components of a given industrial system. The proposed methodology will be applied to a real world case in broadcast industry to show its feasibility.
Keywords: Predictive maintenance, Prognostics and Health Management, Experience feedback, Critical components.
1. INTRODUCTION
The progress in developing new technologies in many manufacturing companies has marked these last few years by the acceleration of their generalization. This innovation permits to give some more attractiveness to products that in return creates some competiveness between manufacturers; innovation should be understood in large including products as well as processes and functions. To take up innovation challenge, one can act on different levers, among which: research and development, imitation, purchase of technology, and predictive maintenance. The latter one has gained more and more attention and is being positioned as a strategic function to guarantee effective service and competitiveness of proposed products by many manufacturers.
The necessity to dispose of a maintenance service in a company is related to the necessity to maintain equipments in their operational conditions, to reduce their down time and eventually to enhance the quality of the produced products. A main challenge nowadays for companies is to be able to provide their markets in the best conditions of cost, shortest time, and high quality products that customers are increasingly looking for. As a results, effort must be made to avoid breakdowns, to act quickly when they occur in order to increase the availability of the equipment. To this purpose, it is necessary to develop methods, procedures and algorithms to analyze data collected from functioning conditions of existing equipment in order to extract relevant information
regarding the state of health and then anticipate their failures and their maintenance. One solution to tackle such challenge is PHM. In the literature, PHM is defined as a process of seven functional levels [1]: 1) data acquisition, 2) data processing, 3) condition assessment, 4) diagnostics, 5) prognostics, 6) decision analysis, 7) human machine interface. PHM can be relied either on physical models, data driven models (obtained through data analysis processes) or a combination of these models. The objective sought by the data analysis is twofold: firstly, to detect sudden failures and diagnose their causes, secondly, to anticipate failures and, consequently, to increase product's lifetime. Generally, the data contain relevant information about the behavior of the equipment’s components. Some of these components are critical as their failure may lead to the failure of the whole equipment. It is then important to identify them in order to continuously monitor their health state and take appropriate decisions to increase their availability and consequently the availability of the equipment [2].
The process of identifying critical components in terms of dependability can be considered through several methods among which experience feedback is gaining more and more attention within practitioners in companies as well as academic researchers. This paper aims at proposing a methodology to identify critical components, of a given system based on experience feedback data. The remainder of this paper is organized in 4 sections: the second section deals with the proposed methodology by presenting its purpose as
well as different steps. In this section, the subsection 3 deals specifically with the main contribution of this paper in terms of using experience feedback data for the process of identifying the critical components. The third section is devoted to the application of the developed method to a real world case in the domain of broadcast products in order to show its effectiveness. Finally, the fourth section concludes the paper and presents some future works.
2. PROPOSED METHODOLOGY
This section presents the methodology developed in this paper for identifying critical components of a given system. The section is organized in three subsections: the first subsection presents the existing approaches used in the literature to deal with such issues, the second subsection deals with experience feedback and subsection 3 is related to the presentation of the main steps of the proposed methodology.
2.1 Existing approaches
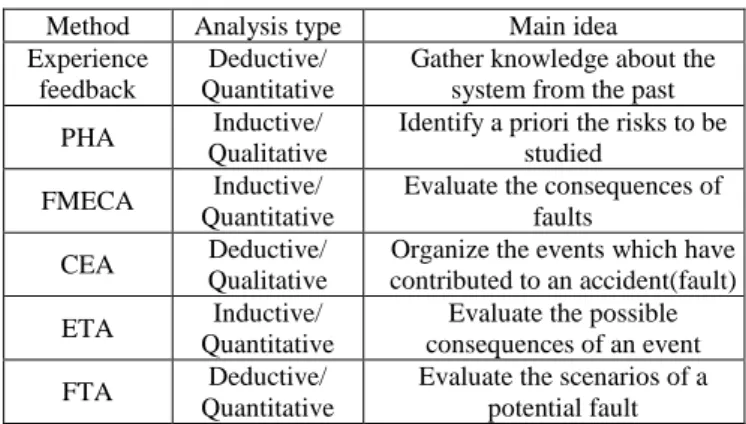
The process of identifying critical components in terms of functioning of systems has been addressed in the literature mainly through dependability tools such as the ones presented here after:
- Failure mode, effects and criticality analysis (FMECA): FMECA is an extension of failure mode and effects analysis (FMEA) to integrate the criticality of the failure of a component on the functioning of a system [3]. The results of a FMECA analysis is a table that can be considered as an information system from which one can draw needed information to manage a system.
- Fault tree analysis (FTA) [4]: FTA is a top down, deductive failure analysis in which an undesired event of a system is analyzed using a Boolean logic to combine a series of lower-level events. The outcomes of a FTA consist in qualitative structural results such as minimum cut sets, a critical vector as well as quantitative indicators such the probability of occurrence of top events given that of elementary events, importance factors in terms for instance of risk augmentation/diminution, diagnosis factor, etc. of components.
- Event tree analysis (ETA) [5]: contrary to FTA, ETA is a bottom up logically modeling approach for analyzing the failure or the success of the function of a system or the success of a mission from a single initiating event.
- Cause and effects analysis (CEA) [6]: CEA is a combination of FTA and ETA to go from some elementary events to a top event that constitutes an initiating event for some effects.
- Process Hazard Analysis (PHA) [7]: PHA is a set of systematic assessments of the potential hazards faced or associated with an industrial system, an industrial process, a mission, etc. The aim of this method is to assist managers with making decisions related to the safety.
- Experience feedback (EF) [8]: EF is a structured approach for capitalization, processing and exploitation of knowledge derived from the analysis of positive and/or negative events. These methods are summarized in Table 1 along with their kind of analysis (inductive or deductive), the information used (qualitative or quantitative), and their main ideas.
Method Analysis type Main idea Experience
feedback
Deductive/ Quantitative
Gather knowledge about the system from the past PHA Inductive/
Qualitative
Identify a priori the risks to be studied
FMECA Inductive/ Quantitative
Evaluate the consequences of faults
CEA Deductive/ Qualitative
Organize the events which have contributed to an accident(fault) ETA Inductive/
Quantitative
Evaluate the possible consequences of an event FTA Deductive/
Quantitative
Evaluate the scenarios of a potential fault
Table 1. Main methods which can be used for identifying critical components.
Among these methods, our choice was to use the experience feedback. This choice is motivated by the fact that most companies have significant amount of data that can be exploited to extract relevant information and knowledge among which critical components for PHM and predictive maintenance.
2.2 Experience feedback
According to [9], the aim of experience feedback is to collect, archive and analyze data which are specific to the behavior of facilities and main equipment. It permits for a better understanding of performances and the detection of weak points within a company.
There are basically three ways to collect raw data:
1. Customer feedback: in many cases, manufacturers offer not only the products but also some after sold services so that collection of failure data can be carried out by the after-sales service.
2. Intervention cards of the maintenance service: when technicians of maintenance service intervene to repair a failure, they register most of the time some data that can be used as input to preventive maintenance policy procedures; among these data are those mentioned below:
The beginning, end, and duration of the intervention.
The name of the examined system.
The nature of the intervention: mechanical, electrical, pneumatic, etc.
The type and the broken down organ.
Replaced parts or elements.
A brief technical account of the intervention.
To know if tests have been carried out.
The general approach for experience feedback can be summarized in five steps [10]:
Analysis of any abnormal event.
Research of causes and successions.
Research of lessons.
Definition of corrective measures.
Diffusion of gathered knowledge.
2.3 Proposed methodology for critical components identification
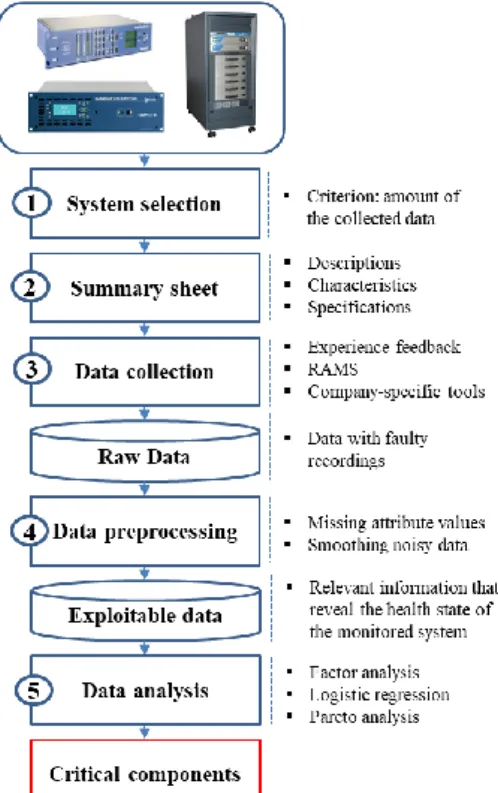
In this section, the description of the generic methodology to collect data and to identify critical components by exploiting the experience feedback will be explained in details. The methodology relies on five steps as shown in Figure 1.
Figure 1. Identifying critical components methodology flowchart.
1 System selection
In a company there are many products. The first step consists in choosing the system to analyze. One possible criterion to do this is to proceed by the amount of the collected data, that is the choice will be made according to the product which has a maximum representative data over a long period.
2 Systems summary sheet
In this step, a system’s summary sheet is created. A system can have different ranges with the same components in each range. For example, a FM (Frequency Modulation) transmitter 100 W and another of 300 W. The objective is to identify the functions that they represent and understand the interactions between the components for each range of the system. Figure 2 illustrates the composition of a summary sheet.
Figure 2. Systems summary sheet. 3 Data collection
The objective of this step is to collect available data of the system for quantitative risk estimation and extraction of relevant information. The data are collected on identical equipment under the same design conditions. Several methods mentioned in subsection 2.1 and other tools which are specific to the company can be used. Figure 3 summarize the tools that can be used for data collection. In this figure RAMS stands for Reliability, Availability, Maintainability, Safety.
Figure 3. Review of available data.
Among these tools, the experience feedback, which is the focus of this paper, is gaining more attention because of the possibility of collecting and storing significant amount of data. Raw data from experience feedback can be collected as described in Figure 4:
Figure 4. Raw data from experience feedback. 4 Data pre-processing
The objective of this step is to pre-process the raw data in order to extract relevant information that reveal the health state of the monitored system (Figure 5). The pre-processing tasks can be looking for, missing attribute values, checking the criticality of the failed component on the system, smoothing noisy data, etc.
5 Data analysis
Exploitable data collected from experience feedback will be analysed and classified in this step to identify the critical components needed in the PHM application (Figure 6). This task is achieved together with operator’s expertise.
Figure 6. Data analysis.
3. APPLICATION AND RESULTS
The methodology described in the previous section is applied to different ranges of case study in the field of radio and television broadcasting. The case study consists of a FM transmitter. It is a real case taken from a real company.
3.1 System selection
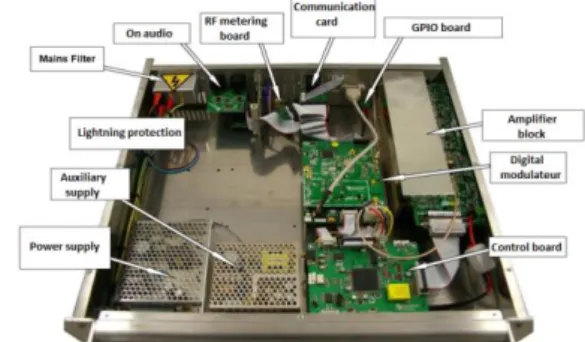
The company designs and develops a wide range of innovative broadcast equipment for the Radio & TV worldwide markets. The company has lot of products, which include audio codecs, FM transmitters, RF (Radio Frequency) signal monitoring, RDS (Radio Data System) encoders, audio processors and remote site control units. The FM transmitter is a complex system composed of different subsystems (Figure 7), each providing a set of basic functions, all contributing to the realization of the main function of the transmitter which ensures the emission of an FM radio program. These subsystems process the transmitted signal (frequency/modulation) and amplify it (to increase the range of this signal) before sending it to the transmitting antenna (for example the Eiffel Tower in Paris or the Bouliac antenna near Bordeaux). The FM transmitters are usually installed in dedicated broadcast stations.
FM broadcast stations are strategically located to broadcast a program to a population pool, usually an agglomeration, but it can also be a road/highway, etc.
Figure 7. FM Transmitter.
3.2 Summary sheet
A file was created with a summary sheet for each range of the system. Each summary sheet contains the following information:
Name of the system.
Image of the system.
Description.
Characteristics.
Price.
Name and image of all system components.
Synoptic.
Specifications.
These summary sheets regroup all the information concerning the studied system and forms a knowledge database.
3.3 Data collection
The data collected from intervention cards of the maintenance service, customer service feedback and company specific tools are saved in an Excel document containing the information needed to find the critical components. This document is created for the aim to serve users and also to structure the database, organize it and prepare the data collection.
The time period chosen for data collection is from 2011 to 2016, because the company has a significant experience feedback database during this period. This database contains the history of failures, the degradations occurred and the maintenance operations.
The company has several ranges for FM transmitter, depending on the power. The analysis of the collected data is performed on all these ranges because they have the same components.
An example of some useful fields of the collected data to identify critical components is illustrated in Table 2. Among these data, one can cite the following:
- Number of the returns of a product: if a product is often returned due to failure of a same component, it is therefore necessary to study the reliability of this component.
- The sale and return dates of the product permit to identify if the failure is due to aging or an earlier failure and also to detect components criticality: for instance, a component can fail once for a long period, but that failure may lead to a long downtime of the system; on the other hand, a component may fail often but with short or insignificant downtime.
For confidentiality reasons, other parameters of valuable information are not displayed in Table 2.
Product
Number of returns
Sale date Return date Failed component Range 1 2 17/04/2013 10/07/2013 Component 1 Range 1 2 17/04/2013 02/01/2014 Component 1 Range 1 2 17/10/2011 08/11/2011 Component 2 Range 2 2 05/10/2011 13/01/2012 Component 3 Range 3 5 09/12/2011 16/01/2012 Component 1 Range 3 2 13/12/2011 16/01/2012 Component 3 Range 3 4 13/12/2011 16/01/2012 Component 1
Table 2. Collected database.
Once the data are collected, most of the time they will need to be pre-processed in order to extract useful and exploitable information; this is the purpose of the following subsection.
3.4 Data pre-processing
In the field of experience feedback, data quality is paramount as it has a direct impact on the reliability of the results and the interpretation of the experience feedback. Obtaining exploitable data requires pre-processing that will determine the accuracy and the appropriateness of experience data for a specific purpose, such as identifying critical components, which is the concern of this paper.
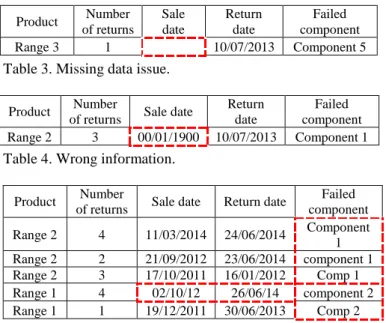
During pre-processing, some abnormalities can be detected such as: missing data (Table 3), incorrect or impossible information (Table 4) where a registered date is obviously not possible, non-identical structures and/or nomenclature (Table 5). These issues must be correctly addressed at this stage in order not to distort the results of the subsequent steps. For the case study considered in this paper, an analysis was made to assess, correct, verify collected data and validate them by an expert from the company before using them. To identify the critical components, a filtering process has been carried out to disregard components that have no impact on the system such as those for which there is no failure registered as shown in Table 6, where the problem was about abnormal use of the product by the customer.
Product Number of returns Sale date Return date Failed component Range 3 1 10/07/2013 Component 5
Table 3. Missing data issue.
Product Number
of returns Sale date
Return date
Failed component Range 2 3 00/01/1900 10/07/2013 Component 1
Table 4. Wrong information.
Product Number
of returns Sale date Return date
Failed component Range 2 4 11/03/2014 24/06/2014 Component 1 Range 2 2 21/09/2012 23/06/2014 component 1 Range 2 3 17/10/2011 16/01/2012 Comp 1 Range 1 4 02/10/12 26/06/14 component 2 Range 1 1 19/12/2011 30/06/2013 Comp 2
Table 5. Structures and/or nomenclature issue.
Product Number
of return Sale date
Return date Failed component Range 1 1 22/12/2011 16/01/2014 No fault
Table 6. Returning products without failure issue.
Once the collected data are pre-processed to remove or correct faulty recordings, one can consider analyzing the cleaned data. The process of data analysis is presented in the following subsection.
3.5 Data analysis
Data analysis is a well established scientific domain with a plethora of mathematical tools which choice depends on many criteria such as the nature of data (numerical, qualitative or mixing of them) and the purpose of analysis (classification, estimation, clustering, ranking, etc.). The output of this analysis constitutes a decision support tool for the company.
Among the existing data analysis tools one can cite: factor analysis (FA) which is a statistical method used to describe variability within the observed data [11], logistic regression (LO) that studies the association between a categorical dependent variable and a set of independent variables [12], to name few. From these tools, one that is well suited for identifying critical components is the Pareto analysis that leads to laws such as the failure of a small percentage (in general 20%) of components will lead to a great percentage of the criticality (for instance 80% of down time) [13]. These 20% components constitute therefore the critical components to which one must pay attention.
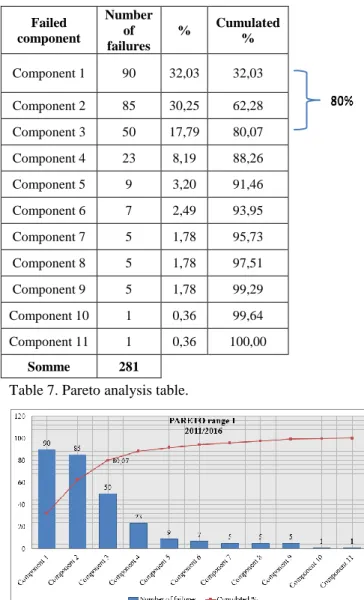
In this work, Pareto analysis is applied to the collected pre-processed data of the considered case study to obtain the results shown in Table 7 and on Figure 8. In this Table, the number of failures per component is used as the criticality indicator.
In real world problem criticality assessment, obviously cannot be based on a single criterion. In this paper, though the frequency of components failure is presented as the critical components selection criterion, other criteria were considered like the price of the components, the cost of the maintenance activities, the cost of delivery of the product after repair, etc. However, these criteria cannot be given for confidentiality reasons.
The blue bars of Figure 8 and the orange curve represent respectively the number of failures and the cumulated percentage of failures. From this Figure one can see that 3 components out of 11 (or 27% of the components) are responsible of 80% of the failures of the product range. Within the company, the same critical components were identified in the most product ranges, which validates the methodology proposed in this paper.
Failed component Number of failures % Cumulated % Component 1 90 32,03 32,03 Component 2 85 30,25 62,28 Component 3 50 17,79 80,07 Component 4 23 8,19 88,26 Component 5 9 3,20 91,46 Component 6 7 2,49 93,95 Component 7 5 1,78 95,73 Component 8 5 1,78 97,51 Component 9 5 1,78 99,29 Component 10 1 0,36 99,64 Component 11 1 0,36 100,00 Somme 281 Table 7. Pareto analysis table.
Figure 8. Pareto diagram.
For some ranges, other critical components than those identified and also less than 3 critical components were found. Indeed, the contexts and the conditions within which the products are used may play a crucial role in the appearance of failures. Among these conditions, one can cite the environmental factors such as temperature, pressure, moisture, dust and insects.
4. CONCLUSIONS
The necessity of predictive maintenance, which relies massively on quantitative data has been demonstrated in this paper as a strategic function toward the ability of companies to achieve competitiveness. To set up this new maintenance strategy, one needs to dispose of data. These data can be obtained from databases of systems users; but most of the time they are not directly exploitable, so one needs to organize and structure the way of searching for valuable data. In this paper, a methodology has been proposed to obtain reliable and exploitable monitoring data for a PHM application and to support predictive maintenance. This requires multidisciplinary skills and close collaboration between the manufacturer and the system operator, which
may dispose of valuable information. This information can be drawn from the knowledge of previous events, namely experience feedback. In the proposed methodology, the experience feedback is used to identify the critical components to monitor. The criticality may depend on different criteria (down time of the system when the component fails, the number of failures for a given period, reparation difficulty, costs, etc.) depending on the pursued goal.
As a future work and in order to obtain good diagnostic results, an FMECA method could be applied. This will allow analyzing the various failures of these critical components and inventor the possible failure modes and their criticality. REFERENCES
[1] R. Gouriveau, K. Medjaher, N. Zerhouni. From Prognostics and Health Systems Management to Predictive Maintenance 1: Monitoring and Prognostics. John Wiley & Sons, 2016.
[2] A. Mosallam, K. Medjaher, N. Zerhouni. Component based data-driven prognostics for complex systems: Methodology and applications. First International Conference on Reliability Systems Engineering – Prognostics and System Health Management Conference - Beijing, China, 2015.
[3] H. Pentti, and A. Helminen. Failure mode and effects analysis of software-based automation systems, 2002.
[4] C. Ericson. Fault tree analysis. System Safety Conference, Orlando, Florida, 1999.
[5] D. Huang, C. Toly, J. Mao-Jiun. A fuzzy set approach for event tree analysis. Fuzzy sets and systems 118.1, 153-165, 2001. [6] T. Umeda, et al. A graphical approach to cause and effect analysis of chemical processing systems. Chemical Engineering Science 35.12, 2379-2388, 1980.
[7] S. Kariuki, K. Lowe. Integrating human factors into process hazard analysis. Reliability Engineering & System Safety 92.12, 1764-1773, 2007.
[8] U. Kjellén. Prevention of accidents through experience feedback. CRC Press, 2000.
[9] A. Lannoy. Experience feedback. Techniques de l'ingénieur, 2011.
[10] Y. Verot. Experience feedback in the process industries. Techniques de l'ingénieur, AG4610, 2001.
[11] I. Jolliffe. Principal Component Analysis and Factor Analysis. Principal component analysis. Springer New York, 115-128, 1986. [12] J. Hosmer, W. David, S Lemeshow, R. Sturdivant. Applied logistic regression. Vol. 398. John Wiley & Sons, 2013.
[13] G. Karuppusami, R. Gandhinathan. Pareto analysis of critical success factors of total quality management: A literature review and analysis, The TQM Magazine, Vol. 18 Issue: 4, pp.372-385, 2006.