OATAO is an open access repository that collects the work of Toulouse
researchers and makes it freely available over the web where possible
Any correspondence concerning this service should be sent
to the repository administrator:
[email protected]
This is a Publisher’s version published in:
http://oatao.univ-toulouse.fr/26044
To cite this version:
Ayerdi Gotor, Alicia and Berger, Monique and Labalette, Françoise and
Centis, Sylvie and Daydé, Jean and Décriaud-Calmon, Anne
Comparative
analysis of fatty acids, tocopherols and phytosterols content in sunflower
cultivars (Helianthus annuus) from a three-year multi-local study. (2015)
Phyton, 84 (1). 14-25. ISSN 0031-9457
Análisis comparativo del contenido en ácidos grasos, tocoferoles y fitoesteroles en cultivares de
girasol (Helianthus annuus) en un estudio trianual y multilocal
Ayerdi Gotor A
1,5*, M Berger
1, F Labalette
2, S Centis
3, J Daydé
1, A Calmon
1,4Resumen. El aceite de girasol es naturalmente rico en ácidos
grasos no saturados y en numerosos componentes menores. Posee altos niveles de α-tocoferol y fitoesteroles que podrían desempeñar un papel importante en la protección de las plantas. Estos micronutrientes, tocoferoles y fitoesteroles, también presentan beneficios para la salud de los seres humanos, reduciendo el riesgo de padecer enfermedades cardiovasculares y trastornos del envejecimiento. El α-tocoferol representa más del 95% de los tocoferoles del girasol y tiene la mayor actividad vitamínica. Además, este aceite contiene altas cantidades de β-sitoesterol que es un prometedor fitoesterol benéfico para la salud. El objetivo de este estudio fue comparar el contenido y la composición de ácidos grasos, tocoferoles y fitoesteroles en el aceite de girasol entre los diferentes cultivares y sitios en un experimento de tres años, y evaluar las relaciones entre estos componentes minoritarios, los ácidos grasos y las condiciones climáticas. Los resultados revelaron que el contenido y la composición de estas moléculas principalmente están determinados por el genotipo de la planta. Sin embargo, las condiciones ambientales parecen influir mucho en el contenido de tocoferoles. Los resultados sugieren una posible mejora genética del girasol con respecto a sus componentes menores.
Palabras clave: Aceite de girasol; Ácidos grasos; Tocoferoles;
Fitoesteroles; Interacción genotipo x ambiente; Temperatura. Abstract. Sunflower oil is naturally rich in both unsaturated
fatty acids and numerous minor components, with high levels of α-tocopherol and phytosterols that could play an important role in plant protection. These micronutriments, tocopherols and phytoster-ols, also exhibit health benefits for humans including reducing both cardiovascular diseases and aging disorders. α−Tocopherol repre-sents more than 95% of total sunflower tocopherol and has the great-est vitaminic activity. Furthermore, this oil contains high amounts of β-sitosterol which is a promising health beneficial phytosterol. The objective of this study was to compare the content and compo-sition of fatty acids, tocopherols and phytosterols in sunflower oil between different cultivars and locations in a three-year experiment, and to estimate the relationships between these minor components, fatty acids and climatic conditions. Results revealed that content and composition of these molecules are mainly determined by plant genotype. Nevertheless, the environmental conditions seemed to strongly influence the tocopherol content. The results suggest pos-sible improvement in sunflower breeding for minor components.
Keywords: Sunflower oil; Fatty acids; Tocopherols; Phytosterols;
Genotype x environment interaction; Temperature.
1 Université de Toulouse; Institut National Polytechnique de Toulouse; Ecole d’Ingénieurs de PURPAN; Département Sciences Agronomiques et Agroalimentaires; Laboratoire d’Agrophysiologie; 75 voie du TOEC, BP 57611, F-31076 Toulouse Cedex 3, France.
2 ONIDOL; 12 avenue George V, F-75008 PARIS, France. 3 ASEDIS-SO; 39 chemin Virebent, F-31200 TOULOUSE, France. 4 INRA; UMR 1010 CAI; F-31030 Toulouse Cedex 4, France.
5 Institut Polytechnique LaSalle Beauvais; BP 30313, F-60026 Beauvais Cedex, France. Tel: + 33 (0)3 44 06 25 49 - Fax: +33(0)3 44 06 25 26 (Permanent address). Address Correspondence to: Alicia Ayerdi Gotor, Institut Polytechnique LaSalle Beauvais BP 30313, 60026 BEAUVAIS CEDEX, France. Tel : + 33 (0)3 44 06 25 49 - Fax : +33(0)3 44 06 25 26, e-mail: [email protected]
INTRODUCTION
Sunflower world production represents up to 20% of the total world production of oil seeds (FAO, 2013). France was the 9th world sunflower producer in 2003 and 2004 with 2
million hectares; this surface has increased up to 2.5 millions in 2011 (France was 14th in the sunflower producers ranking)
(FAO, 2013). Sunflower oil is rich in natural micronutrients, and various studies have shown the health benefit properties of polyunsaturated fatty acids (PUFA), tocopherols and phy-tosterols. The ingestion of PUFAs can have beneficial effects on human health such as the reduction of fatal coronary heart disease by decreasing the plasma low density lipoproteins (LDL)-cholesterol (Ruiz-Gutiérrez et al., 1997; Zock & Ka-tan, 1998). Vitamin E isomers and specially α-tocopherol are able to reduce the risk of cardiovascular disease and exhibits anti-carcinogenic activities (Bramley et al., 2000; Beardsell et al., 2002). This can be achieved through prevention of poly-unsaturated fatty acids oxidation and free radicals scaveng-ing (Niki, 2004). Since it is retained by the liver by means of a specific transfer protein, α-tocopherol is considered to be the most biologically active form (Packer et al., 2001). Sterols inhibit cholesterol absorption in humans by limiting micellar solubility of cholesterol, leading to a reduction of cholesterol absorption (Kritchevsky, 1997; Thompson & Grundy, 2005; von Bergmann et al., 2005).
Since Seiler (1983), where the factors affecting the vari-ability of fatty acids in sunflower were studied, other studies like Lagravère et al. (2004) have confirmed that genotypes and environmental growing conditions affect fatty acid composi-tion. Various works on the variation of tocopherols and phy-tosterols have been implemented for different vegetal species studying the genotype and environmental effects; however, most of them have focused only in one minor component: Almonor et al. (1998) reported that γ-tocopherol content di-minished in soybeans with reduced temperatures; Goffman and Becker (2002) found significant variations between geno-types and locations for the tocopherol content and composi-tion in rapeseed; Määttä et al. (1999) described a significant difference for the phytosterol content in 7 oat cultivars or for 6 of rye (Zangenberg, 2004), Vlahakis and Hazebroek (2000) found differences in total phytosterol contents among canola, sunflower and soybean crops and also within each crop. Re-garding sunflower, Demurin et al. (1996) and Velasco et al. (2002), have observed that genetic and different environ-mental conditions lead to variation of tocopherols content. However, in these studies only one year of cultivation was considered. Results concerning simultaneous variations in the content and composition of several families of oil components have been rarely addressed in the field. Fatty acids and to-copherols have also been studied in sunflower by Baydar and Erbas (2005), who found a positive correlation between total tocopherol and oleic acid contents. In soybean oil, Dolde et
al. (1999) found a positive correlation between linoleic acid and tocopherol levels. A study including the three families (fatty acids, phytosterols and tocopherols) was also conducted by El-Shami et al. (2001) in rapeseed oil, but no correlations between these components were treated.
Regarding the composition of sunflower oil in health pro-moting molecules (Bramley et al., 2000; Vlahakis & Haze-broek, 2000; Holliday & Phillips, 2001; Velasco et al., 2002; Lagravère et al., 2004) and the importance of sunflower pro-duction in France, the objectives of our study were to (1) in-vestigate the variability and (2) understand the relationship of these three families of components (PUFA, tocopherols and phytosterols) in sunflower oil. Our comparative study was car-ried out in four different commercial varieties grown in differ-ent locations in France during three consecutive years. At the same time, climatic parameters were determined in order to take into account their effects. To the best of our knowledge, this is the first time that a study comparing different varieties and over three years has been performed to study the variabil-ity in sunflower of tocopherol and phytosterol contents, in a multilocal study over a three-year period.
MATERIALS AND METHODS
Sunflower samples. The study was carried out during threeyears: 2002, 2003, 2004. Four commercial sunflower
(Heli-anthus annuus L.) hybrids [Allstar RM (Euralis Semences),
Aurasol (High Oleic, Monsanto Dekalb), Melody (Syngenta Seeds) and Prodisol (Monsanto Dekalb)] were grown in clay-chalky, deep enough (1 m) soils at different locations all over France (Fig. 1, Table 1). Each location is represented by a code number assigned by the French authorities, also called a French department.
In each location, four blocks of around 30 m2 for each
va-riety were sown between April the 1st and 20th. As
recom-mended (Metropolitan Oleaginous Interprofessional Techni-cal Center - CETIOM, France), the seedling rate was 65000 seeds/ha with 0.6 m between rows and 0.25 m between plants. Main plot treatments were: two tillages in Autumn and March-April; weeding using trifluralin, and at pre-seedling and flurochloridone at post-seedling, metaldehyde (7 kg/ha) to control slugs; fungicidal treatments were made when neces-sary with a mix of flusilazole and carbendazime (0.8 L/ ha); and two fertilizations applied: one before spring tillage (60 kg P/ha and 60 kg K/ha) and the other one during the seedling morphological developmental stage (50 kg N/ha with 1.2 kg B/ha). Thus, 97 samples (each one a bulk of the four blocks) were obtained for further analysis (Table 1).
Meteorological dataset. Measurements were taken in six
meteorological stations all over the country: Carcassonne (43° 13’ N, 2° 21’ E; 11th Department), Montignac (45° 47’
Fig. 1. Map of France showing the locations (in grey) where the study took place in the CETIOM (Centre technique interprofession-nel des Oleagineux Metropolitans) farms’ network in 2002-2004.
Fig. 1. Mapa de Francia que muestra los lugares (en gris) en los que se llevó a cabo el estudio en la red de fincas del CETIOM (Centro Téc-nico Interprofesional de los Oleaginosos Metropolitanos) en el período 2002-2004.
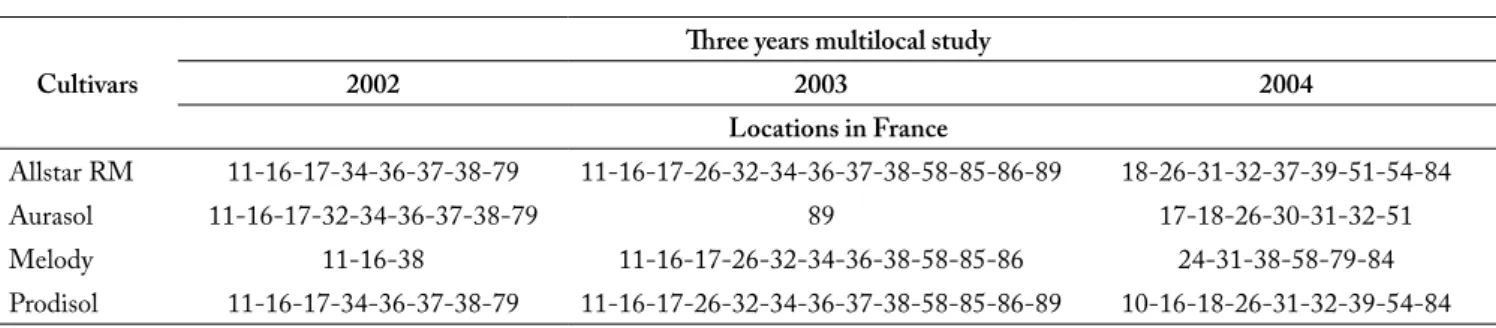
Table 1. Relation of cultivars and planting location for each year. Each location is represented by the department French code number.
Tabla 1. Relación de los cultivares y la ubicación de siembra de cada año. Cada localidad está representada por el número de código de los departamentos franceses.
Cultivars
Three years multilocal study
2002 2003 2004 Locations in France Allstar RM 11-16-17-34-36-37-38-79 11-16-17-26-32-34-36-37-38-58-85-86-89 18-26-31-32-37-39-51-54-84 Aurasol 11-16-17-32-34-36-37-38-79 89 17-18-26-30-31-32-51 Melody 11-16-38 11-16-17-26-32-34-36-38-58-85-86 24-31-38-58-79-84 Prodisol 11-16-17-34-36-37-38-79 11-16-17-26-32-34-36-37-38-58-85-86-89 10-16-18-26-31-32-39-54-84
32nd Department), Montaud (45° 16’ N, 5° 34’ E; 38th
De-partment), Fours (46° 49’ N, 3° 43’ E; 58th Department) and
Blagnac (43° 38’ N, 1° 24’ E; 31st Department). These stations
were selected due to their proximity to a greater number of experimental sites (fields), as well as for representing the 6 major climatic zones in France. This allowed us to consider a larger variability of weather conditions in France, all over the locations of the study during the three years. Four param-eters were considered: rainfall (mm per day), maximun tem-perature (°C per day, TMAX), minimun temperature (°C per
day, TMIN) and radiation (kW/m2) for the period from April
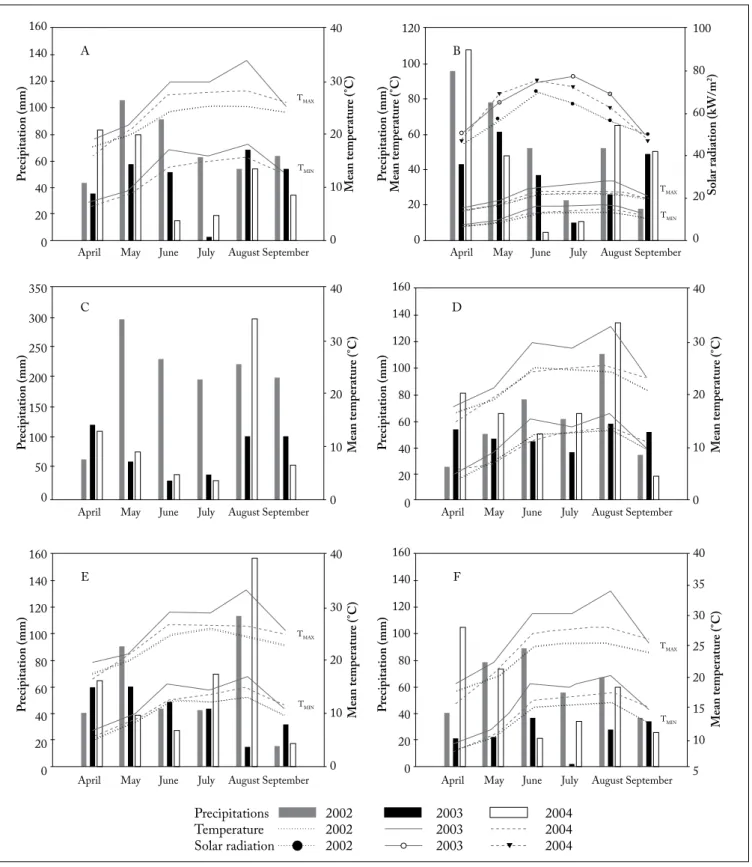
1st to September 30th. Figure 2 sums-up the meteorological
dataset for six locations that represented the six main regions where sunflower is cultivated in France. That allows us to estimate the climate differences in these areas, which could influence minor components content and composition.
Sample Preparation. For each sample, 40 g of akenes were
freeze-dried (HETO CT 110, Saint Herblain, France) and stored at −18 °C.
Reagents and standards. For oil extraction, hexane (mixture of isomers) was obtained from Prolabo-Subra (France), and for analysis, solvents such as hexane, methanol, ethanol, acetone and diethyl ether at HPLC grade from SDS (France) were used. Sodium hydroxide was purchased from Prolabo-Subra (France). All fatty acid standards [palmitic (C16:0), stearic (C18:0), oleic (C18:1), linoleic (C18:2), linolenic (C18:3) and arachidic (C22:0) acids (99% minimum purity)], all ste-rol standards (β-sitosteste-rol, stigmasteste-rol and campesteste-rol), and betulin were purchased from Sigma (Paris, France). The four α-, β-, δ- and γ-tocopherol standards (99% minimum purity) were purchased in a Chromadex kit (USA). Boron trifluoride (BF3) was obtained from Aldrich (France). The trimethyl
si-lyl ether (TMS) derivatives of all sterols were prepared using 1-methyl imidazol and N-methyl-N (trimethylsilyl)- hepta-fluorobutyramide reagent (Sigma, France).
Oil extraction. Sunflower dry-frozen grains were ground with a sample mill (KnifeTec 1095; Foss Tecator AB, Swe-den) during three periods of 10 s. Around 18 g were care-fully weighed in a cellulose cartridge (Whatman ø = 30 mm, h = 100 mm) covered with backcombed cotton (Lohmann & Rauscher). Full cartridges were placed in a six soxhlet ramp for extraction (four hours) with hexane, following the refer-ence method (AFNOR, 1998). Oil was recovered after a low pressure evaporation of the extraction solvent with a rotavapor (HS 40 Huber, Bioblock Scientific, Heildolph) and frozen (−20 °C) to minimize oxydative reactions before analysis.
Fatty acid analysis. Fifty mg of oil were weighed in a glass tube with a refrigerated system. As internal standard, 1 mL of arachidic acid was added and the extracts were saponified
Fig. 2. Climatic conditions: rain Precipitation (sum of daily rainfall in a month, mm); Temperature: mean of maximal (TMAX) and minimal (TMIN) daily temperatures of each month (°C) and sum of daily solar radiation for each month for 6 locations: A: Auch (32); B: Carcassonne (11); C: Montaud (38); D: Fours (38); E: Montignac (16) and F: Blagnac (31) and for the three study years.
Fig. 2. Condiciones climáticas: precipitaciones (suma de las lluvias diarias en un mes, mm), Temperatura: media diaria de máximas (TMAX) y
míni-mas (TMIN) de cada mes (° C) y la suma de la radiación solar diaria para cada mes en 6 lugares: A: Auch (32); B: Carcassonne (11); C: Montaud (38); D: Fours (38); E: Montignac (16) y F: Blagnac (31) para cada uno de los tres años de estudio.
by adding 1 mL of 0.5 M methanolic NaOH, and heated to 65 °C for 30 min. Then, 2.5 mL of methanolic BF3 (12% v/v)
were added, and the mixture was heated for exactly 3 min at 65 °C, followed by a rapid refrigeration and the addition of 5 mL of ultrapure water and 10 mL of hexane (HPLC grade). After vigorous shaking and settle, the organic phase was re-covered and analyzed immediately by gas chromatography.
Analyses were carried out with a Fisons 8000 series gas chromatograph (MMFC 800 Multi-function controller, EL 980 electrometer Unit, Italy) with an autosampler. Splitless in-jections were used with 0.5 mL sample volumes at an inlet tem-perature of 200 °C. Nitrogen carrier gas pressure was 200 kPa.
The fatty acids were separated using a Phenomenex fused silica capillary ZB-FFAP columnn (30 m x 0.25 mm x 0.25 μm, Paris, France). The oven temperature was programmed to (1) begin at 185 °C, (2) hold for 15 min; (3) increase to 200 °C at 5 °C/min and (4) remain constant for 7 min at 200 °C. The flame ionization detector (FID) was operated at 200 °C with hydrogen pressure at 100 kPa and air flow at 60 kPa. The major sunflower oil fatty acids were determined by compari-son of retention times of the fatty acids methylated standards. The calibration results were based on the amount of arachidic acid detected in the sample.
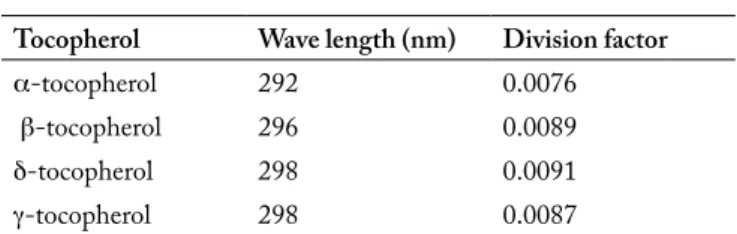
Table 2. Calculation parameters used to determine the real con-centration of the solution with an UV-Spectrophotometer.
Tabla 2. Parámetros de cálculo utilizados para determinar la concen-tración real de la solución con un espectrofotómetro UV.
Tocopherol Wave length (nm) Division factor
α-tocopherol 292 0.0076
β-tocopherol 296 0.0089
δ-tocopherol 298 0.0091
γ-tocopherol 298 0.0087
Solution concentration (µg/ml) = Read absorbance value (mm) Division factor Tocopherols analysis. Following the simplified international norm (ISO, 1997), a methanolic solution of each standard (0.1 mg/mL) was prepared. Solutions were measured with a UV lamp spectrophotometer (Hitachi U-1100 photometer) as it is shown in Table 2. The external calibration was carried out with dilutions of the stock solution with hexane and propan-2-ol (norm modification) to have a range of concentrations between 5 and 40 μg/mL of each form. For each sample, 1g of oil was carefully weighed (Sartorius Analytical balance Precisa 205 A, Italy), and adjusted up to 25 mL with hexane. The mixture was directly injected in a high performance liquid chromatography (HPLC) system (SpectraPhysics, Thermo Separation Products, USA). The complete separation of all native tocopherols was achieved with a normal phase LiChrorosorb Si60 column (250 cm x 4 mm x 5 μm, CIL
Cluzeau, France). The mobile phase was a mixture of hexane/ isopropanol (99.7:0.3 v/v) at 1 mL/min flow rate. Detection was performed with a fluorescence detector (excitation wavelength = 298 nm and emission wavelength = 344 nm; Waters 2475 multi λ). The concentrations of the tocopherol homologs were calculated from the peak area.
Sterols extraction and CPG analysis. Sterols analysis proce-dure is an adaptation of the norm (AFNOR, 1999). The oil (250 mg) was dissolved in ethanol containing 1 mL of a freshly prepared solution of betulin (1mg/mL acetone) as internal standard. Saponification was achieved by adding 5 mL of 5 % (w/v) ethanolic KOH and heating at the boiling point, and kept up for 15 minutes in a refrigeration system. Saponification was stopped with 5 mL of ethanol. The mixture (5 mL) was placed in a glass column fill up with 10 g of aluminum oxide (Neuter, Akt. 1; 50-200 μm; pH 7.5; ICN Prolabo/Subra France) damp-ened with ethanol. After elution a new balloon was placed to recover the unsaponifiable matter washed with 5 mL of ethanol and 30 mL of diethyl ether. Unsaponifiable matter was concen-trated in the balloon by evaporation under pressure of solvents and recovered with 2 mL of diethyl oxide. Then the mixture was evaporated to dryness with nitrogen (N2, Air liquide, France).
Before injection, TMS derivatives were prepared by dissolv-ing the samples of the unsaponifiable fraction into 100-μL of 1-methyl imidazol and N-methyl-N (trimethylsilyl)- hep-tafluorobutyramide (5:95 v/v), and heating the mixture for 15 minutes to 105 °C in an oil bath. The saponification procedure was duplicated for each oil extract. Analyses were performed by a Fisons gas chromatograph (GC 8000 series MMFC 800 Multi-function controller, Italy) with an autosampler. Splitless injections were made with 1 μL sample volumes. Separations were achieved with a Phenomenex fused silica capillary ZB-5 (30 m x 0.25 mm x 0.25 μm, Paris, France). Nitrogen carrier gas pressure was 130 kPa. The injector was at 320 °C and the FID was 320 °C. The initial temperature of the column was 240 °C and increased to 320 °C at 4 °C/min, and held for 10 minutes until it decreased to initial conditions. Identification of sterols was based on the retention time of standards referred to above and with the relative times to betulin given in the norm. The calibration results were based on the integrated areas and adjusted according to the amount of betulin detected in the samples.
Method validation and quality control. Samples have
been analysed by the ITERG reference laboratory (Paris, France). At the same time, one control sample was analyzed daily with each analytical series and for each kind of analysis (fatty acids, tocopherols, sterols) to determinate ageing changes in columns.
Statistical analysis. The data were statistically analyzed
us-ing Statistica V7 (StatSoft, Tulsa, USA). A three-way-ANOVA with three crossed factors (genotype, year) and one imbricated
factor (location) with second order interaction was performed to determine the relationships between fatty acids, total to-copherol, total phytosterol contents, hybrids, planting location and year of study. It was also used to calculate bilateral correla-tion between variables (Pearson correlacorrela-tion coefficients).
RESULTS
Meteorological dataset. The six meteorological locations
showed significant differences for the rainfalls; mean maxi-mal and minimaxi-mal temperatures (p<0.01) between the 3 years (Table 3). Significant differences in temperature were also ob-served between locations. In 2003, the plants were exposed to extreme growth and maturation conditions (highest tempera-tures and lowest rainfall) compared with 2002 (coldest and high precipitations) and 2004 (middle conditions).
Oil and fatty acid content. The sunflower seeds yielded
around 50% oil by soxhlet extraction (Table 4). However in
Table 3. Mean values for each year for the 6 locations except for solar radiation that is analyzed only in Carcassonne.
Tabla 3. Valores medios anuales de los 6 lugares a excepción de la radiación solar que se analiza sólo en Carcassonne.
Year Precipitation (mm) TMAX (°C) TMIN (°C) Solar Radiation (kW/m2)
2002 60.25 a 22.82 a 11.57 a 57.06 a
2003 39.48 b 26.39 b 13.51 c 64.12 b
2004 55.33 a 23.96 a 12.32 b 62.16 b
Values in the same column with the same letter are not statistically different at the 5% significance level.
2003, we observed significant differences between oil yields: Melody in the 16th location: 0.38 g/g of dry matter (DM) vs.
Prodisol in the 26th location: 0.61 g/g DM. Nevertheless, in
the ANOVA analysis, neither the effect of year and genotypes, nor their interactions were significant as shown in Table 7. Concerning fatty acid (FA) composition (Table 4), three cul-tivars (Allstar RM, Melody and Prodisol) had high linoleic acid content, moderate oleic acid content and traces of lino-lenic acid content, whereas Aurasol presented a high level in oleic acid and moderate linoleic acid content. Palmitic acid was the only major saturated acid (4-6%) either in high oleic or in high linoleic cultivars. There was a significant difference in fatty acid composition (percentage) both between varieties within a year (p<0.001) and between the years for the four cultivars (p<0.001). The genotype x year (G x Y) interaction was not significant for fatty acid composition. In 2002, with a colder and a more rainy summer, 3 varieties (Allstar RM, Aurasol and Prodisol) showed higher content in oleic acid compared to 2003 and 2004.
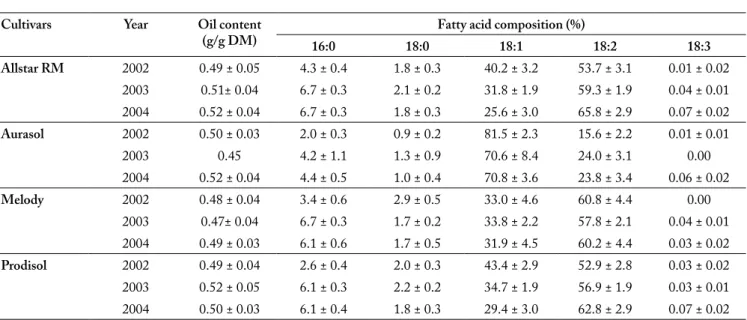
Table 4. Oil and fatty acid amount for each sunflower hybrid and each year. The average over all the locations in a year was given by mean value ± SD.
Tabla 4. Cantidad de aceite y de ácidos grasos para cada híbrido de girasol por año. La media de todos los lugares en un año es dada por el valor promedio ± DE.
Cultivars Year Oil content
(g/g DM) 16:0 18:0 Fatty acid composition (%)18:1 18:2 18:3 Allstar RM 2002 0.49 ± 0.05 4.3 ± 0.4 1.8 ± 0.3 40.2 ± 3.2 53.7 ± 3.1 0.01 ± 0.02 2003 0.51± 0.04 6.7 ± 0.3 2.1 ± 0.2 31.8 ± 1.9 59.3 ± 1.9 0.04 ± 0.01 2004 0.52 ± 0.04 6.7 ± 0.3 1.8 ± 0.3 25.6 ± 3.0 65.8 ± 2.9 0.07 ± 0.02 Aurasol 2002 0.50 ± 0.03 2.0 ± 0.3 0.9 ± 0.2 81.5 ± 2.3 15.6 ± 2.2 0.01 ± 0.01 2003 0.45 4.2 ± 1.1 1.3 ± 0.9 70.6 ± 8.4 24.0 ± 3.1 0.00 2004 0.52 ± 0.04 4.4 ± 0.5 1.0 ± 0.4 70.8 ± 3.6 23.8 ± 3.4 0.06 ± 0.02 Melody 2002 0.48 ± 0.04 3.4 ± 0.6 2.9 ± 0.5 33.0 ± 4.6 60.8 ± 4.4 0.00 2003 0.47± 0.04 6.7 ± 0.3 1.7 ± 0.2 33.8 ± 2.2 57.8 ± 2.1 0.04 ± 0.01 2004 0.49 ± 0.03 6.1 ± 0.6 1.7 ± 0.5 31.9 ± 4.5 60.2 ± 4.4 0.03 ± 0.02 Prodisol 2002 0.49 ± 0.04 2.6 ± 0.4 2.0 ± 0.3 43.4 ± 2.9 52.9 ± 2.8 0.03 ± 0.02 2003 0.52 ± 0.05 6.1 ± 0.3 2.2 ± 0.2 34.7 ± 1.9 56.9 ± 1.9 0.03 ± 0.01 2004 0.50 ± 0.03 6.1 ± 0.4 1.8 ± 0.3 29.4 ± 3.0 62.8 ± 2.9 0.07 ± 0.02
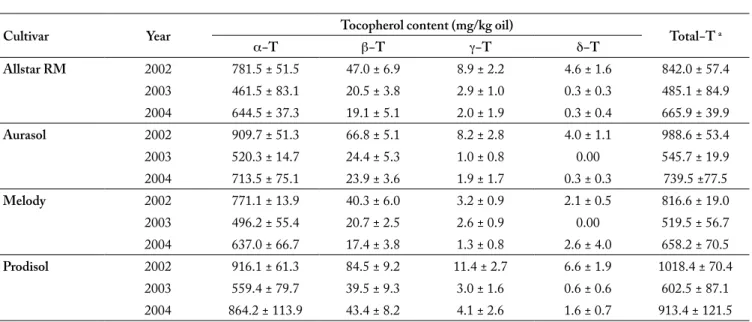
Table 5. Tocopherol amount for each sunflower hybrid and each year. The average over all the locations in a year is given by the mean value ± SD.
Tabla 5. Cantidad de tocoferol para cada híbrido de girasol por año. La media de todos los lugares fue dada por el valor promedio ± DE para cada año.
Cultivar Year Tocopherol content (mg/kg oil) Total−T a
α−T β−T γ−T δ−T Allstar RM 2002 781.5 ± 51.5 47.0 ± 6.9 8.9 ± 2.2 4.6 ± 1.6 842.0 ± 57.4 2003 461.5 ± 83.1 20.5 ± 3.8 2.9 ± 1.0 0.3 ± 0.3 485.1 ± 84.9 2004 644.5 ± 37.3 19.1 ± 5.1 2.0 ± 1.9 0.3 ± 0.4 665.9 ± 39.9 Aurasol 2002 909.7 ± 51.3 66.8 ± 5.1 8.2 ± 2.8 4.0 ± 1.1 988.6 ± 53.4 2003 520.3 ± 14.7 24.4 ± 5.3 1.0 ± 0.8 0.00 545.7 ± 19.9 2004 713.5 ± 75.1 23.9 ± 3.6 1.9 ± 1.7 0.3 ± 0.3 739.5 ±77.5 Melody 2002 771.1 ± 13.9 40.3 ± 6.0 3.2 ± 0.9 2.1 ± 0.5 816.6 ± 19.0 2003 496.2 ± 55.4 20.7 ± 2.5 2.6 ± 0.9 0.00 519.5 ± 56.7 2004 637.0 ± 66.7 17.4 ± 3.8 1.3 ± 0.8 2.6 ± 4.0 658.2 ± 70.5 Prodisol 2002 916.1 ± 61.3 84.5 ± 9.2 11.4 ± 2.7 6.6 ± 1.9 1018.4 ± 70.4 2003 559.4 ± 79.7 39.5 ± 9.3 3.0 ± 1.6 0.6 ± 0.6 602.5 ± 87.1 2004 864.2 ± 113.9 43.4 ± 8.2 4.1 ± 2.6 1.6 ± 0.7 913.4 ± 121.5
a. Total tocopherol calculated as the sum of all 4 isomers
Table 6. Phytosterol amount for each sunflower hybrid and year. The average over all locations in a year is given by the mean value ± SD.
Tabla 6. Cantidad de fitoesterol de cada híbrido de girasol por año. La media de todos los lugares fue dada por el valor promedio ± DE para cada año.
Cultivars Year Phytosterol (g/100 g oil) Total−P a
Campesterol Stigmasterol β−Sitosterol
Allstar RM 2002 37.4 ± 4.4 41.8 ± 6.9 231.3 ± 20.2 440.6 ± 37.0 2003 36.9 ± 3.5 34.1 ± 4.4 212.2 ± 19.2 360.0 ± 36.7 2004 39.2 ± 9.4 35.0 ± 7.8 198.8 ± 26.5 350.4 ± 56.5 Aurasol 2002 35.5 ± 3.4 38.6 ± 3.7 202.4 ± 22.4 388.8± 29.9 2003 41.1 ± 11.4 42.1 ± 9.4 236.6 ± 52.5 404.2 ± 94.2 2004 32.3 ± 7.7 30.0 ± 8.8 193.4 ± 34.0 306.8 ± 54.8 Melody 2002 35.9 ± 1.6 35.9 ± 0.2 188.5 ± 7.7 370.2 ± 22.52 2003 36.2 ± 4.1 30.3 ± 4.2 198.1 ± 20.1 338.8 ± 34.8 2004 30.8 ± 3.2 21.5 ± 3.7 193.2 ± 24.8 299.1 ± 34.33 Prodisol 2002 44.9 ± 2,6 39.5 ± 1.8 229.5 ± 10.7 467.7 ± 22.6 2003 36.5 ± 3,9 31.2 ± 6.6 195.4 ± 21.8 337.4 ± 44.3 2004 45.4 ± 13.5 34.7 ± 11.1 227.5 ± 40.0 358.9 ± 68.9
a. Total phytosterol calculated as the sum of campesterol, stigmasterol, β−sitosterol and Δ7−campesterol, Δ5−avenasterol, Δ7−stigmasterol
and Δ7−avenasterol, data not shown.
Tocopherol composition and content. α−tocopherol
represented the greatest proportion of total tocopherols, ranging from 88.5 to 97.9%, whereas β-tocopherol was less expressed (1.6 − 9.1%). We observed only traces of γ-tocopherol and δ-tocopherol. The tocopherol content in the seed oil varied between 303.8 mg/kg oil (Allstar in 2003, 85th
location) and 1187.9 mg/kg oil (Prodisol in 2004, 54th
loca-tion) (Table 5).
We observed an important decrease of tocopherol content in 2003 vs. 2002 (around 40%), which was probably caused by the high temperatures during the 2003 summer. ANOVA (Table 7) showed that both genetic background and years (explained
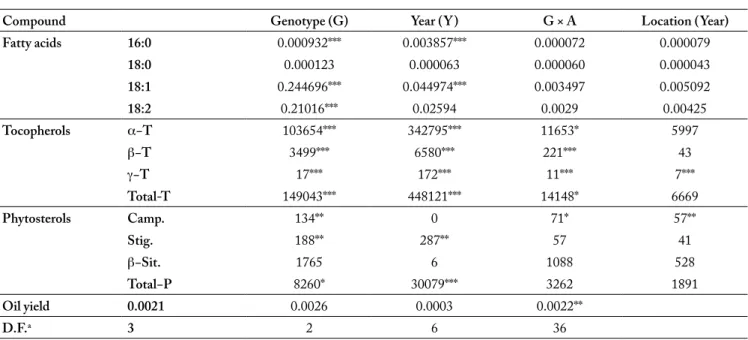
Table 7. Mean squares of combined analysis of variance for oil content (g/g DM) and Stearic (16:0), Palmitic (18:0), Oleic (18:1) and Lin-oleic (18:2) acid concentrations (%); for α-, β-, γ- and total tocopherol contents (mg/kg oil) and for campesterol, stigmasterol, β-sitosterol and total phytosterol contents (g/kg oil). The factors were cultivars (n = 4, namely Allstar RM, Aurasol, Melody and Prodisol), years (n = 3, 2002 to 2004) and locations (experimental culture locations in France).
Tabla 7. Cuadrados medios del análisis de varianza combinado para la cantidad de aceite (g/g MS) y la concentración de ácidos grasos (%): esteárico (16:00), palmítico (18:0), oleico (18:1) y linoleico (18:2); la cantidad de tocoferoles totales y de α-, β-, γ- tocoferol (mg/kg de aceite), y de la cantidad total en fitoesteroles y de campesterol, estigmasterol y β-sitosterol (g/kg de aceite). Los factores estudiados fueron los cultivares (n = 4, es decir, Allstar RM, Aurasol, Melody y Prodisol), los años (n = 3, 2002 a 2004) y la ubicación (localización de las parcelas en Francia).
Compound Genotype (G) Year (Y) G × A Location (Year)
Fatty acids 16:0 0.000932*** 0.003857*** 0.000072 0.000079 18:0 0.000123 0.000063 0.000060 0.000043 18:1 0.244696*** 0.044974*** 0.003497 0.005092 18:2 0.21016*** 0.02594 0.0029 0.00425 Tocopherols α−T 103654*** 342795*** 11653* 5997 β−T 3499*** 6580*** 221*** 43 γ−T 17*** 172*** 11*** 7*** Total-T 149043*** 448121*** 14148* 6669 Phytosterols Camp. 134** 0 71* 57** Stig. 188** 287** 57 41 β−Sit. 1765 6 1088 528 Total−P 8260* 30079*** 3262 1891 Oil yield 0.0021 0.0026 0.0003 0.0022** D.F.a 3 2 6 36 a. Degree of freedom *, **, *** significant at p=0.05, p=0.01 and p=0.001
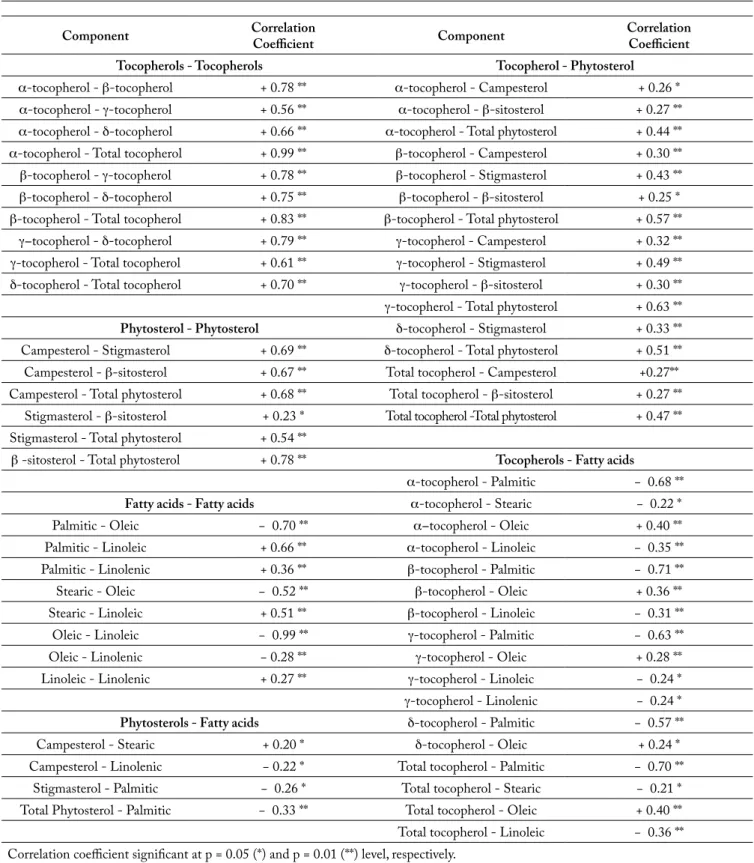
mainly by climatic conditions during grains filling) significantly affect each tocopherol and total tocopherol content in the oil (p<0.001). No statistical significance for α-tocopherol or total tocopherol content between locations was observed. The correlations between tocopherol isomers were generally positive and highly significant (Table 8). The α-tocopherol content was closely related to the total tocopherol content (r² = 0.99; p<0.05). Moreover, β-tocopherol and total tocopherol contents were also positively correlated (r² = 0.83; p<0.05).
Phytosterol composition and content. The most
abundant sterol in all cultivars tested was β-sitosterol (around 60%), followed by campesterol stigmasterol, Δ7-campesterol and Δ5-avenasterol (Table 6). stigmasterol and Δ7-avenasterol were also detected and quantified but at very low levels. Total phytosterol content in oils tested ranged between 228.9 mg/100 goil (Aurasol in 2004 in the 26th location) and
501.6 mg/100 g oil (Prodisol in 2002 in the 11th location).
The total phytosterol content was significantly higher in 2002 than in 2003 or 2004, but these variations were less important than those observed for tocopherol content. Differences in phytosterol content between years 2002 and 2003 ranged from +4% to -28% among (or: depending on varieties) varieties.
ANOVA (Table 7) showed that the year affect total phytosterol content in oil (p<0.001). Genotype affects also campesterol and stigmasterol contents (p<0.01) but not β-sitosterol content. Location (Year) effect was only significant for campesterol content, but not for the total phytosterol content.
Significant and positive correlations between phytosterol components (Table 8) were observed: (1) between β-sitosterol and total phytosterol content (r² = 0.78; p<0.05); (2) between campesterol and β-sitosterol (r² = 0.67; p<0.05), and (3) between campesterol and stigmasterol (r² = 0.69; p<0.05).
Relationships between fatty acid, tocopherol and phytos-terol composition. The total tocopherol content was slightly
but significantly correlated with oleic acid (r² = + 0.40; p<0.01), and negatively correlated with linoleic acid (r² = -0.36; p<0.01) (Table 8). Total tocopherol content (as well as α-tocopherol and β-tocopherol contents) was negatively correlated with palmitic acid (r² = -0.70; p<0.01). Generally, the individual phytosterols and total phytosterol content were not significantly correlated with fatty acid content. This was the case for β-sitosterol, the main sterol in sunflower oil, which did not correlate with any fatty acid. Finally, total tocopherols and total phytosterols were positively correlated (r² = 0.47; p<0.01).
Table 8. Significant Pearson correlation coefficients between individual and total tocopherols, individual and total phytosterols and indi-vidual and total fatty acid contents in oil from four hybrids grown in different locations during 2002, 2003 and 2004 summers.
Tabla 8. Coeficientes de correlación de Pearson significativos entre tocoferoles individuales y totales, fitoesteroles individuales y totales, y con-tenido de ácidos grasos individuales y totales del aceite de cuatro híbridos cultivados en diferentes lugares en 2002, 2003 y 2004.
Component Correlation Coefficient Component Correlation Coefficient Tocopherols - Tocopherols Tocopherol - Phytosterol
α-tocopherol - β-tocopherol + 0.78 ** α-tocopherol - Campesterol + 0.26 * α-tocopherol - γ-tocopherol + 0.56 ** α-tocopherol - β-sitosterol + 0.27 ** α-tocopherol - δ-tocopherol + 0.66 ** α-tocopherol - Total phytosterol + 0.44 ** α-tocopherol - Total tocopherol + 0.99 ** β-tocopherol - Campesterol + 0.30 ** β-tocopherol - γ-tocopherol + 0.78 ** β-tocopherol - Stigmasterol + 0.43 ** β-tocopherol - δ-tocopherol + 0.75 ** β-tocopherol - β-sitosterol + 0.25 * β-tocopherol - Total tocopherol + 0.83 ** β-tocopherol - Total phytosterol + 0.57 ** γ-tocopherol - δ-tocopherol + 0.79 ** γ-tocopherol - Campesterol + 0.32 ** γ-tocopherol - Total tocopherol + 0.61 ** γ-tocopherol - Stigmasterol + 0.49 ** δ-tocopherol - Total tocopherol + 0.70 ** γ-tocopherol - β-sitosterol + 0.30 ** γ-tocopherol - Total phytosterol + 0.63 **
Phytosterol - Phytosterol δ-tocopherol - Stigmasterol + 0.33 ** Campesterol - Stigmasterol + 0.69 ** δ-tocopherol - Total phytosterol + 0.51 ** Campesterol - β-sitosterol + 0.67 ** Total tocopherol - Campesterol +0.27** Campesterol - Total phytosterol + 0.68 ** Total tocopherol - β-sitosterol + 0.27 **
Stigmasterol - β-sitosterol + 0.23 * Total tocopherol -Total phytosterol + 0.47 ** Stigmasterol - Total phytosterol + 0.54 **
β -sitosterol - Total phytosterol + 0.78 ** Tocopherols - Fatty acids
α-tocopherol - Palmitic − 0.68 **
Fatty acids - Fatty acids α-tocopherol - Stearic − 0.22 *
Palmitic - Oleic − 0.70 ** α-tocopherol - Oleic + 0.40 **
Palmitic - Linoleic + 0.66 ** α-tocopherol - Linoleic − 0.35 **
Palmitic - Linolenic + 0.36 ** β-tocopherol - Palmitic − 0.71 **
Stearic - Oleic − 0.52 ** β-tocopherol - Oleic + 0.36 **
Stearic - Linoleic + 0.51 ** β-tocopherol - Linoleic − 0.31 **
Oleic - Linoleic − 0.99 ** γ-tocopherol - Palmitic − 0.63 **
Oleic - Linolenic − 0.28 ** γ-tocopherol - Oleic + 0.28 **
Linoleic - Linolenic + 0.27 ** γ-tocopherol - Linoleic − 0.24 * γ-tocopherol - Linolenic − 0.24 *
Phytosterols - Fatty acids δ-tocopherol - Palmitic − 0.57 **
Campesterol - Stearic + 0.20 * δ-tocopherol - Oleic + 0.24 *
Campesterol - Linolenic − 0.22 * Total tocopherol - Palmitic − 0.70 ** Stigmasterol - Palmitic − 0.26 * Total tocopherol - Stearic − 0.21 * Total Phytosterol - Palmitic − 0.33 ** Total tocopherol - Oleic + 0.40 ** Total tocopherol - Linoleic − 0.36 ** Correlation coefficient significant at p = 0.05 (*) and p = 0.01 (**) level, respectively.
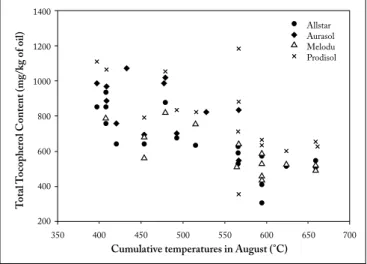
Relationships between components composition and meteorological conditions. Correlation between minor
components and the meteorological parameters were made to have a first sight of the influence of temperature and rainfall during seed growth. The cumulative temperatures in August showed a negative correlation with the total tocopherol content (r² = −0.69; p<0.05). This negative correlation was also observed for each tocopherol isomer (r² = −0.60; p<0.05) and for the total phytosterol content (r² = −0.38; p<0.05). The same tendency was also found for the cumulative temperatures in June, July and September. On the contrary, there was a positive correlation between the sum of precipitations in August and the total tocopherol and total phytosterol contents (Fig. 3). Campesterol and stigmasterol contents were positively correlated to the sum of precipitation in June (r² = +0.70; p<0.05).
DISCUSSION
Sunflower oil yield is generally influenced by temperature during seed development. Thus, high temperatures during seed maturation may have a negative effect in oil synthesis ( Baydar & Erbas, 2005; Ayerdi Gotor et al., 2006).
Alpha-tocopherol was the dominant isomer detected in this study, similar to the results obtained by Dolde et al. (1999) and Velasco et al. (2002). They only detected traces of δ-tocopherol in the sunflower materials analyzed. Our tocopherol total content was similar to the values reported by Nolasco et al. (2004) (500 to 1200 mg/kg oil). However, the maximum measured value was lower than the one found by Velasco et al. (2002) (562-1872 mg/kg oil). Despite this, Velasco et al. (2002) also found a similar correlation between tocopherols homologues.
Fig. 3. Correlation between cumulative temperatures of August and total tocopherol content.
Fig. 3. Correlación entre la temperatura acumulada de agosto y el contenido total de tocoferoles.
This study clearly showed that the variation of total to-copherol content is dependent on genotype and cultivation year. The annual effect was mainly influenced by the meteo-rological conditions such as temperature. Results obtained show that the tocopherol content in sunflower oil is highly correlated to temperature. This is in agreement with results of Almonor et al. (1998) on soybean oil and Ayerdi Gotor et al. (2006) on sunflower oil. Both studies showed a reduc-tion in total tocopherol content when plants were exposed to high temperatures during grain filling. However, Britz and Kremer (2002) reported that total tocopherol content in soybean oil remains constant despite differences in growth temperatures. The reduction in tocopherol content during a hot year could be explained by the role of these molecules in the plant. Tocopherols, particularly α-tocopherol protects the plants against heat stress by scavenging singlet oxygen and lipid peroxil radicals leading to decreased (detected) amounts of tocopherols (Munné-Bosch, 2005). Previous studies con-cerning tocopherol variation in sunflower and in other plant species (Peterson & Qureshi, 1993; Goffman & Becker, 2002; Marwede et al., 2004; Fernández-Cuesta et al., 2012) show that genotype and environment either individually or their interaction affect the content and composition in seeds.
The range found on phytosterol content is close to the one reported by Vlahakis and Hazebroek (210 to 454 g/100 g oil) and others authors (Vlahakis & Hazebroek, 2000; Ayerdi Go-tor et al., 2008; Fernández-Cuesta et al., 2012). As mentioned previously, the climate differed between years; 2002 was cold and wet, while 2003 was excessively warm and dry. The data presented indicate that low temperatures together with pre-cipitation correlate with an increase in the total phytosterol content. These results are in agreement with those found by Zangenberg et al. (2004) in rye (Secale cereale L.) grains. On the contrary, Vlahakis and Hazebroek (2000) showed that the total phytosterol levels in greenhouse grown soybean seed increase under higher temperatures under controlled condi-tions. However, Hamama et al. (2003) did not show signifi-cant differences concerning phytosterol content between dif-ferent genotypes of canola (Brassica napus L.), indicating that environmental conditions may affect the various species in a different manner.
The positive correlation observed between campesterol, stigmasterol and β-sitosterol indicate that the amount of different phytosterols could be simultaneously increased. In the literature, little is known concerning correlations between phytosterols contents. Fernandez-Cuesta et al. (2012) found a negative correlation between campesterol and stigmasterol, and between stigmaterol and β-sitosterol , but a positive correlation between campesterol and β-sitosterol. In canola oil, the same order of slight positive correlations between phytosterol components were observed (Hamama et al., 2003). In contrast, Hamama et al. (2003) found negative correlations between both campesterol and β-sitosterol
content and campesterol and Δ5-avenasterol contents. In this study, the only significant positive correlation was between brassicasterol and total phytosterol contents (r² = +0.40; p<1%).
Similar to the results of our study, Baydar and Erbas (2005) reported significant correlations between tocopherols and ole-ic acid content (r² = +0.79) as well as tocopherols and linoleole-ic acid content (r² = -0.82).
The negative correlation between β-sitosterol and campesterol or stigmasterol could be explained due to the different pathways of biosynthesis of β-sitosterol and the others phytosterols (Schaller, 2003). Indeed, Schaller (2004) identified in (1) Arabidopsis the Δ24-isomerase-reductase which produces β-sitosterol and campesterol, and (2) higher plants a Δ22-desaturase implicated in the transformation of β-sitosterol to stigmasterol and campesterol to brassicaterol (Vlahakis & Hazebroek, 2000). Such enzymes were species, genotype and growth-temperature dependent (Garcés et al., 1992; Almonor et al., 1998). These previous results could contribute to explain the absence of correlation between β-sitosterol and stigmasterol, and the high correlation between campesterol and stigmasterol observed herein.
The correlation between total tocopherols and total phytosterols for sunflower oil in this study are in agreement with earlier results obtained on 12 cultivars from the same planting location (r² = +0.69, p<0.05) (Vlahakis & Hazebroek, 2000).
The relationships between fatty acids, tocopherols and phytosterols and the climatic conditions during plant growth found in this study cannot be compared with data obtained by El-Shami et al. (2001) in rapeseed oil. In their study, correla-tions were obtained with values from only one genotype and one cultivation year, study which did not reflect any environ-mental influence.
However, this study indicated that both genotype and the growing conditions had a stronger influence on tocopherol composition and content than on phytosterol ones. Moreover, the contents of tocopherol, oleic acid percentage and phytosterol contents were positively correlated. Thus, it would be possible to increase tocopherol and phytosterol contents including high oleic acid content simultaneously through a breeding program.
ACKNOWLEDGMENTS
The authors thank Caussade semences, Maïsadour semences, Monsanto Dekalb, RAGT-R2n, Soltis, Syngenta Seeds for providing the field sites for the experiments and sunflower plant material. Financial support was provided by ASEDIS-SO, ONIDOL (French Oil seeds organization) and Midi-Pyrenees Region. We also thank Cognis-France for their technical support.
REFERENCES
Almonor, G.O., G.P. Fenner & R.F. Wilson (1998). Temperature effects on tocopherol composition in soybeans with genetically improved oil quality. Journal of the American Oil Chemists Society 75: 591-596.
Association française de normalisation (1998). European Norm, NF EN ISO 659 october 1998; French norm V 03-905: Oilseeds - Determination of oil content (Reference method). AFNOR. Paris. 14 + 3 pp.
Association française de normalisation (1999). European norm, NF EN ISO 12228 May 1999; French norm T 60-258: Animal and vegetable fats and oils - Determination of individual and total sterols contents - Gas chromatographic method. AFNOR. Paris. 18 pp.
Ayerdi Gotor, A., M. Berger, F. Labalette, S. Centis, J. Daydé & A. Calmon (2006). Etude de la variation des teneurs et compositions des composés mineurs dans l’huile de tournesol au cours du déve-loppement du capitule : Partie I - Tocophérols. OCL-Oleagineux
Corps Gras Lipides 13: 206-212.
Ayerdi Gotor, A., M. Berger, F. Labalette et al. (2008). Variabi-lité des teneurs et compositions des composés mineurs dans l’huile de tournesol au cours du développement du capitule. Partie II - Phytostérols. OCL-Oleagineux Corps Gras Lipides 15: 400-406.
Baydar, H. & S. Erbas (2005). Influence of seed development and seed composition on oil, fatty acids and total tocopherol contents in sunflower (Helianthus annuus L.). Turkish Journal of Agriculture 29: 179-186.
Beardsell, D., J. Francis, D. Ridley & K. Robards (2002). Health pro-moting constituents in plant derived edible oils. Journal of Food
Lipids 9: 1-34.
Bramley, P.M., I. Elmafda, A. Kafatos et al. (2000). Vitamin E.
Jour-nal of the Science of Food and Agriculture 80: 913-938.
Britz, S.J. & D.F. Kremer (2002). Warm temperatures or drought during seed maturation increase free alpha-tocopherol in seeds of soybean (Glycine max L. Merr.). Journal of Agricultural and Food
Chemistry 50: 6058-6063.
Demurin, Y., D. Skoric & D. Karlovic (1996). Genetic variability of tocopherol composition in sunflower seeds as a basis of breeding for improved oil quality. Plant Breeding 115: 33-36.
Dolde, D., C. Vlahakis & J. Hazebroek (1999). Tocopherols in breed-ing lines and effects of plantbreed-ing location, fatty acid composition, and temperature during development. Journal of the American Oil
Chemists Society 76: 349-355.
El-Shami, S.M., M.M.M Hassamein & M.H. El-Mallah (2001). Studies on changes in lipid profiles of new varieties of rape during seed maturation. Grasas y aceites 52: 94-103.
FAO (2013). FAOSTAT Database Food and Agriculture Organiza-tion.
Fernández-Cuesta, A., A. Nabloussi, J.M. Fernández-Martínez & L. Velasco (2012). Tocopherols and phytosterols in sunflower seeds for the human food marquet. Grasas y aceites 63: 321-327. Garcés, R., C. Sarmiento & M. Mancha (1992). Temperature
regu-lation of oleate desaturase in sunflower (Helianthus annuus L.) seeds. Planta 186: 461-465.
Goffman, F.D. & H.C. Becker (2002). Genetic variation of tocoph-erol content in a germplasm collection of Brassica napus L.
Hamama, A.A., H.L. Bhardwaj & D.E. Starner (2003). Genotype and growing location effects on phytosterols in canola oil. Journal
of the American Oil Chemists Society 80: 1121-1126.
Holliday, R. & K. Phillips (2001). Health Benefits of the Sunflower.
American Association of Cereal Chemists 46: 205-208.
International Standard Organization (1997). ISO 9936: Animal and vegetable fats and oils - Determination of tocopherols and tocotrienols contents - Method using high-performance liquid chromatography. ISO. Genève. 11 p.
Kritchevsky, D. (1997). Phytosterols. Dietary Fiber in Health and
Disease 427: 235-243.
Lagravère, T., D. Kleiber & J. Daydé (1998). Cultural practices and sunflower oilseed agronomic performance: facts and the future.
OCL: Oléagineux, Corps Gras, Lipides 5: 477-485.
Lagravère, T., D. Kleiber, O. Surel, A. Calmon, A. Bervillé & J. Daydé (2004). Comparison of fatty acid metabolism of two oleic and one conventional sunflower hybrids: A new hypothesis. Journal of
Agronomy and Crop Science 190: 223-229.
Määttä, K., A.M. Lampi, J. Petterson, B.M. Fogelfors, V. Piironen & A. Kamal-Eldin (1999). Phytosterol content in seven oat cultivars grown at three locations in Sweden. Journal of the Science of Food
and Agriculture 79: 1021-1027.
Marwede, V., A. Schierholt, C. Mollers & H.C. Becker (2004). Gen-otype x environment interactions and heritability of tocopherol contents in canola. Crop Science 44: 728-731.
Munné-Bosch, S. (2005). The role of alpha-tocopherol in plant stress tolerance. Journal of Plant Physiology 162: 743-748.
Niki, E. (2004). Antioxidants and atherosclerosis. Biochemical Society
Transactions 32: 156-159.
Nolasco, S.M., L.A.N. Aguirrezábal & G.H. Crapiste (2004). To-copherol oil concentration in field-grown sunflower is accounted for by oil weight per seed. Journal of the American Oil Chemists
Society 81: 1045-1051.
Packer, L., S.U. Weber & G. Rimbach (2001). Molecular aspects of alpha-tocotrienol antioxidant action and cell signalling. Journal of
Nutrition 131: 369S-373S.
Peterson, D.M. & A.A. Qureshi (1993). Genotype and environ-ment effects on tocols of barley and oats. Cereal Chemistry 70: 157-162.
Ruiz-Gutiérrez, V., F.J.G. Muriana, A. Guerrero, A.M. Cert & J. Villar (1997). Role of dietary oleic acid from two different sources on fatty acid composition of erythrocyte membrane and blood pressure in healthy subjects. Journal of Nutritional Biochemistry 8: 689-695.
Schaller, H. (2003). The role of sterols in plant growth and development. Progress in Lipid Research 42: 163-175.
Schaller, H. (2004). New aspects of sterol biosynthesis in growth and development of higher plants. Plant physiology and biochemistry 42: 465-476.
Seiler, G.J. (1983). Effect of genotype, flowering date, and environ-ment on oil content and oil quality of wild sunflower seed. Crop
Science 23: 1063-1068.
Thompson, G. R. & S.M. Grundy (2005). History and development of plant sterol and stanol esters for cholesterol-lowering purposes.
American Journal of Cardiology 96: 3D-9D.
Velasco, L., J.M. Fernández-Martínez, R. García-Ruiz & J. Domín-guez (2002). Genetic and environmental variation for tocopherol content and composition in sunflower commercial hybrids.
Jour-nal of Agricultural Science 139: 425-429.
Vlahakis, C. & J. Hazebroek (2000). Phytosterol accumulation in canola, sunflower, and soybean oils: Effects of genetics, planting location, and temperature. Journal of the American Oil Chemists
Society 77: 49-53.
von Bergmann, K., T. Sudhop & D. Lütjohann (2005). Cholesterol and plant sterol absorption: recent insights. The American Journal
of Cardiology 96: 10D-14D.
Zangenberg, M., H.B. Hansen, J.R. Jorgensen & L.I. Hellgren (2004). Cultivar and year-to-year variation of phytosterol content in rye (Secale cereale L.). Journal of Agriculture and Food Chemistry 52: 2593-2597.
Zock, P.L. & M.B. Katan (1998). Linoleic acid intake and cancer risk: a review and meta-analysis. American Journal of Clinical