HAL Id: hal-01618834
https://hal.archives-ouvertes.fr/hal-01618834
Submitted on 15 Nov 2017
HAL is a multi-disciplinary open access
archive for the deposit and dissemination of
sci-entific research documents, whether they are
pub-lished or not. The documents may come from
teaching and research institutions in France or
abroad, or from public or private research centers.
L’archive ouverte pluridisciplinaire HAL, est
destinée au dépôt et à la diffusion de documents
scientifiques de niveau recherche, publiés ou non,
émanant des établissements d’enseignement et de
recherche français ou étrangers, des laboratoires
publics ou privés.
Automatic speech analysis for early Alzheimer’s disease
diagnosis
Saeideh Mirzaei, Mounim El Yacoubi, Sonia Garcia-Salicetti, Jérôme Boudy,
Christian Kahindo Senge Muvingi, Victoria Cristancho-Lacroix, Hélène
Kerhervé, Anne-Sophie Rigaud Monnet
To cite this version:
Saeideh Mirzaei, Mounim El Yacoubi, Sonia Garcia-Salicetti, Jérôme Boudy, Christian Kahindo Senge
Muvingi, et al.. Automatic speech analysis for early Alzheimer’s disease diagnosis. JETSAN 2017 :
6e Journées d’Etudes sur la Télésanté, May 2017, Bourges, France. pp.114 - 116. �hal-01618834�
Automatic Speech Analysis for Early Alzheimer’s
Disease Diagnosis
Saeideh Mirzaei, Mounîm El Yacoubi, Sonia Garcia-Salicetti, Jérôme Boudy, Christian Kahindo, Victoria
Cristancho-Lacroix, Hélène Kerhervé, Anne-Sophie Rigaud
Télécom SudParis, CNRS, Université Paris-Saclay, France
AP-HP, Groupe Hospitalier Cochin Paris Centre, Hôpital Broca, Pôle Gérontologie, Paris, France Université Paris Descartes, EA 4468, Paris, France
{saeideh.mirzaei ; mounim.el_yacoubi ; sonia.garcia ; jerome.boudy ; christian.kahindo}@telecom-sudparis.eu {victoria.cristancho-lacroix ; helene.kerherve ; anne-sophie.rigaud}@aphp.fr
Abstract - We extract voice features from read speech of patients diagnosed as having Alzheimer’s disease and mild cognitive impairment versus healthy control group at the AP-HP Broca Hospital. Two classification methods are used to evaluate the efficiency of these features. Finally, a wrapper feature selection method as exploits both methods is also evaluated.
Keywords: Speech analysis, MCI, Alzheimer, K-NN, SVM, Feature selection.
I. INTRODUCTION
Alzheimer’s Disease (AD) is the first common form of
dementia. From early stages to severe cases of AD, the symptoms include decline in surrounding awareness, lack of interest for unfamiliar subjects, increase of distractions, and so on [2]. AD diagnosis is done by different tests including CT scan, MRI and other invasive methods. Although patients with AD may reveal different symptoms, this disease is usually identified by impairment in memory, especially the short-term memory in the early stages of the disease. The most affected part of brain is more precisely indicated as the central executive component of the working memory (based on Baddeley’s model for working memory) [1]. The central executive part of working memory establishes the attentional control system and drives task planning. Impairment in short-term memory results in losing track of recent events or conversations and particularly decline in multi-task performance [1]. Considering the fact that people with AD do not lose their consciousness and more over the social effects of the disease, including lives of those with AD and their caregivers and the country economy, its early and accurate diagnosis with low-cost non-invasive methods is of great interest.
Mild Cognitive Impairment (MCI) is associated with a range of diseases affecting different regions of the brain and needs a longitudinal study. It may result in decline of one or some of cognitive abilities of the patients e.g. the analytical skills, memory capacity, visual or/and auditory perception, language processing and production abilities, etc. The MCI diseases are in general categorized into two main classes, amnestic and non-amnestic. While it has not yet been confirmed, nor all the
patients with MCI develop the disease (i.e. they may show stable conditions over time), the former is said to mostly lead to AD and the latter to other forms of dementia. Hence, it would be interesting to observe the features change from MCI to AD. In [6], the vocal features were used to distinguish AD and MCI from Healthy Control (HC) group.
In this work, we aim to find the markers of MCI and AD in read speech for early diagnosis of these diseases by extracting features from voice of patients and using two classification methods. Next section describes the data set. We review the features we used in our experiments in Section 3 and follow by explaining the methods in Section 4. We present the results in Section 5 and conclude the work with a perspective for future work in Section 6.
II. DATA
Our data consists of recordings from 42 patients with MCI, AD and normal conditions (Healthy Control-HC), having 14 people in each group. All the patients are over 60 years old, advanced French speakers with reading and writing ability, controlled for visionary ability and tested with standard Mini Mental Score Exam (A score with maximum 30). One of the inclusion criteria for the participants was that the patient would not take any medications as it might interfere with brain performance. Furthermore, the purpose of this study was the early detection of AD patients, hence, only participants with the MMSE higher than 20 were included in the studies. All the participants were informed of the test purpose and signed the consent approval. Table I shows the statistics of our data set used in this paper.
The participants are asked to read the following passage of the book ‘Le petit prince’:
“ Tu n'es encore pour moi qu'un petit garçon tout semblable à
cent mille petits garçons. Je ne suis pour toi qu'un renard semblable à cent mille renards. Voici mon secret: on ne voit bien qu'avec le cœur. L'essentiel est invisible pour les yeux. ”
The sampling rate of recordings is 44100 Hz. The original recordings were double channel but only one band of the two is used in this work.
TABLE I. Data statistics with 14 patients in each group
Group Age MMSE
HC 73,5 (±6,0) 28,7 (±1,0) MCI 79,2 (±5,6) 27,8 (±1,8) AD 79,8 (±6,5) 24,0 (±3,7)
III. FEATURES
The feature set is consisted of 15 elements; 4 related to
fundamental frequency, 2 related to speech segments and 9 to jitter and shimmer. The approach to extract each is explained in the following.
A. Fundamental frequency
We estimate the fundamental frequency by using the autocorrelation function as in yin [4] (with the d` threshold of 0.25 for speech segment detection). Before segmenting, the signal is filtered with a band-pass filter with cut-off frequencies of 30 and 1100 Hz. The window length of 20ms and 50% overlap between windows were used and the fundamental frequency is calculated for all the segments. Afterwards, the minimum, maximum, mean and standard deviations of the fundamental frequencies are calculated over all the speech segments.
B. Speech segments
Following the previous analysis, the speech and non-speech segments were detected by considering the segment as speech if 4 consecutive segments (of 20 ms each) met the above mentioned criterion (d` < 0.25) and then only changed to non-speech if 8 consecutive segments did not meet the criterion. The speech portion and number of silences are calculated by dividing the number of speech segments to the whole segments and counting the number of speech interruptions respectively.
C. Jitter and shimmer
The jitter and shimmer values, defined as F0 variation between
segments and amplitude variation between peaks respectively, are obtained as defined in [5]. This set consists of all the nine variants introduced in the aforementioned paper and are presented partially by the following formulae:
IV. CLASSIFICATION AND FEATURE SELECTION
The Leave-one-out method is used for all the experiments in this work. In our first experiment, we used the K-Nearest Neighbor (kNN) with Euclidean distance measure for classification. Here we used the full feature set. The same experiment was implemented by using the multi-class Support Vector Machine classifier using LIBSVM [3].
Furthermore, we applied a wrapper feature selection method and backward feature elimination to reduce the feature dimension. The total accuracy was the criterion to eliminate the features, i.e. we eliminated the feature if its elimination resulted in the total accuracy improvement or made it remain constant. Figure 1 shows the procedure by which feature reduction is done.
Figure 1. Feature selection; Accuracy (total accuracy of classifier) is defined as a function with the feature set as input
The classification accuracy for each class is defined as the number of correctly classified samples to the total number of samples in the group. The total accuracy is the average of classification accuracies in all groups.
V. RESULTS
After forming the complete set of features, we used kNN with k changing from 3 to 9. After several trials, k equal to 5 was decided to be used for further experiments. The full set of features was used with a Linear SVM classifier as well. Table II shows the confusion matrices for classification with the two methods. It is shown that kNN performs better and classifies the samples more accurately. It can be seen in the case of SVM, the confusion between HC group and AD group is very high.
TABLE II. Confusion matrices for classification with full feature set using SVM (left) and kNN (right).
True Class HC MCI AD True Class HC MCI AD
HC 43% 21% 36% HC 68% 22% 11% MCI 36% 43% 21% MCI 28% 61% 11% AD 43% 36% 21% AD 18% 47% 36%
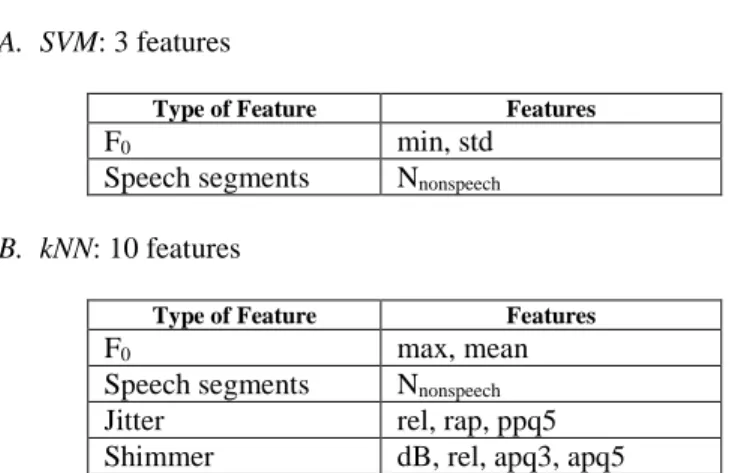
In the second experiment, we reduced the feature dimension by backward elimination and using kNN and SVM. The final set, where eliminating any more feature would have resulted in accuracy decline, consisted of the following set of features using each of the classifiers:
A. SVM: 3 features
Type of Feature Features
F0 min, std
Speech segments Nnonspeech
B. kNN: 10 features
Type of Feature Features
F0 max, mean
Speech segments Nnonspeech
Jitter rel, rap, ppq5
Shimmer dB, rel, apq3, apq5
We observed that 3 features were selected by SVM and 10 features by kNN. The classification with each of these optimal sets was done by the corresponding classifier. The results are given as confusion matrices in Table III.
TABLE III. Confusion matrices for classification with selected feature set using SVM (left) and kNN (right).
True Class HC MCI AD True Class HC MCI AD
HC 43% 28% 28% HC 57% 25% 18% MCI 7% 71% 21% MCI 25% 68% 7%
AD 14% 36% 50% AD 11% 39% 50%
The number of samples in each group is 14. It can be observed that the accuracy for both classifiers was improved by feature size reduction. The overall accuracy with kNN was improved from 55% to 58%, i.e. 5% relative improvement. With SVM as classifier, the feature selection method yielded more improvement in results, a 53% relative accuracy improvement from 36% to 55%. However, kNN performed better than SVM in both cases (before and after feature selection).
Among cognitive profiles, both classifiers could best classify the MCI group (with 68% for kNN and 71% for SVM). Moreover, they had high confusion rates with MCI profiles when classifying the AD profiles. We see that kNN performed better than SVM on the HC group (57% against 43%). Note that again both classifiers had high confusion rates with MCI group when classifying the HC group. This could be explained by the heterogeneity of the MCI group.
VI. CONCLUSION AND PERSPECTIVES
In this paper, we presented our experiments with features extracted from read speech to find relevant markers of voice in HC, MCI and AD patients. We used two classification methods of kNN and SVM to test these features and observed how
changing the number of features improved the performance of classifiers in terms of classification accuracy. By wrapper feature elimination, we found the most significant features by using kNN and SVM classification methods. The best classifier in our experiments was the kNN with 10 features, which had acceptable performance in classifying the HC and MCI group but not with the AD group. Overall, after feature selection, the performance of kNN was relatively improved by 76% with respect to the a priori class probabilities of 33%. We observed that the AD and HC groups were mostly confused with the MCI group. One reason could be the heterogeneity of the MCI group; the other possible reason is that the initial set of features lacks of relevant information. We actually obtained acoustical features mostly relevant in our feature selection experiments, which are not consistent with those used by [König et al.]. In our future work, we will try to extract more features (e.g. MFCCs, other temporal features) and use more data in order to launch the same experiments. Other classifiers may be used as well to better evaluate our features and discriminate AD- MCI and MCI-HC classes.
ACKNOWLEDGMENT
This work was funded by Fondation MAIF.
REFERENCES
[1] Baddeley, A.D., Bressi, S., Della Sala, S., Logie, R. and Spinnler, H., 1991. The decline of working memory in Alzheimer's disease. Brain, 114(6), pp.2521-2542.
[2] Blanken, G., Dittmann, J., Haas, J.C. and Wallesch, C.W., 1987. Spontaneous speech in senile dementia and aphasia: Implications for a neurolinguistic model of language production. Cognition, 27(3), pp.247-274.
[3] Chang, C.C. and Lin, C.J., 2011. LIBSVM: a library for support vector machines. ACM Transactions on Intelligent Systems and Technology (TIST), 2(3), p.27.
[4] De Cheveigné, A. and Kawahara, H., 2002. YIN, a fundamental frequency estimator for speech and music. The Journal of the Acoustical Society of America, 111(4), pp.1917-1930.
[5] Farrús, M., Hernando, J. and Ejarque, P., 2007, August. Jitter and shimmer measurements for speaker recognition. In INTERSPEECH (pp. 778-781).
[6] König, A., Satt, A., Sorin, A., Hoory, R., Toledo-Ronen, O., Derreumaux, A., Manera, V., Verhey, F., Aalten, P., Robert, P.H. and David, R., 2015. Automatic speech analysis for the assessment of patients with predementia and Alzheimer's disease. Alzheimer's & Dementia: Diagnosis, Assessment & Disease Monitoring, 1(1), pp.112-124.